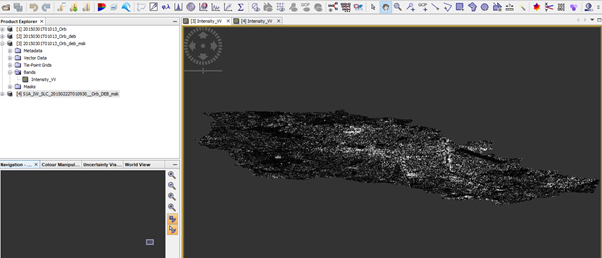
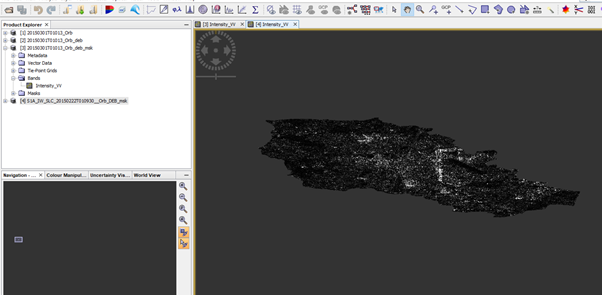
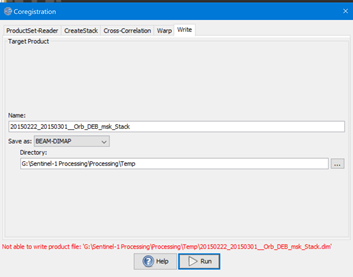
Now, As another try, what I downloaded two Sentinel-1 SLC of 22 Feb 2015 and 01 March 2015. Since I could not identify where my city was, instead of doing Split, I went straight away to Deburst after applying orbit correction. Then I added my city shapefile and using Land/sea mask got the masked image. Now when I try to do corregistration it says cannot create product.
The ALOS PALSAR radar wavelength is about 24 cm (L-band). That means that one fringe is 12 cm of line-of-sight displacement and the smallest motion you can detect is about 1 cm or maybe a little less. Your short interferogram (46 days is the shortest possible with the ALOS orbits) looks like it has good interferometric quality. Subsidence rates in most cities are less than 10-20 cm per year, so the amount of displacement in 46 days might not be detectable.
JAXA allowed the orbit of the ALOS satellite to drift and then did a large reset in the middle of 2008. This means that there are often two-year ALOS pairs from 2007 to 2009 that have short baselines. I would see if you can find ones like that.
Thankyou EJFielding for the great explanation. Makes sense to me why I cant see any subsidence in even 6 months temporal pair. Means I should focus on pairs with only 1 year or 2 year time gap.
And as you said finding an image pair with 2 years gap and small perpendicular baseline. How do we do it. is it just hit and trial method. Download the pairs and see if they have small baseline or not.
And are there any specific months that we should focus on say march to march or so on. We have winters in Dec-Feb, Summers in May-June, Rainy in July-Sept.
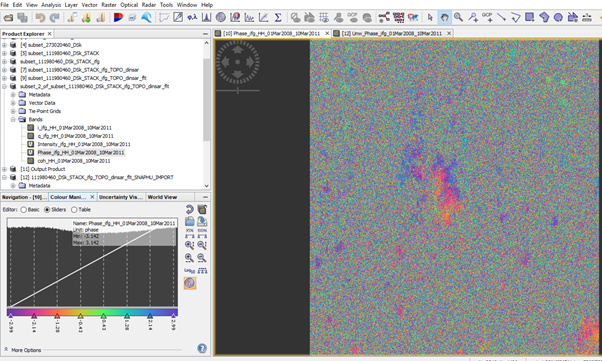
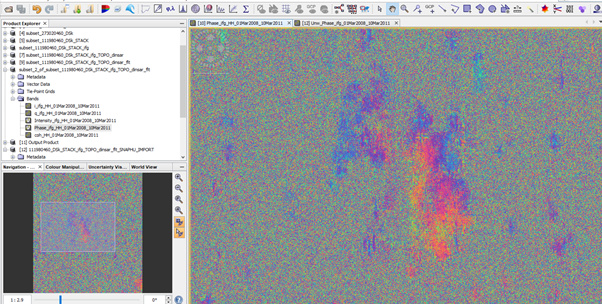
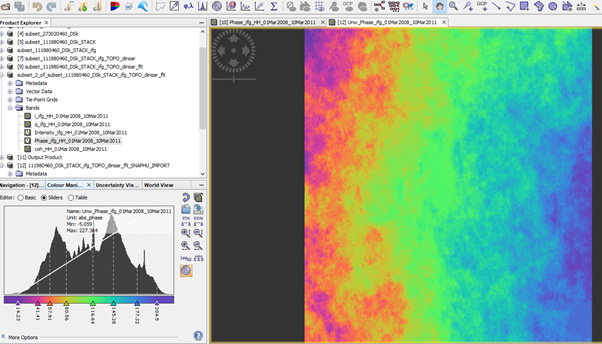
Dear Mr. @ABraun and @EJFielding with your guidance I have been somewhat able to get interferograms from my Alos-1 data. Not sure but think they do look like fringes. (Fig.1). Could you also please see and let me know why i get the lines in the interferogram as in (Fig. 2). And does the unwrapped image (Fig. 3) makes any sense. Though I cannot make out any clear subsiding area, will the calculated displacement be correct.
Technically the unwrapping worked correct. However the large decorrelated areas caused a strong ramp in your image. These areas are not valid.
You might trying to mask them out as described here before the unwrapping: Is it the right way to create mask for phase unwrapping?
It is another question if the patterns over the city are feasible. This requires local expertise. What kind of subsidence do you expect?
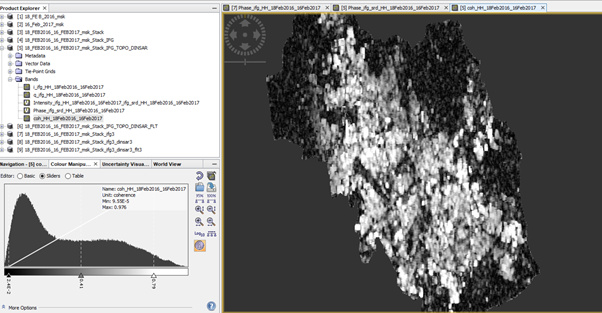
You can mask out low coherence areas and export to Google Earth to check if the patterns you observe over the urban area make somehow sense. Do you have any ancillary data (gauging stations or gnss measurements)?
Another option is to check if this pattern also occurs in other image pairs.
Yes the same type of pattern in also there in many pairs now. I do not have gps measurements. As suggested by you I am trying topographic removal using cartosat-1 dem. May be that helps me further. Would let you know if I could work out with it.
One more doubt here. When I mask and extract the cartosat dem to a polygon around my city and try to use it for topographic phase removal, I get error" cannot construct data buffer" but when i do it srtm 1 sec it works fine. Is their some problem with the method i am using.
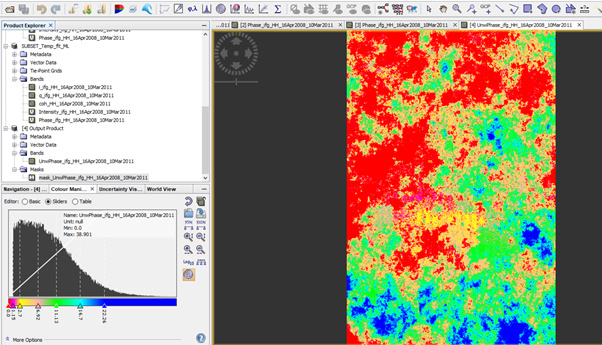
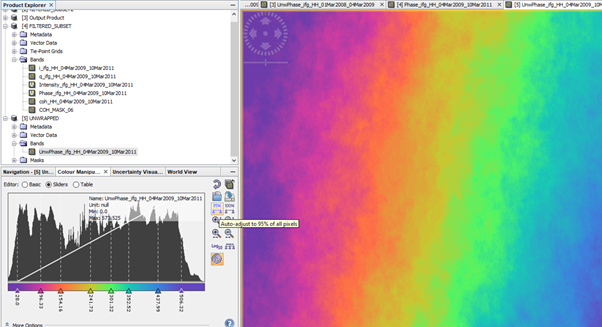
I understand thats its not feasible for you to answer my queries step by step, but I am really excited to have come quite close to my goal of deriving the displacement maps. Thats all coz of your support. Since I am just interested in the city thing, I further subsetted the image close to the city boundary. The unwrapped phase is like below. Do you think this phase is ok with less decorrelated areas and will my displacement come out to be reasonable.
this is memory related. The spatial resolution of the Cartosat DEM is probably exceeding your system’s capacities. But SRTM is sufficient for topographic phase removal. The important thing is that you include this step!
Your new result looks better. Still some strange phase jumps, but no longer a large ramp over the entire image.
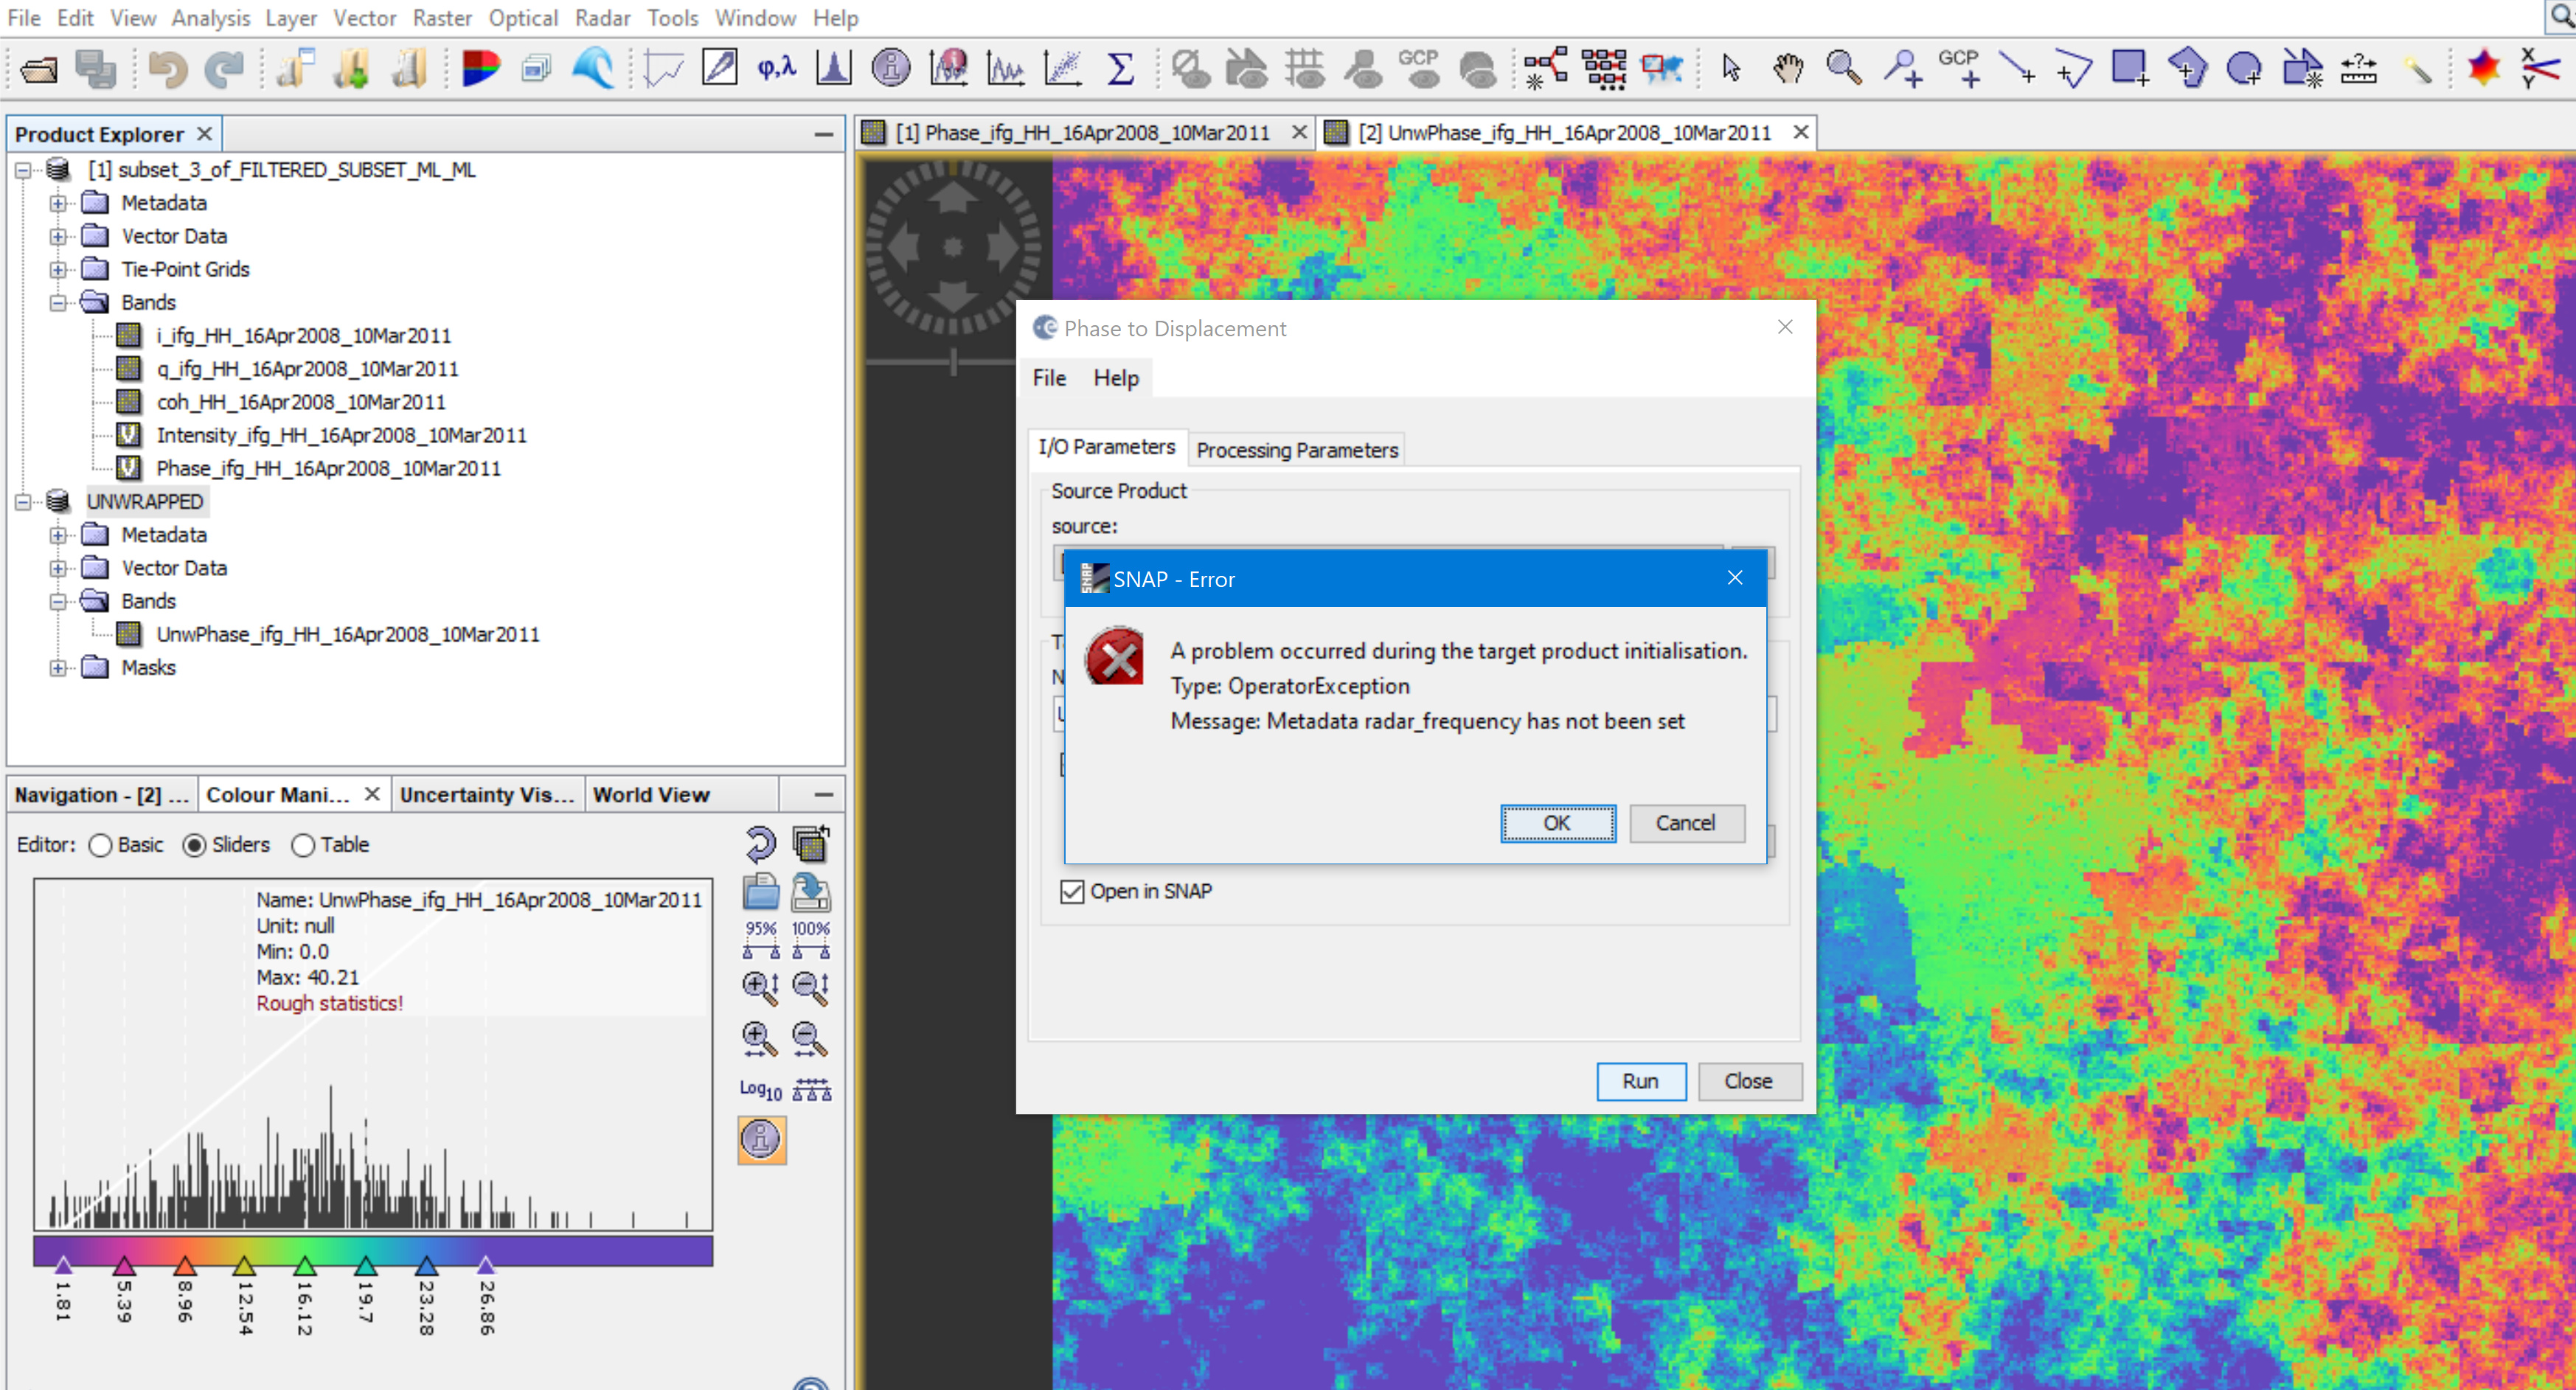
I tried to search answer for this error, but could not understand it. Earlier phase to displacement use to work. But now when I do it on my city subset it gives me an error. Dont understand why. No metadata has been changed.
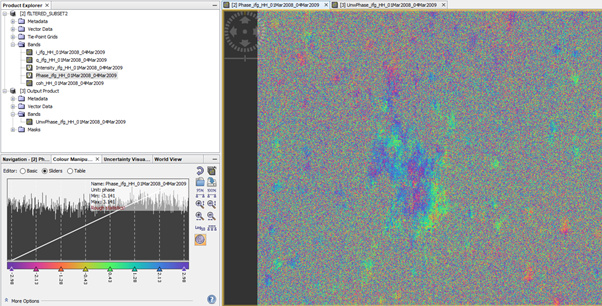
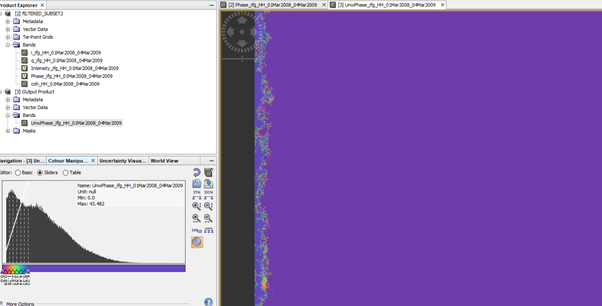
Could somebody give me an idea on whats going wrong. I get similar patterns of interferogram in two image pairs. But in first I get some output in unwrapping ( Fig 1 and 2) but not in other one (fig. 3 and 4). I have been following the same method and have tried for many other pairs. The interferograms look the same but after unwrapping it doesnt show anything.
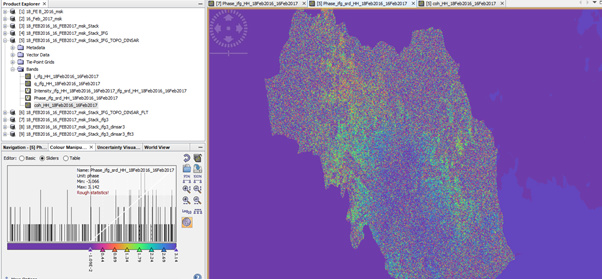
Sorry, but I am almost frustrated by now.why dont i get any fringes in any pair. i have tried more than 50 pairs of alos -1 and alos-2. Most of the research papers have fringes even if the LOS is 2cm/yr. For me it seems to be good coherence over the city. then what could be the issue. If I consider that Alos-2 has a larger wavelength than SentineI and I should not expect anything better than this (below fig), but I remember somebody showed me good fringes with the same images few years back. I am not in contact with that person. Could I do something to get fringes from my images. I would really appreciate your guidance in this regards. Thanks.
we discussed some parameter settings (and ionosphere removal with ISCE) in this topic, maybe some of them match your needs. Interferogram from Alos palsar 1.1 data