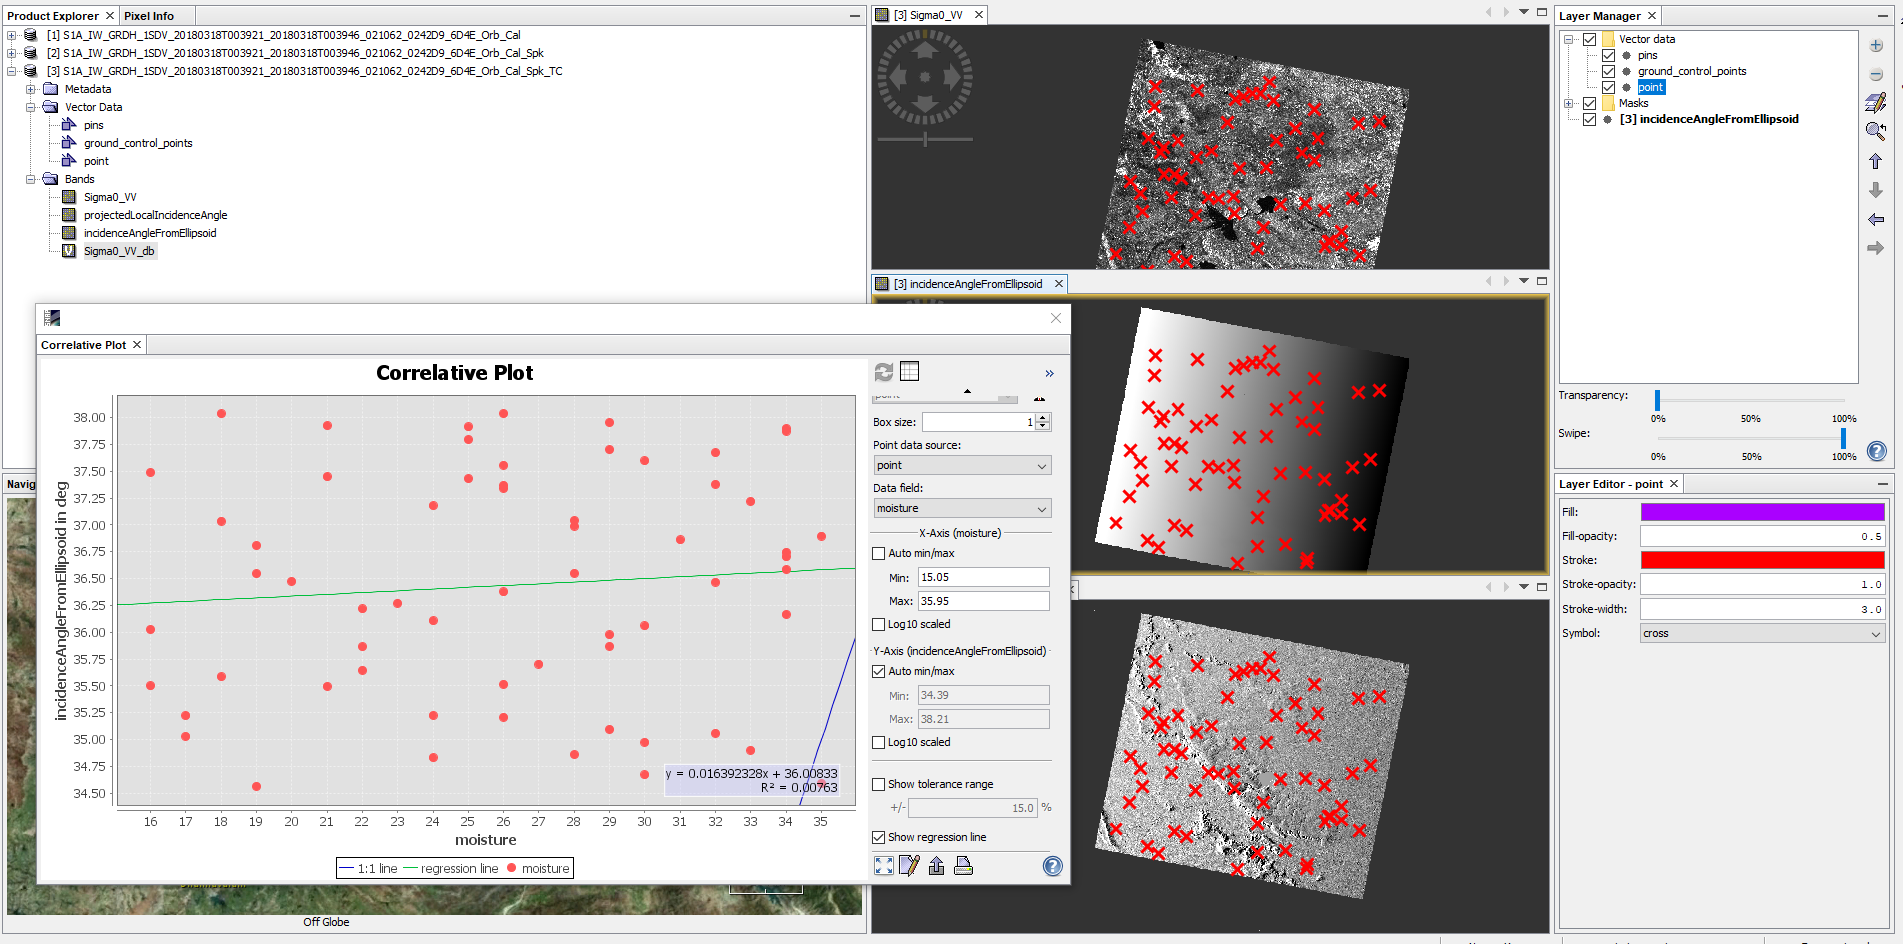
the correlative plot view should be good for you then. ![]()
You calibrate to Sigma0, then import your measurements and plot them against the incidence angle.
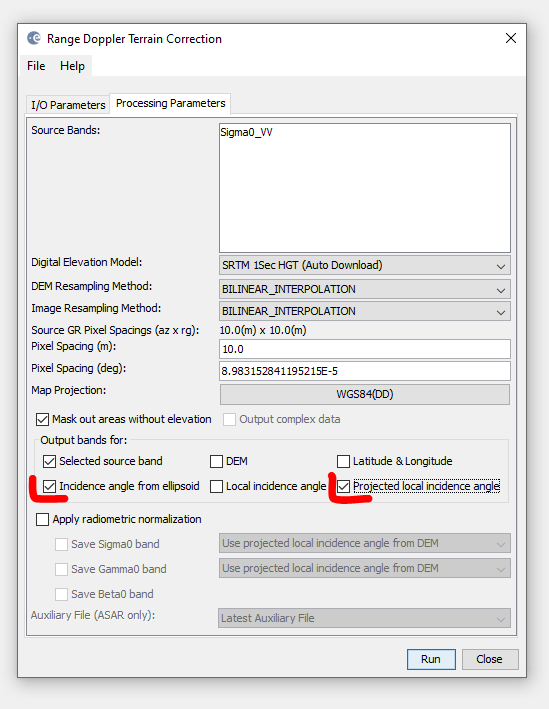
Make sure to select “Incidence Angle From Ellipsoid” and/or “Local incidence angle” during the terrain correction, so you can also use this for your analyses:
I used random point values in my example so the plots do not look very nice, but it technically works.