Basic Subsidence Formation

Yes I could try that.
I will share the results as soon as possible.
I however have a few follow up questions:
while playing with the ifg parameters, if I input high polynomial degrees i can get the elevation band generated from the ifg look similar to the elevation band generated by SNAP (with right click on product, generate elevation band).
I have not found any combinations that would result in an exact match of the elevation bands, which makes me think that the coregistration failed?
I will post different combination results, with DEFO and SMOOTH also.
But how can I readily assess the coregistration outcome ?

[EDIT]: Also, how to interpret the fact that with the Stack Cor. the wrapped and unwrapped phases were very similar? (top row of figure one)

why should the interferogram look like the elevation band?
According you your screenshot, you selected to remove topographic phase, so any pattern which remains is no longer related to the underlying topography.

You can visually check the quality of the coregistration by creating an RGB band with the both intensity bands. The RMS of the coregistration can be found in the InSAR tool. Please check this tutorial InSAR Displacement mapping with ERS data (page 11) for more explanations.

Thank you for your reply!
now I got a better idea how to assess the coregistration.

Regarding the elevation band I did not mean that the interferogram should look like the elevation band.
Perhaps I miss communicated this part. What I mean is the following:
In the parameters of the interferogram generation, after one selects to remove topographic phase he can elect to create 2 output bands

  1. Output elevation Lets call that elevation_ifg
  2. Output orthorectified lat/lon.
    like in this screenshot (do not mind the parameters, they are just the default ones)

    I output both of them.

We can also get the elevation band directly from the product itself with right click on the product name + add elevation band as show here. Lets call that elevation_add

Hence I have 2 elevation bands for the same product!
here follows the 2 elevations bands:

On the left we have the elevation_add while in the middle we have elevation_ifg. Comparing these two it seems that the elevation_ifg is shifted to the left by almost 500m.
The elevation band on the right has been created in the same manner as elevation_ifg but with using the default coregistration/interferogram parameters and it seems totally off. Presumably due to bad coregistration or bad topographic phase removal. I thought to present it here just for display and comparison purposes. i will disregard it from further processing.

Next, I thought to orthorectify the product, along with its two elevation bands, to see if any of both would match the topography of the scene. Of course, I also saved the output band DEM during range doppler t.c., lets call this one elevation_DEM. Below you can see these images:


On the top: Elevation_DEM. Google projection suggested that this band matches the ground very good, so we will keep this as reference.
Middle: Elevation_add
Bottom: Elevation_ifg
It is observed that both elevations_ add/ifg do not match very good the DEM one. They are both adjacent to it, with a shift of about 200 or 300 meters each. This is apparent by looking at the cross symbol that apparently is placed at exactly the same spot in all displayed images.

-What to make of this?
-Since I get such a big shift between elevation_add and elevation_ifg, and since both of the them are not well placed on earth, can I really trust the end results of the coregistration and interferogram generation, and after all the end-displacement map?

now I undestand. Interesting…

Was the same color scheme (min/max) applied to all three DEM outputs?

Also, can you please tell me where are the jumps located in the 2 top interferograms of the

So I can see if SMOOTH will resolve this issue? and to understand what jumps are :slight_smile:

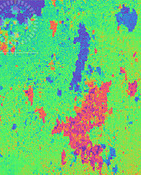
such abrupt changes should not happen in unwrapped interferograms

grafik

aah I see! not this is the bad interferogram, that I will not use, derived from DEM-Assisted coregistration and low degree polynomial order in interferogram creation.

You are right, here follows the same image as before, with the same color coding of the elevation DEM


Again the order is the same,

  1. elevation_DEM
  2. elevation_add
  3. elevation_ifg

Now they are! in the previous post,
So, any ideas what to make of it?
Would that make the end displacement map not-trustworthy?

that looks better. Indeed, smaller differences of the used DEM can occur depending on the resampling and pixel size of the inputs. So the variations you see here are totally okay, because the main pattern of displacement will still be derived from the phase difference of the two input products. Topographic phase is just removed to prevent unwrapping errors, so it does not harm if it is differently estimated for the inputs.

OK I see! So after all I can trust the end result? -Would I have to apply any shift to the end result so as to make it match its true ground position considering the elevation_DEM?

I will play a little with the interferogram parameters and post the results again to discuss them, so I can understand how to evaluate them

you can check if there are preprocessed interferograms of your area in this portal: https://comet.nerc.ac.uk/COMET-LiCS-portal/

They are a good reference regarding how good ones look like. Click on a tile, then “Link” then “interferograms” and select a date. There are png files for comparison.
The differences regarding the DEM do not cause shifts, but you have to level all displacements at one stable point. We had a discussion on this here: Different results in the study of land subsidence using the Sentinel-1 satellite image

Sadly there are no available ifgs for my study area, in that site.

Here follows an image of ifg generation:


the ordering is top row left to right and then bottom row left to right (1 2 3 4 5)

  1. Polynomial Degree 6
    Orbit Degree 1
  2. Polynomial Degree 6
    Orbit Degree 2
  3. Polynomial Degree 6
    Orbit Degree 3
  4. Polynomial Degree 6
    Orbit Degree 4
  5. Polynomial Degree 6
    Orbit Degree 5

I have also tried these combinations with varying Polynomial degree from 2 to 8 taking even number, resulting in highly similar ifgs (if not identical).

By the looks of 4 and 5 it seems that the ionospheric effect is eliminated.
-Is it true?

I then chose to proceed with 4, so as not to take the extreme values of combinations.
Then i performed the goldstein filtering and phase unwrapping as shown:


left: Wrapped right:Unwrapped

I am impressed on how similar these two are.
i do not know if that is expected.

Next follows the displacement map, based on the unw/ ifg.:


Left: coherence estimation, right:Displacement (for coh>0.5)

What do you think of the process so far?
Am I lead astray by seemingly “good” results? or are they actually useful results?

I think I got what you said here, i will take this to the big scale. I will also take two consecutive pair this time, based on the approach mentioned above. Subtract the relative difference and see what happens.
I am thinking of using the Polynomial Degree 5 and Orbit Degree 4 combination as being the closest match to the default values of snap, while eliminating those slow varying waves.

After all, i would see no relative displacement in rivers and in urban like areas, right?
just trying to imagine how to assess the end result

PS. Do you think it would be best to coregister non-calibrated products?

Can’t tell which areas are suitable as stable reference point. Once you identified one, make sure it’s value is zero in all pairs for best comparability.

What do you mean with ‘uncalibrated products’?

I mean Radiometric Calibration (or even Speckle filtering).
So far I have been using non-processed products

these operators are applied on backscatter intensity while interferometric methods work with the phase information. So calibration and filtering is not necessary (or useful) here.

OK great! :slight_smile: Thank you!

I created 2 interferograms, based on the same pair as always.

They look like this:


Left: Polynomial Degree 5, Orbit Degree 4
Right: Polynomial Degree 6, Orbit Degree 5

Do you think they still suffer from ionospheric affects?
-Are they “good enough” to continue processing?
Based on your experience that is

I really can’t tell from looking at them, sorry.

At least they do not contain these regular stripes any more.