Greetings all!
I am initiating this post to ask about basic steps in creating a subsidence map from numerus consecutive interferometric steps.
I have followed the information in here (and every other thread I could find):
https://forum.step.esa.int/t/subsidence-map-in-3d-view/3135
https://forum.step.esa.int/t/subsidence-map/10621/61
https://eo-college.org/resource/insar_deformation/
I work with ALOS-2 PALSAR images:
What would be the best pol for interferograms? HH or VV
Should the original product be calibrated or not?
Should I apply any speckle filtering/ and at which stage?
In my understanding I have to:
- Coregister 2 products:
-Would that be meaningful if I coregister the scenes in their full extent? (that might contain sea area) - Create Interferogram in SNAP:
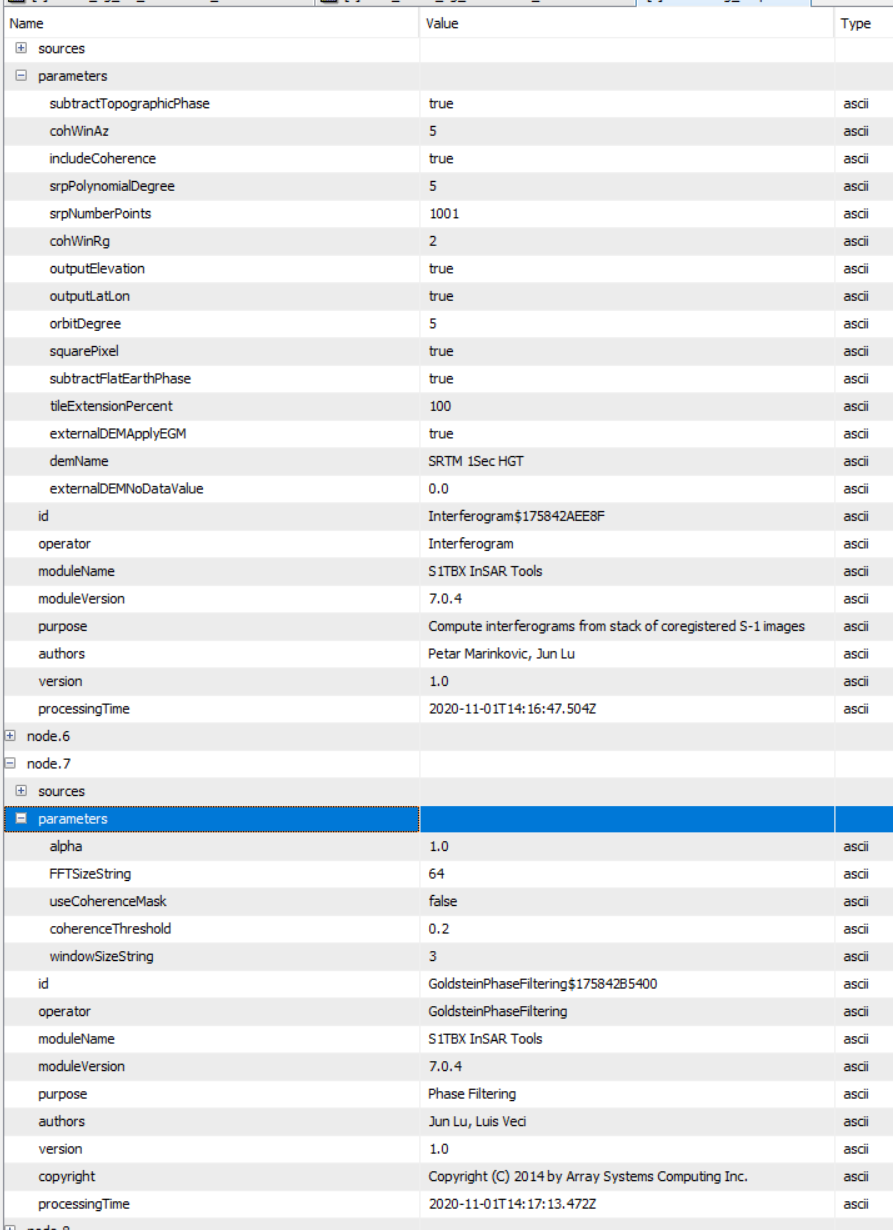
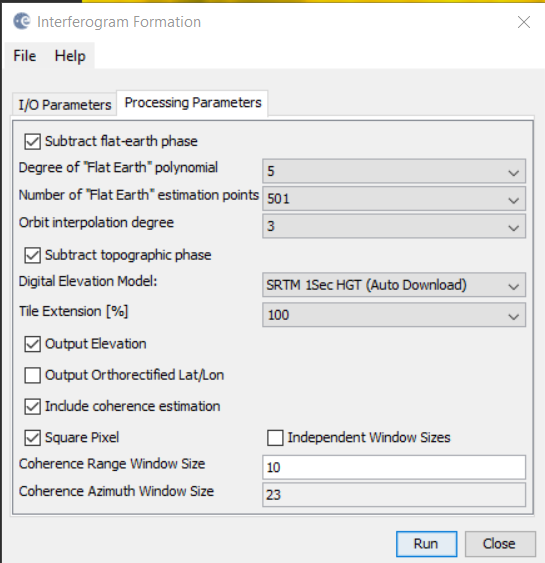
-I have used the defaults values for removing flat-earth/topographic phase as well as the coherence evaluation
Do I need to play with the values? (for which I have no understanding) - Apply Goldstein Filter:
-Again with default values: Do I have to change them? Do I have to apply the filter 2 or 3 times? - SNAPHU:
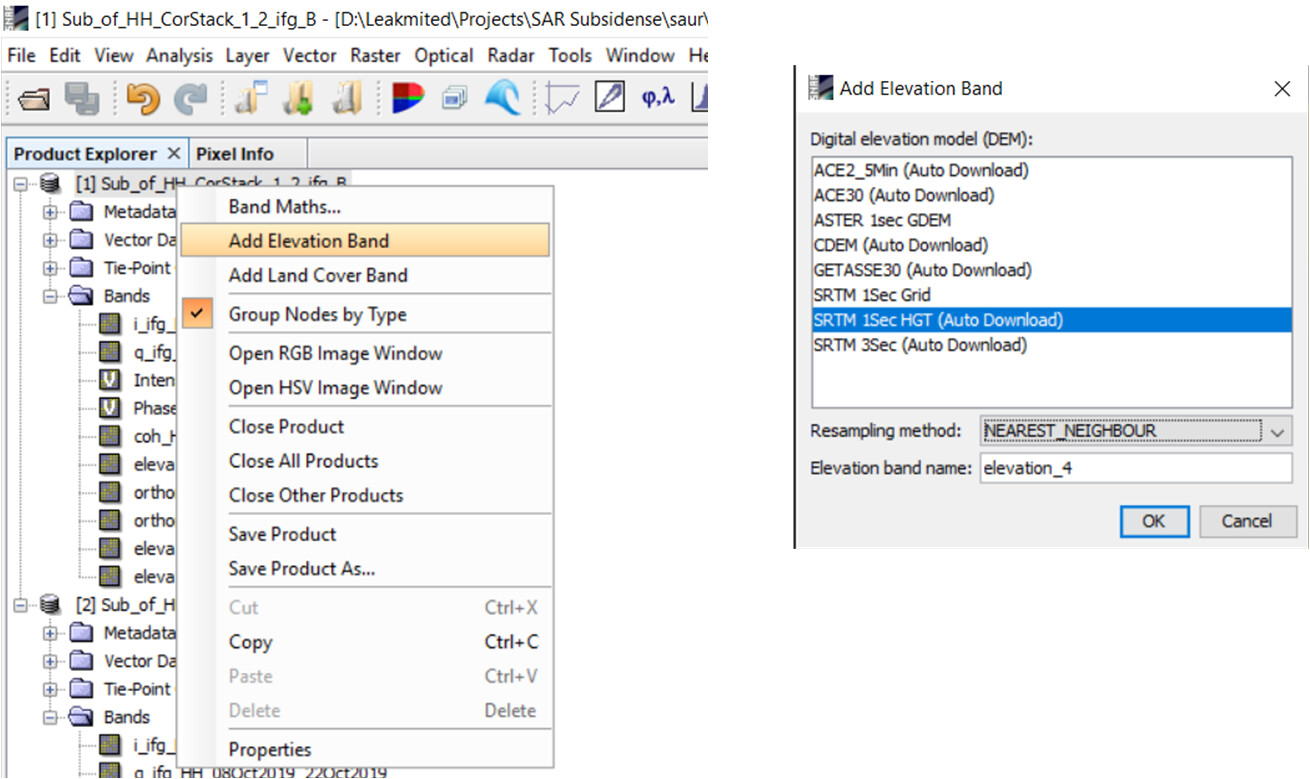
-Again default values (DEFO & MCF) - Unwrapped Phase to displacement:
-The end results seem non physical in the sense that I get a displacement map that linearly increments displacement along the image (from lets say 0.5m to 3m)
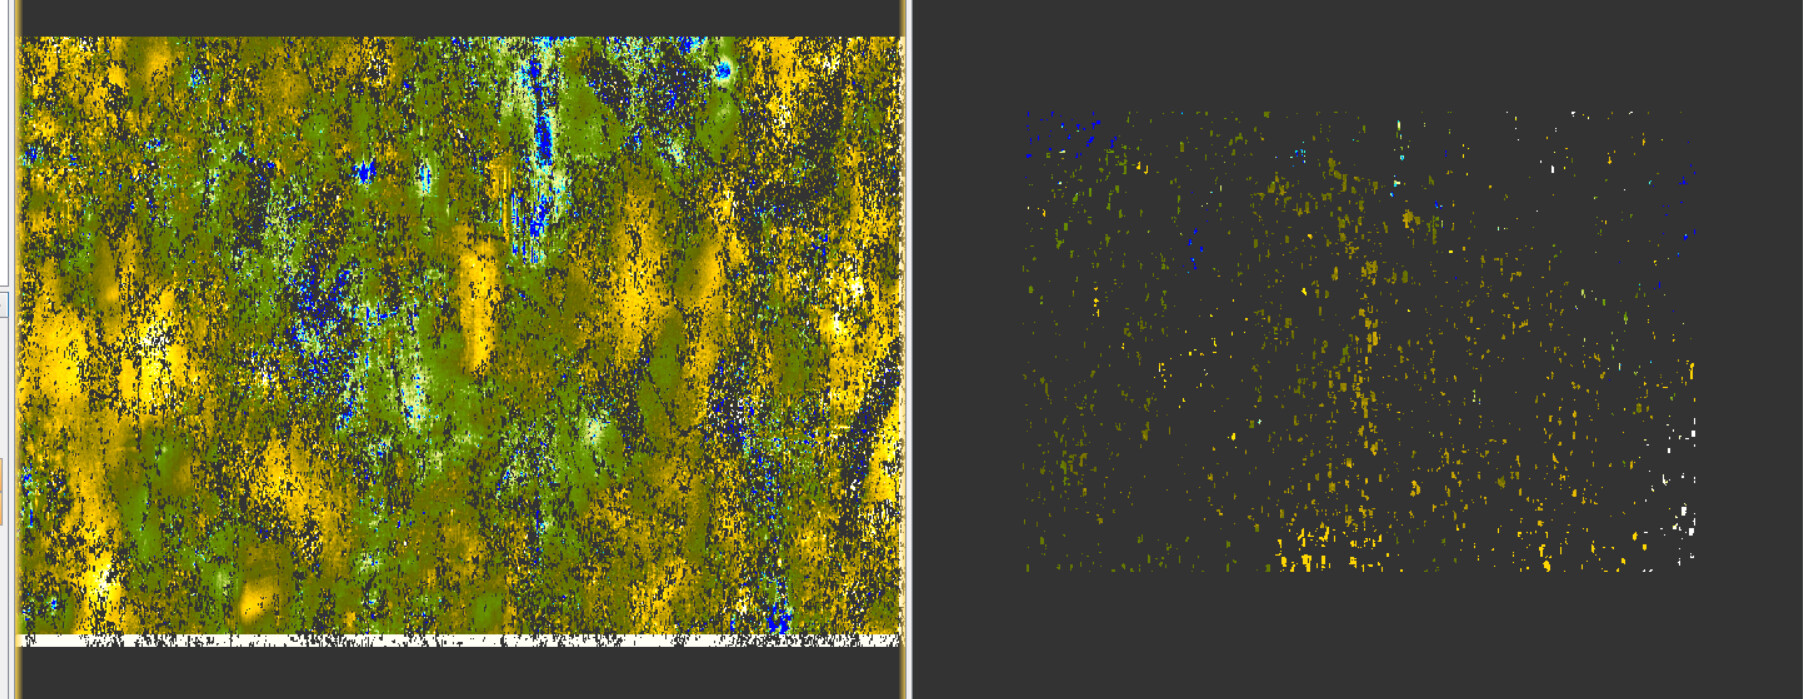
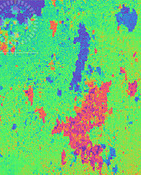
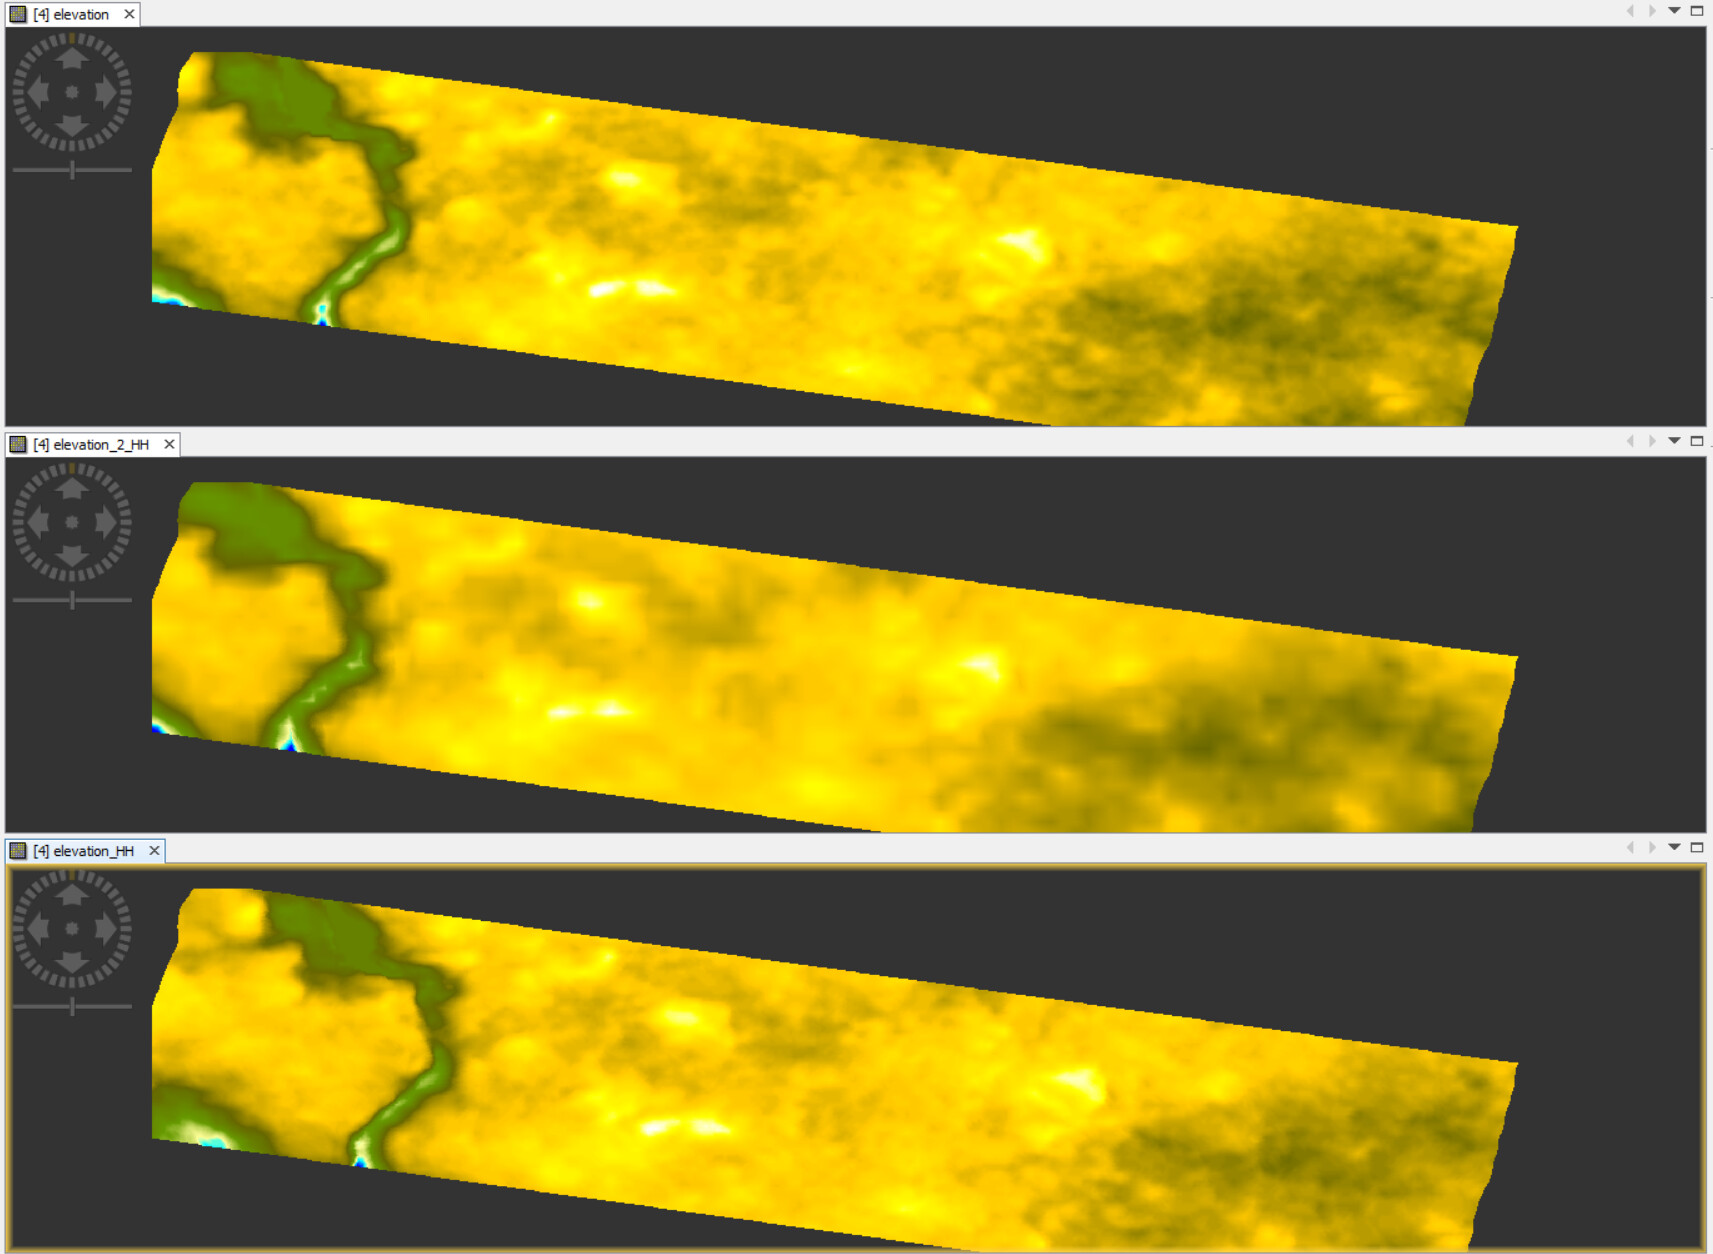
Here follows a small snip-shot of the first flattened interferogram
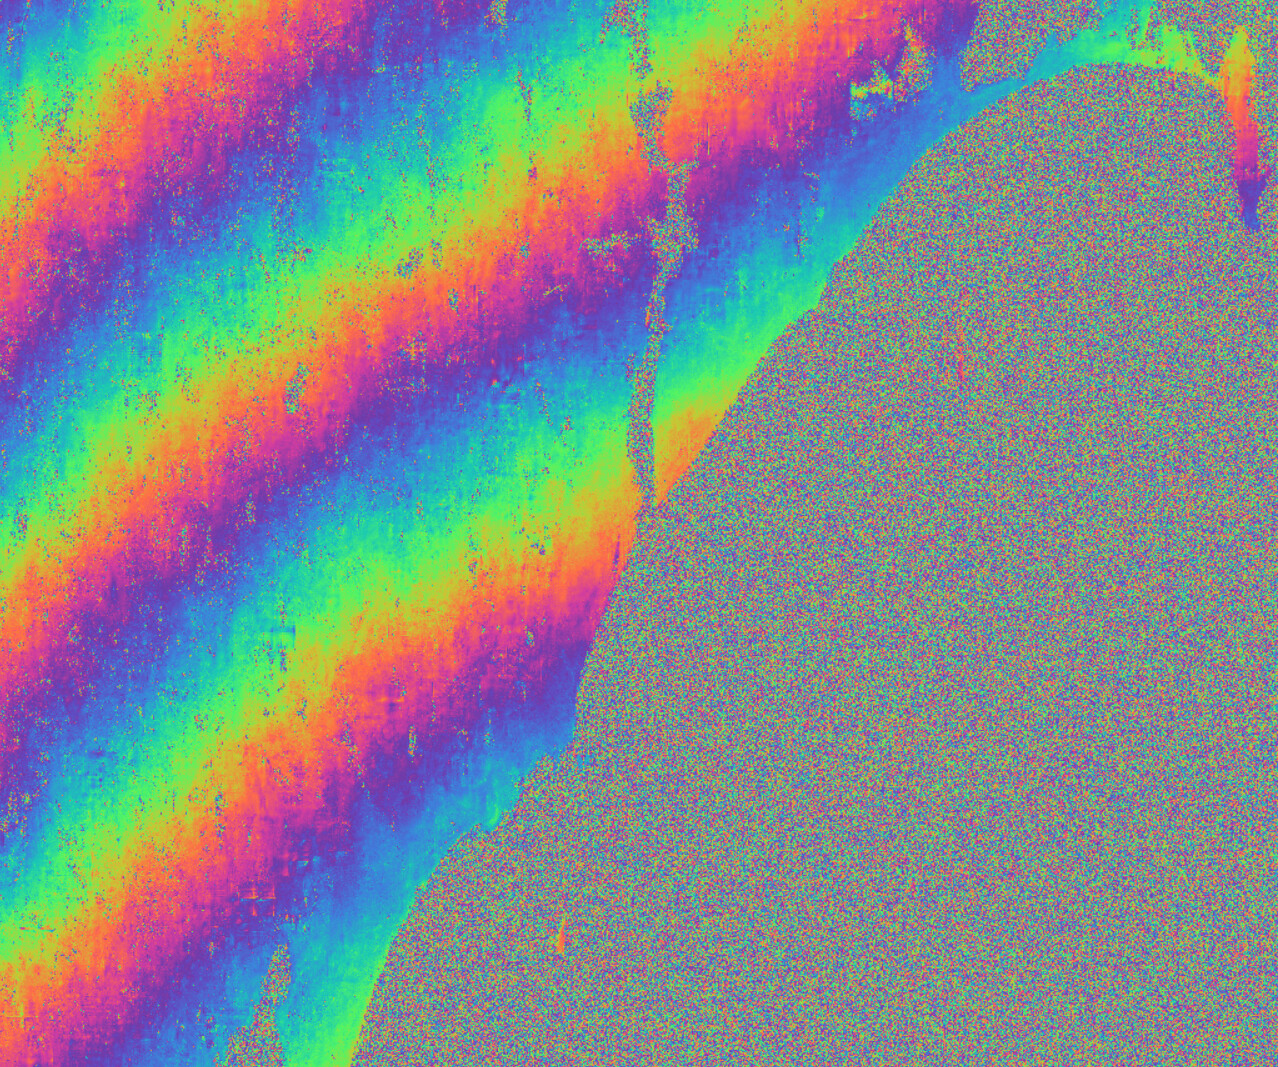
The bottom right area corresponds to sea, so I would expect such phase behavior.
The top left area is the actual land and the fridges appear as such, and I have no idea if they seem “good” or not. This behavior of the fringes on the land area is general to the whole scene. As you can imagine the following steps follow this “origin” behavior.
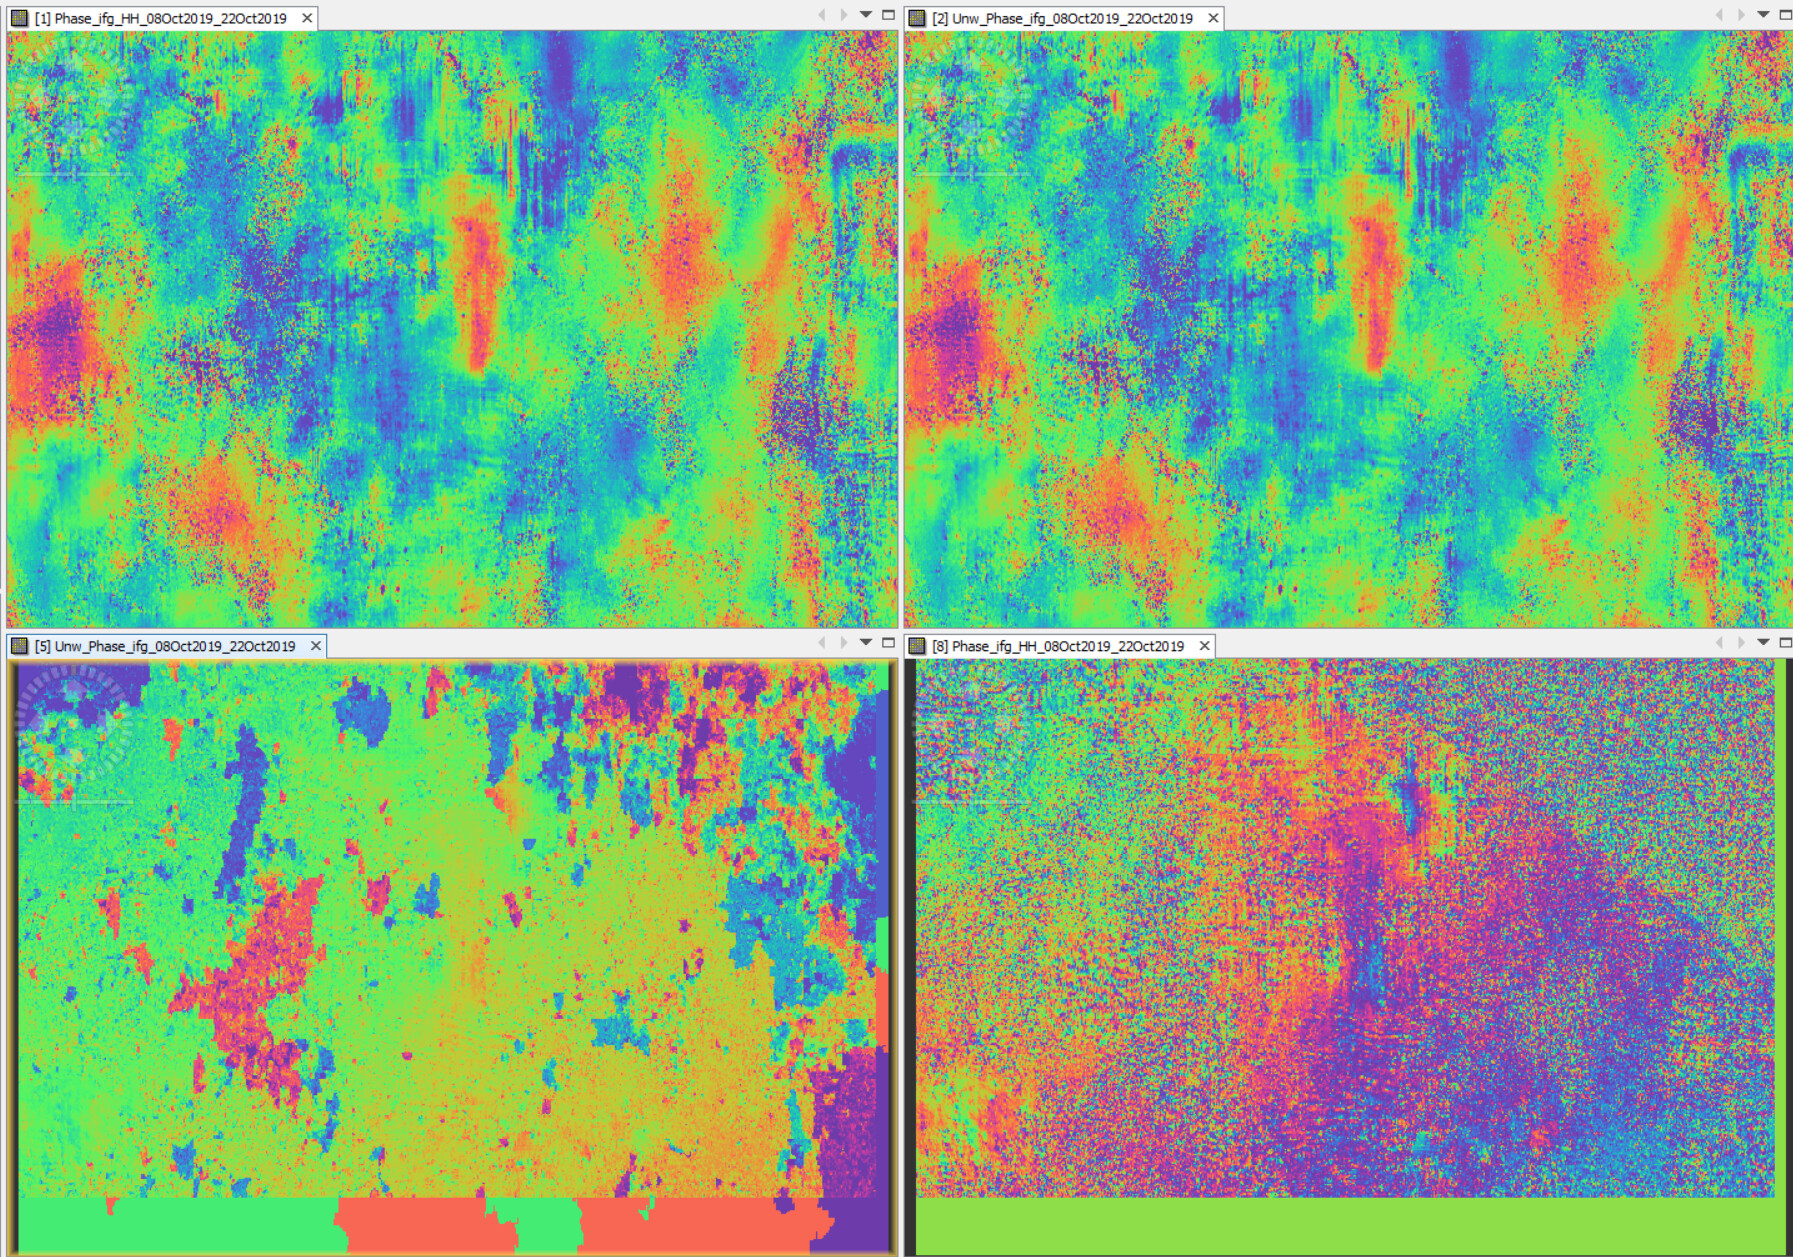
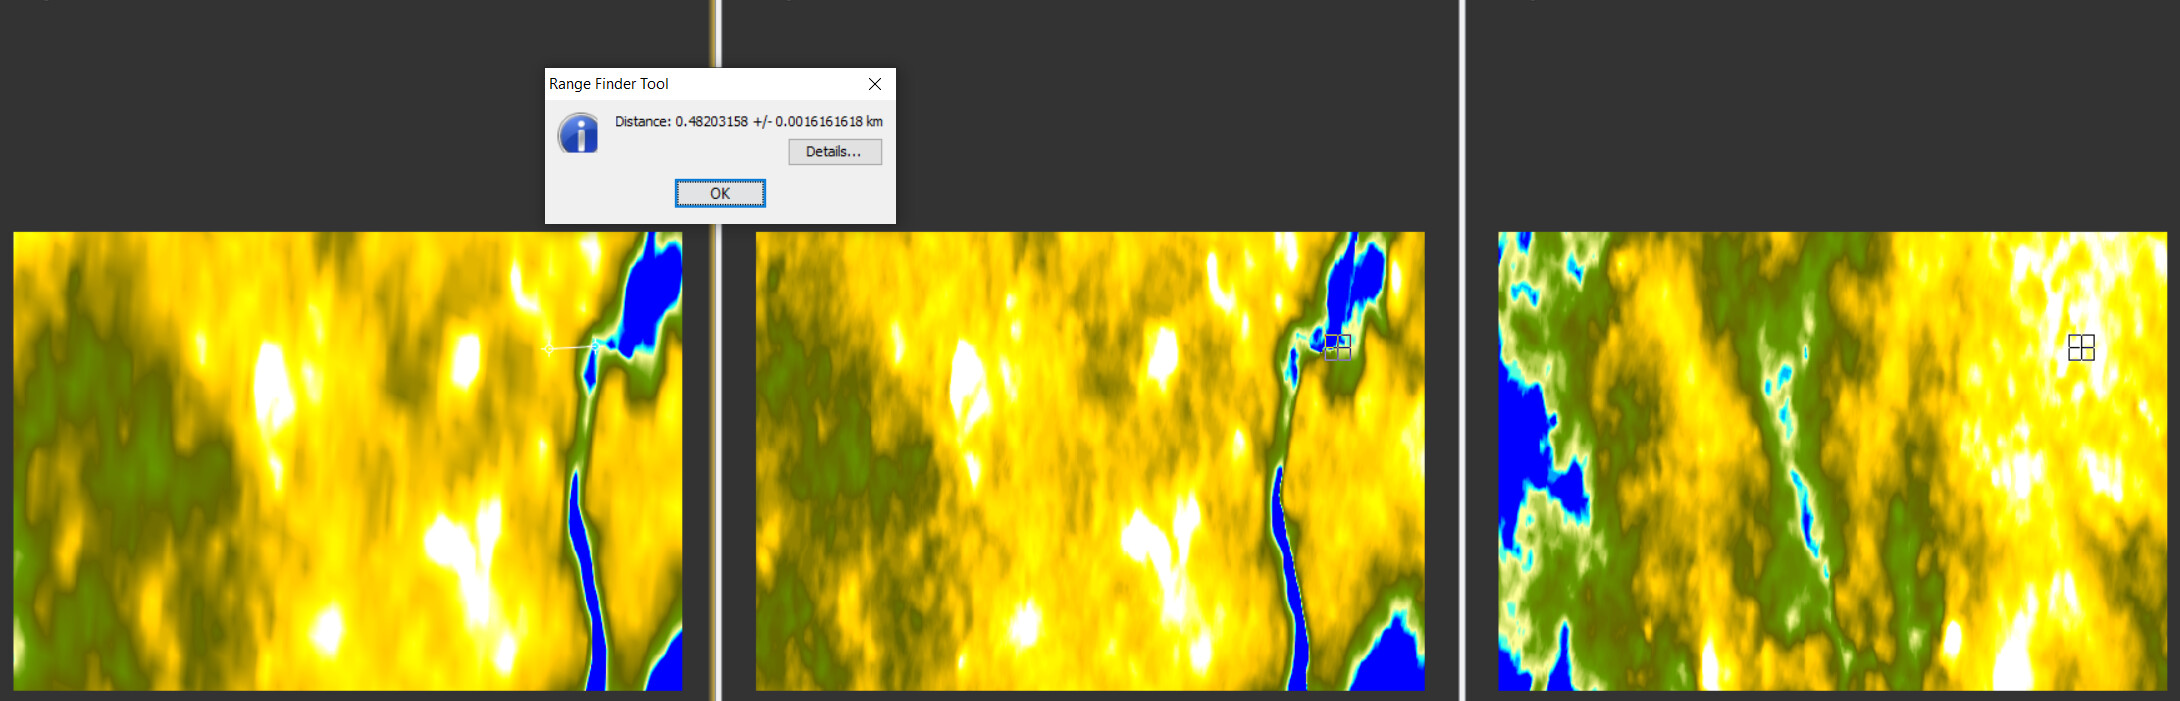
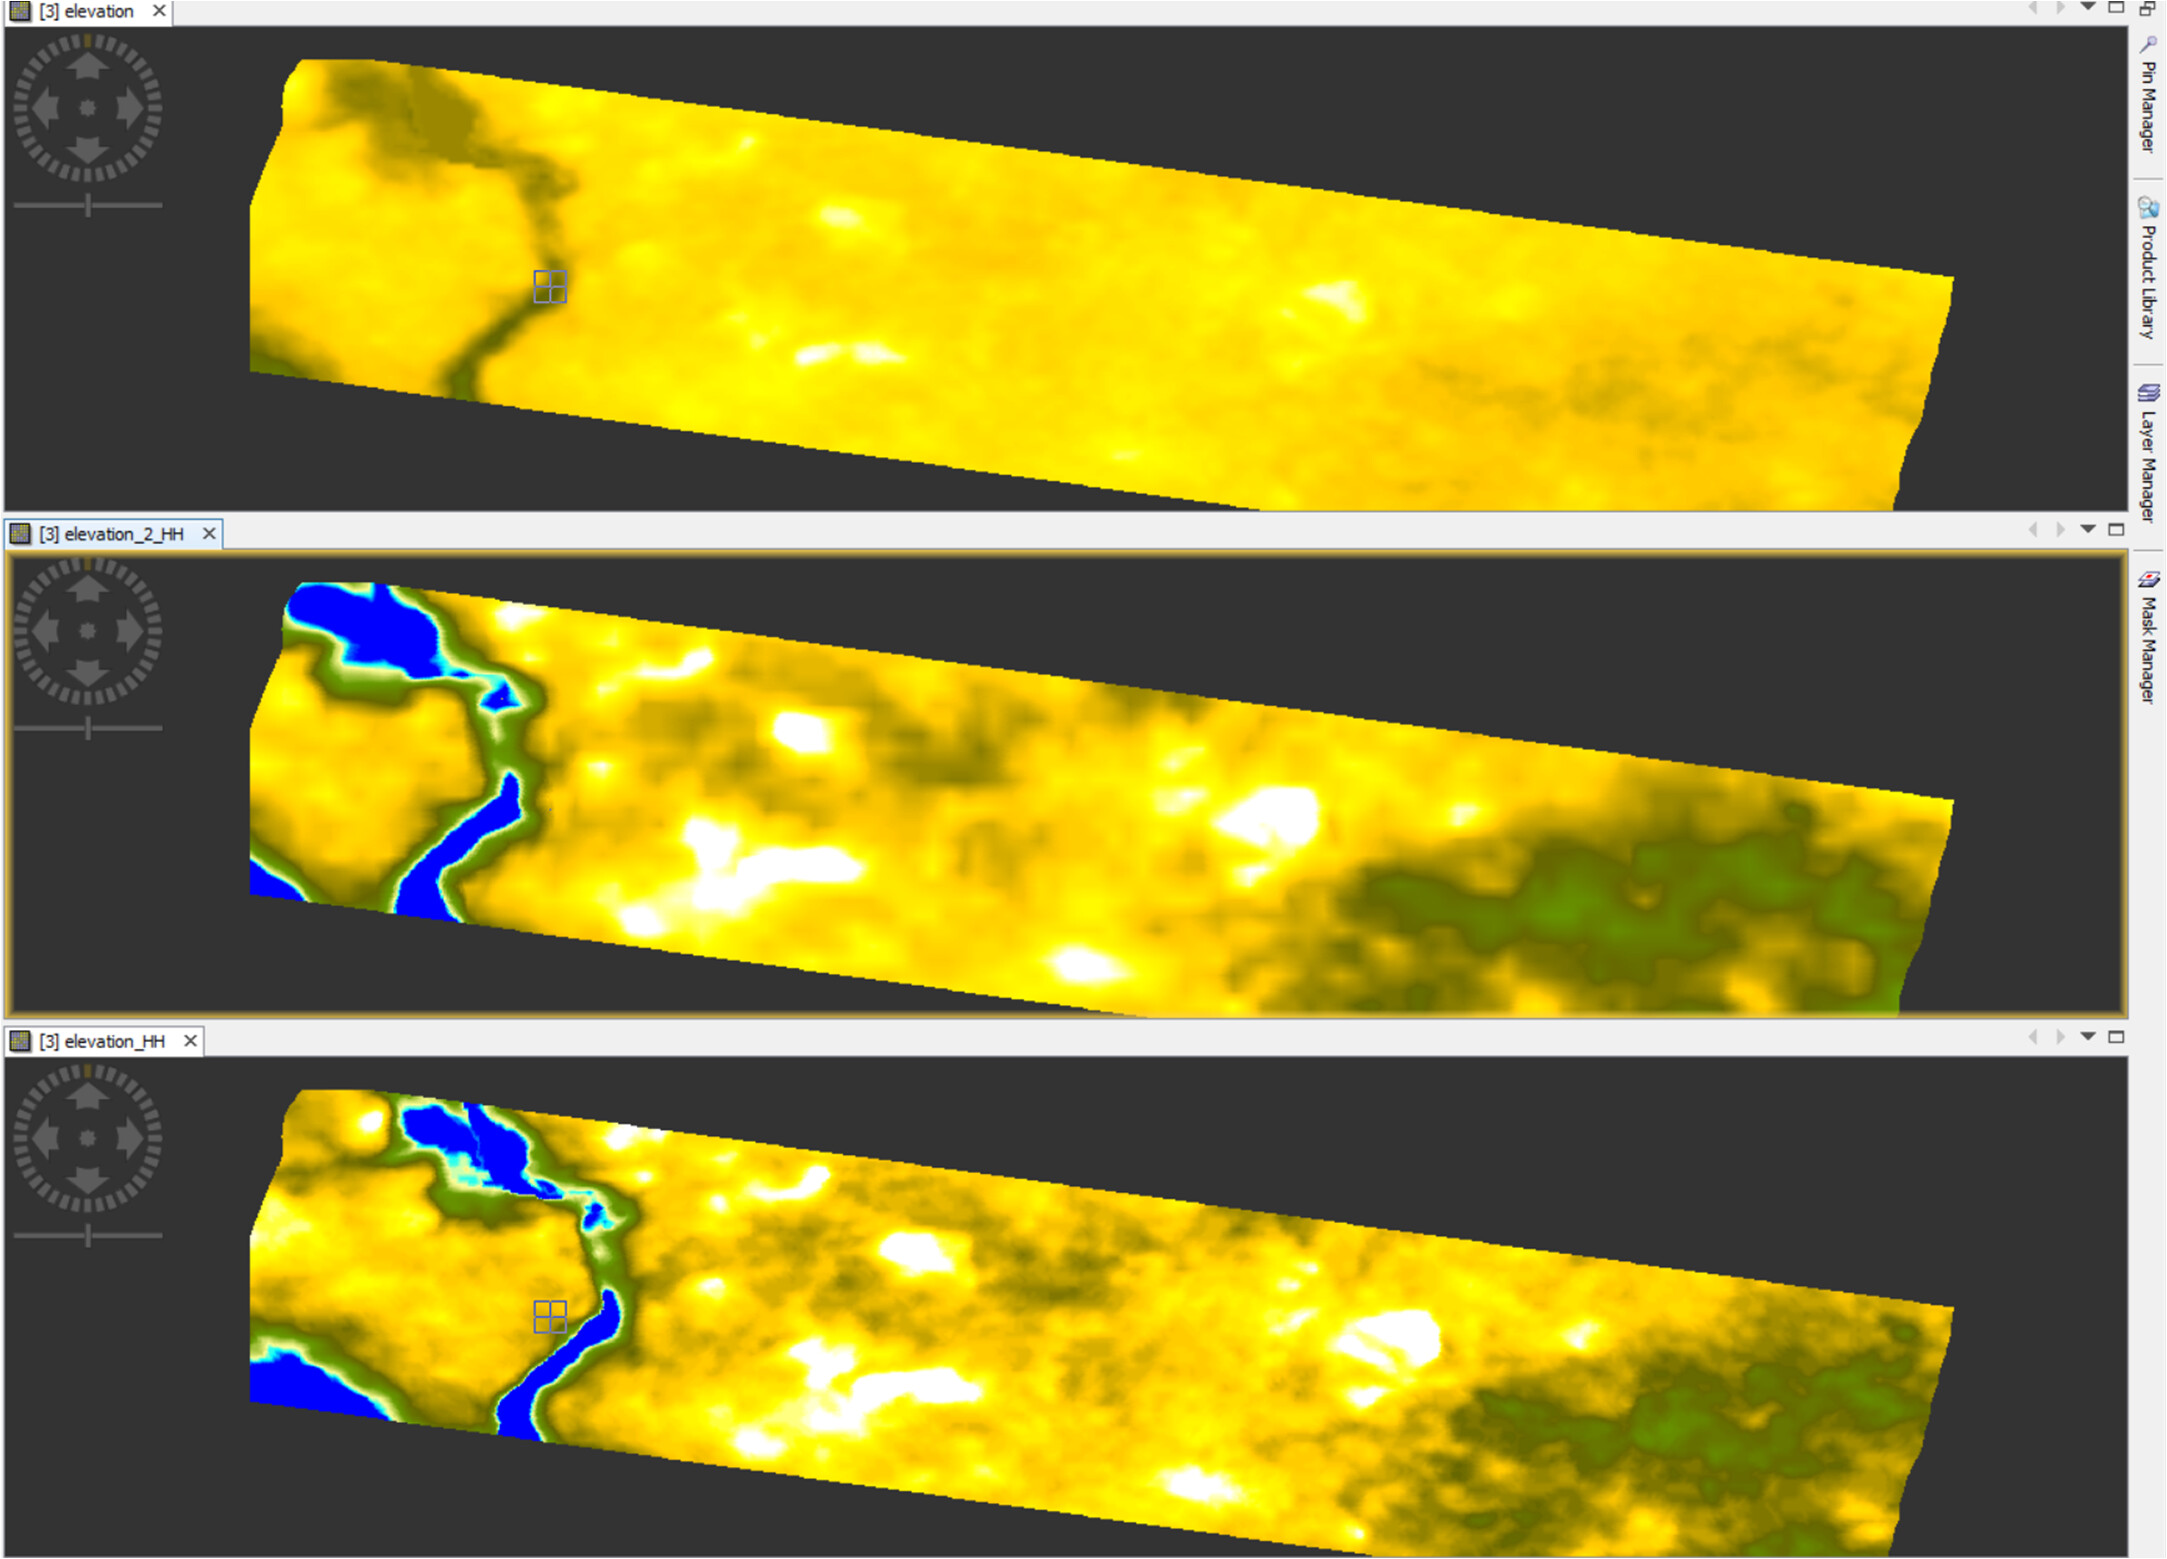
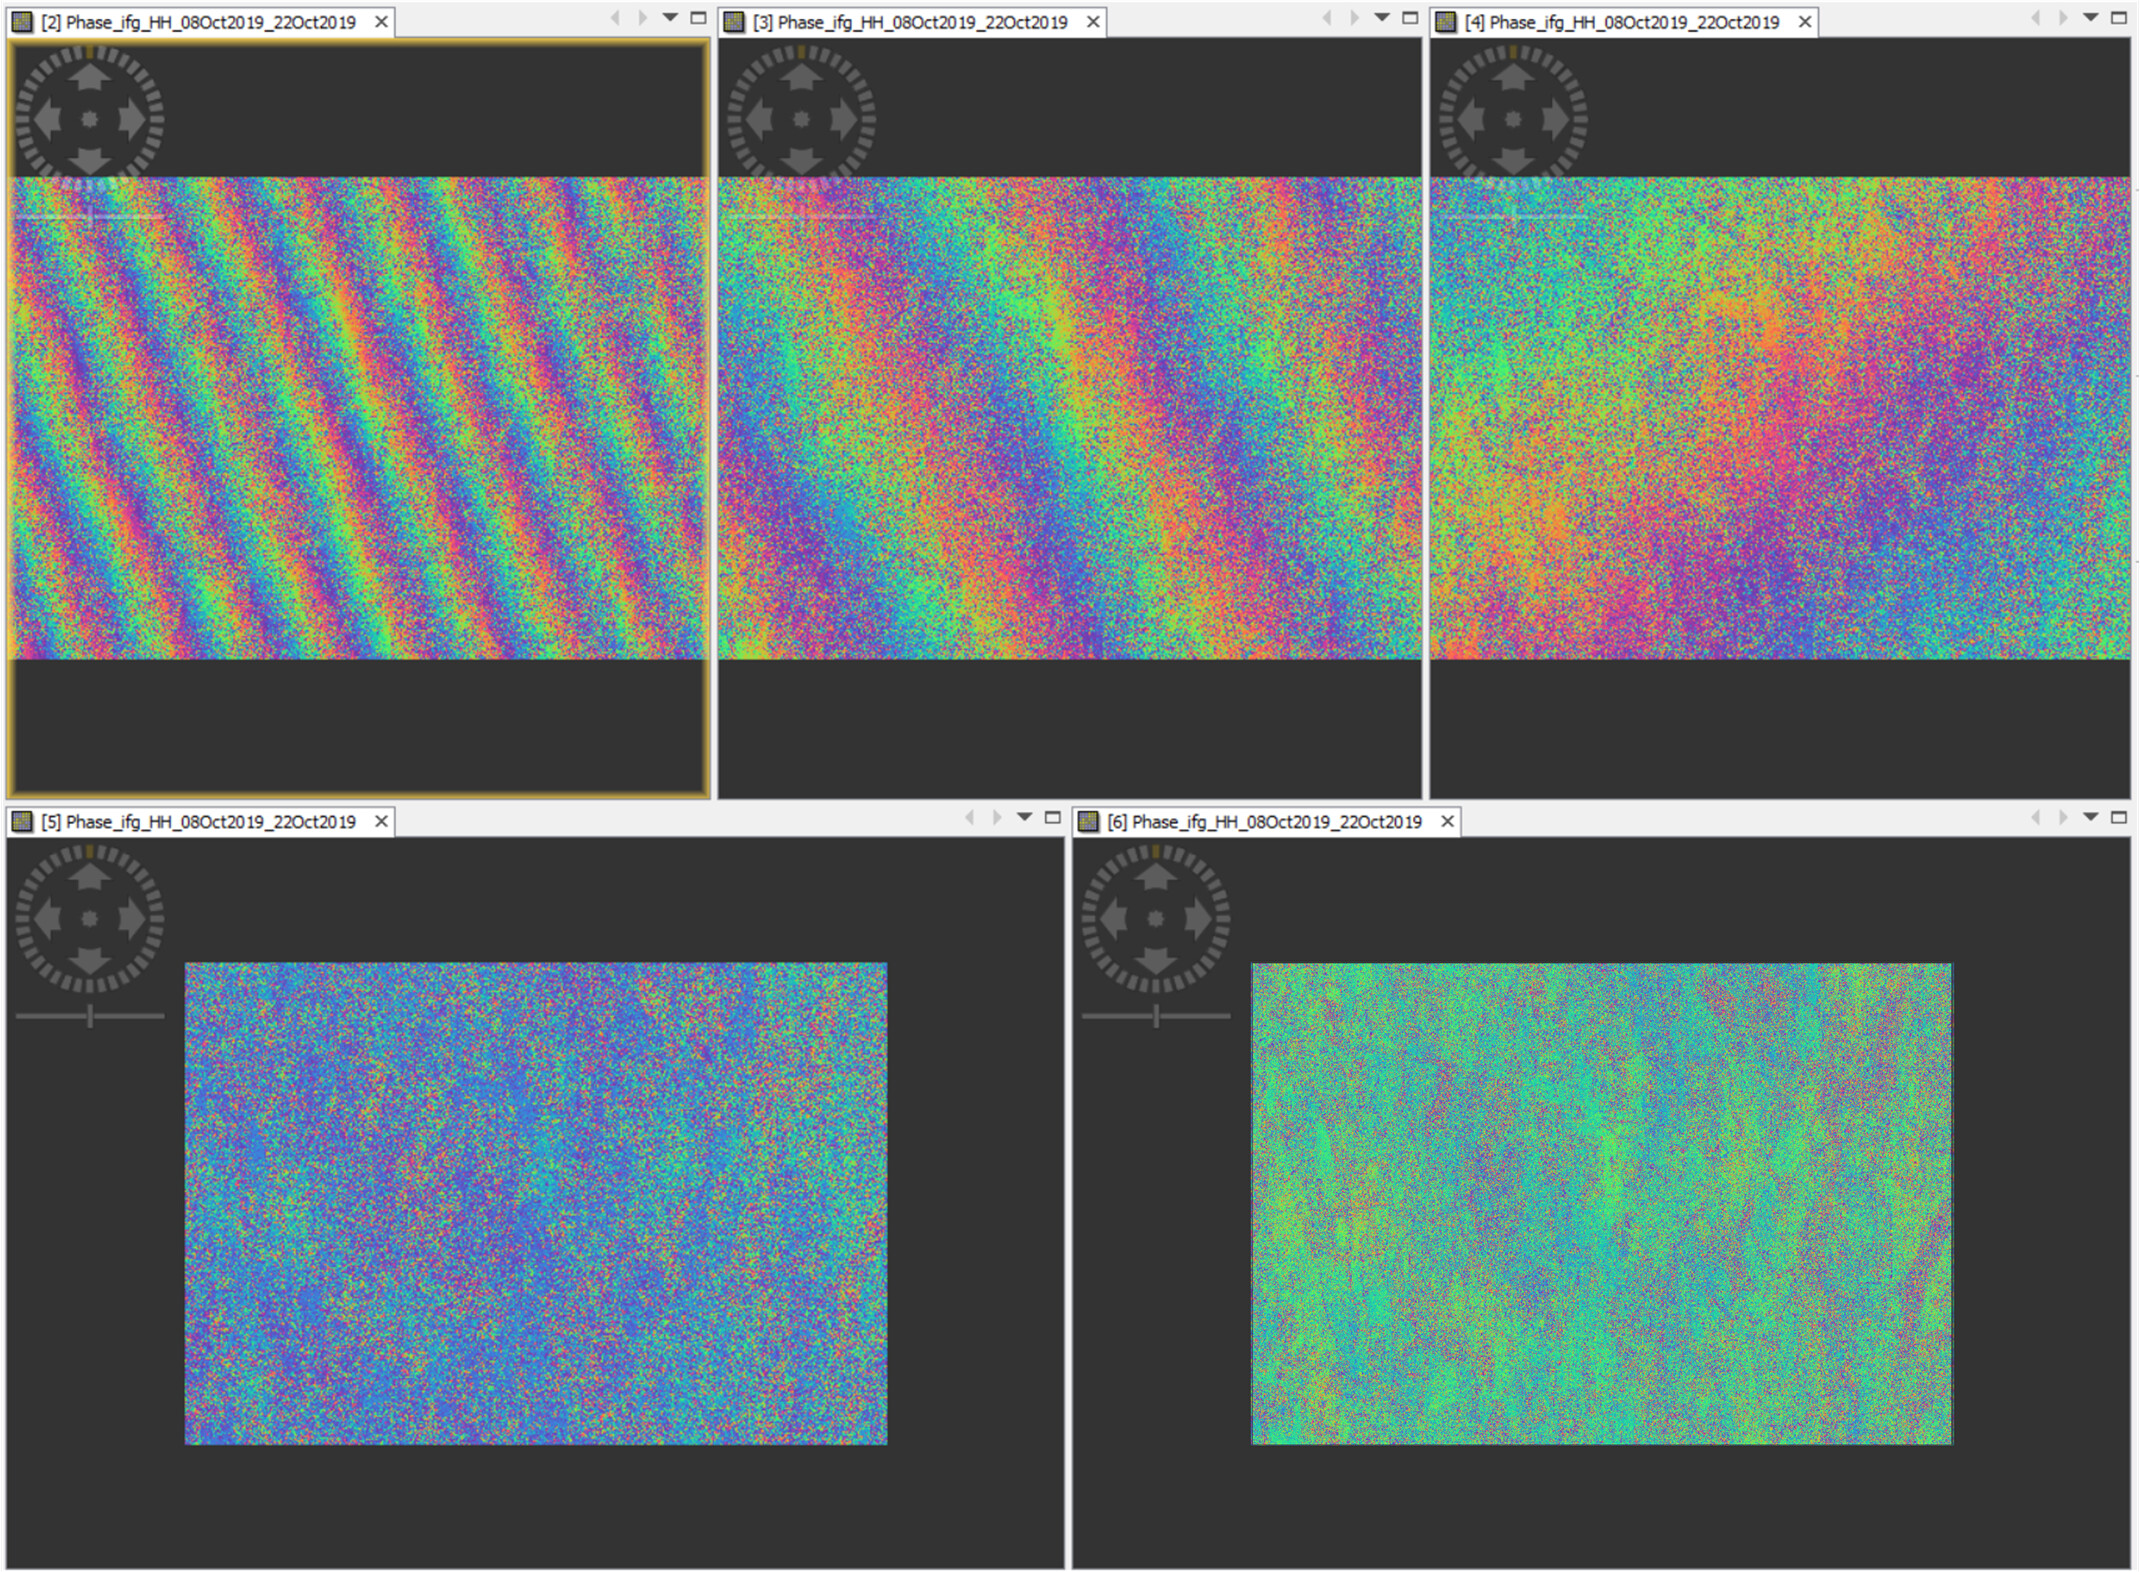
Bellow I present 4 images of the full process on a small land subset:
with InSAR Stack Overview:
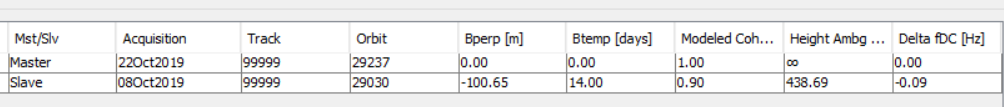
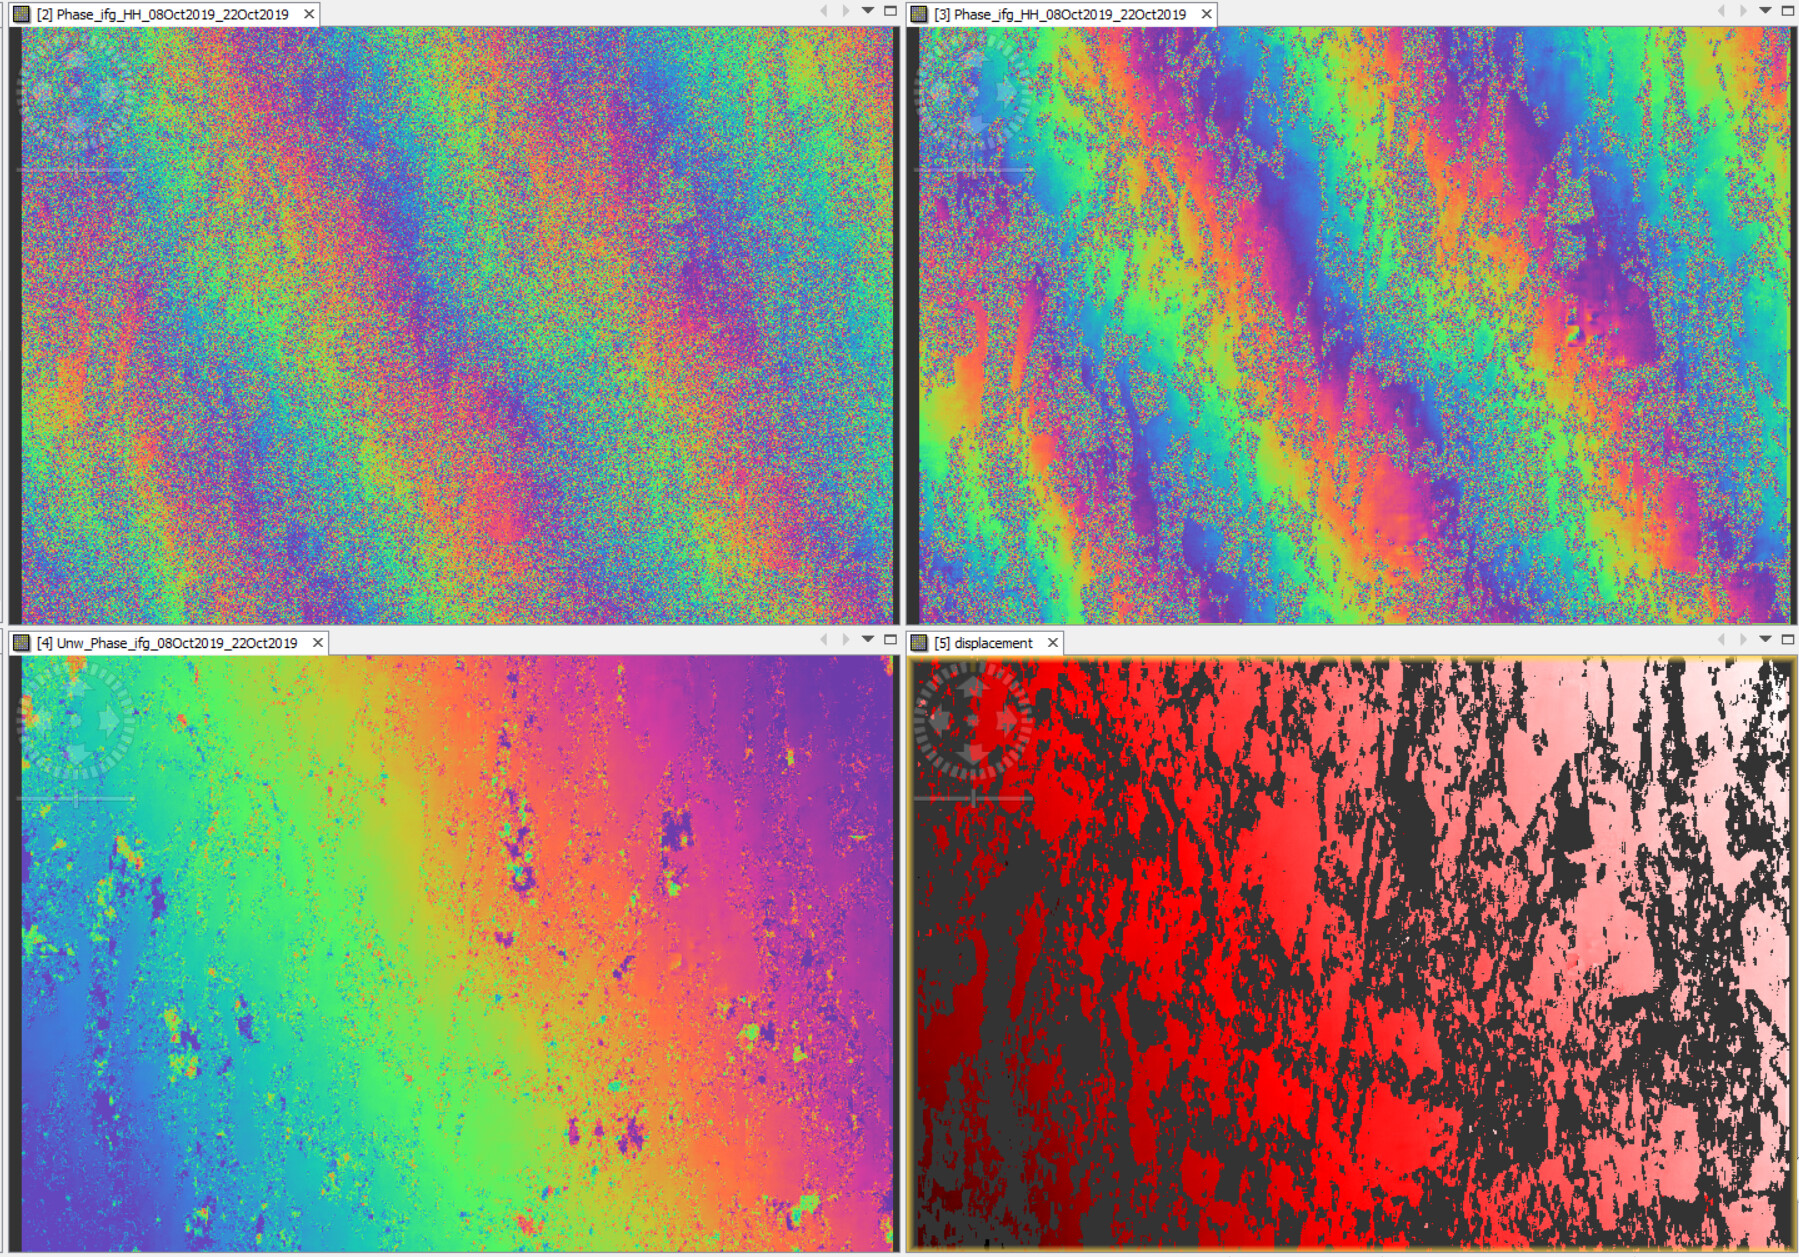
Top-left: Initial flattened interferogram
Top-tight: After the application of the G/S filter
Bottom-left: Unwrapped interferogram
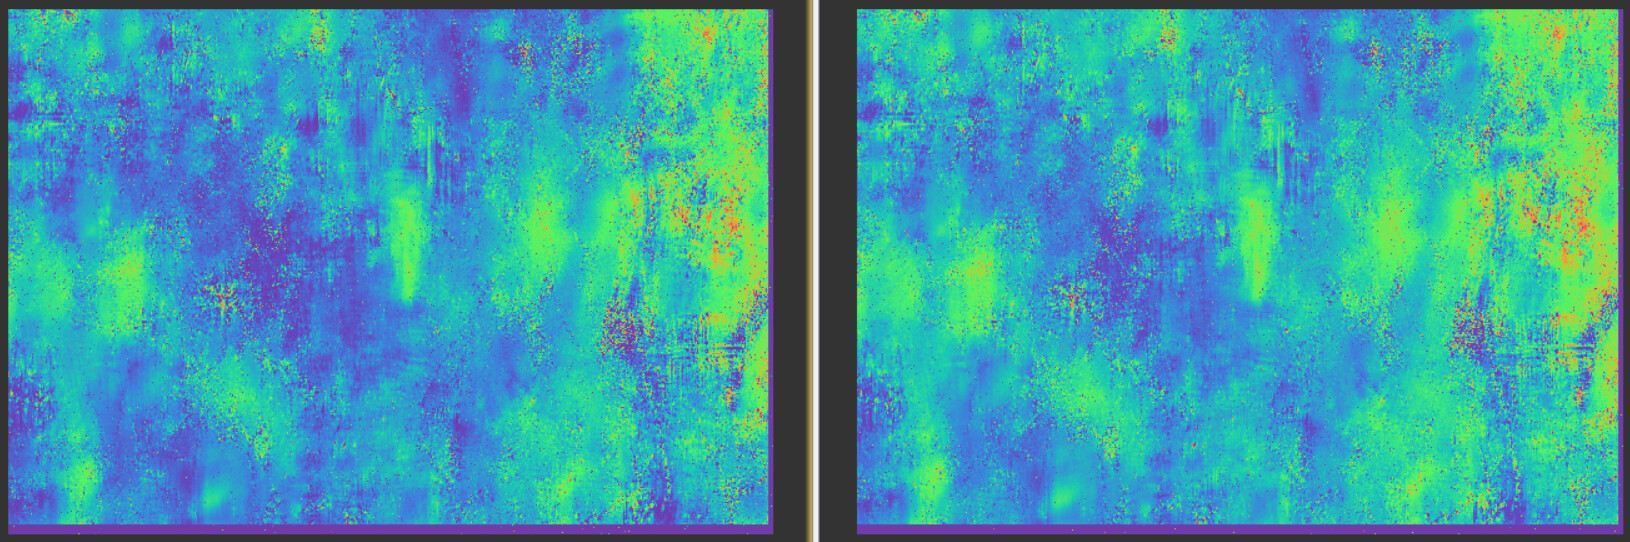
Bottom-right: displacement map (coh>0.5)
I have displayed the displacement map in gradient color red to show that the displacement itself follows a gradient like behavior (displacement [-0.18m, 0.26m]) from one edge of the image to the other. It is not assured that in that particular patch I expect to find some subsidence, but still I do not knot how to assess these results.
Any inputs would be much appreciated!
Thank you all in advance