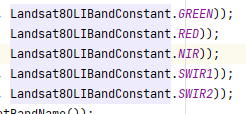
In the Help of SNAP 8.0, for Landsat 8, it is written that bands used as inputs are the blue, red, near_infrared, swir_1 and swir_2 in addition to the auxiliary bands (zenith and azimuth both for sun and view).
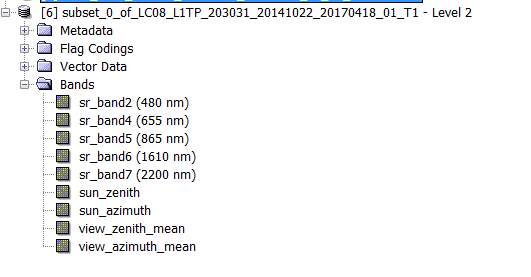
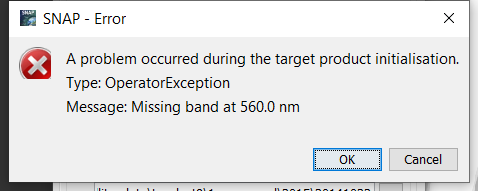
In this case, band 2 is supposed to be used. However, if I create a subset including band 2 instead of band 3 and run the Biophysical Processor, I would get an error for missing band at 560.0nm.
For Landsat 8, the wavelength of Green band (band 3) is 560.0nm. It is contradictory to what is written in the Help. I am confused about this. Could someone help me?
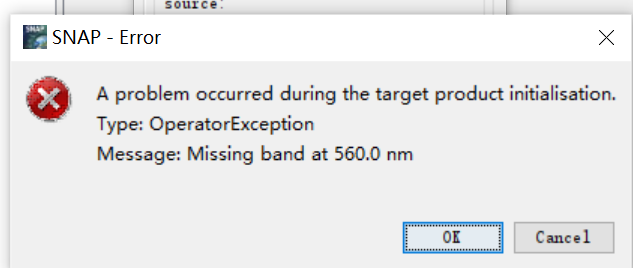
Hello, I used the Graph Builder to gain these bands from Landsat8 collection 2 level 1. But the error appeared too.
I was puzzled about it. Could someone help me?
I guess the problem is that you were using Landsat 8 Collection 2 data which is not currently supported by SNAP. In this case, metadata (for example, 560nm) cannot be loaded to the bands when you import them. I guess Biophysical Processor needs this information for recognizing specific bands.
I followed the steps below when using Landsat 8 images. Hope it will help you.
Steps:
Download Landsat 8 Collection 1 Level 2 products. As the neural network was trained by the top of canopy reflectance, I guess we need BOA (bottom of the atmosphere) reflectance information.
Import the Landsat 8 Collection 1 Level 2 products into SNAP. (Be sure to import them using the XML file in the download product bundle)
Import the view angle files.
Apply Band Math to add view angle files as bands to the Landsat 8 Collection 1 Level 2 products. (Be aware that new band names should be: sun_zenith, sun_azimuth, view_zenith_mean, view_azimuth_mean)
Subset the bands to your study area or directly run the Biophysical Processor.
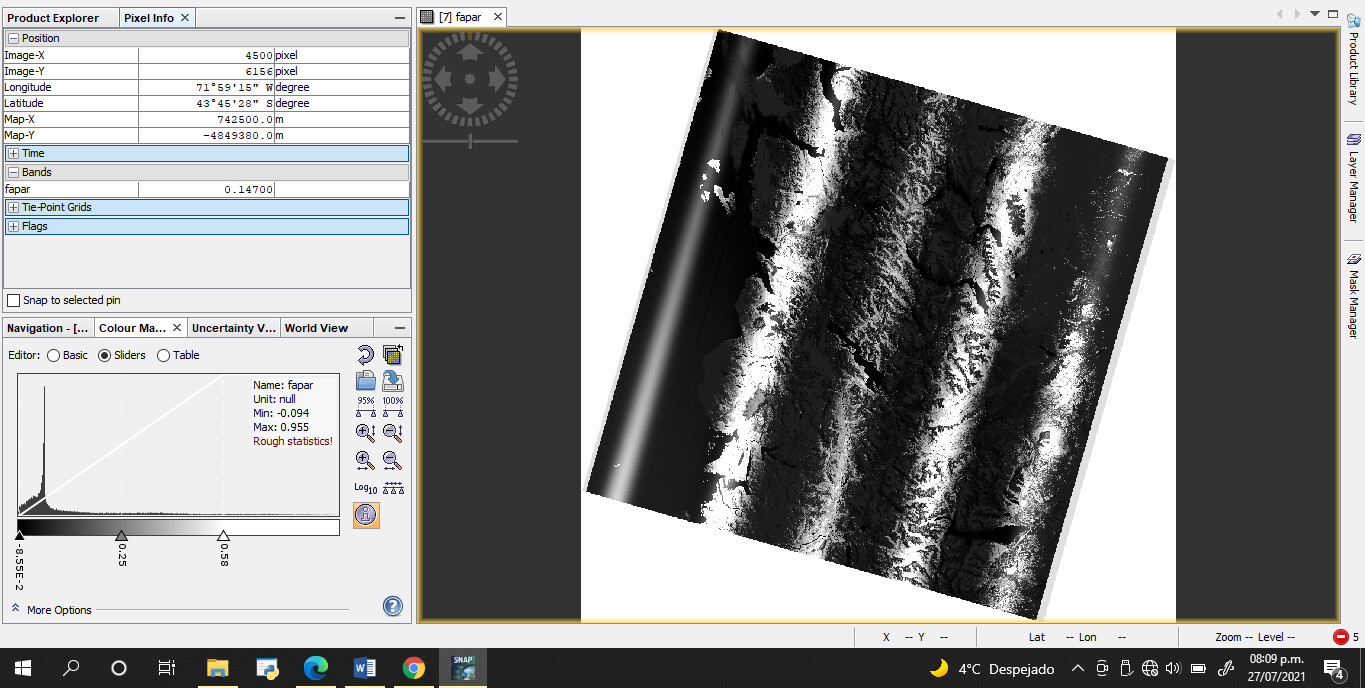
Hi, I tried to obtain the fapar from a Landsat 8 image, following the insructions of Shixian, the result is not good, as it can be seen in the capture. I wonder if the reason for that strip effect shall be for the units or any another.