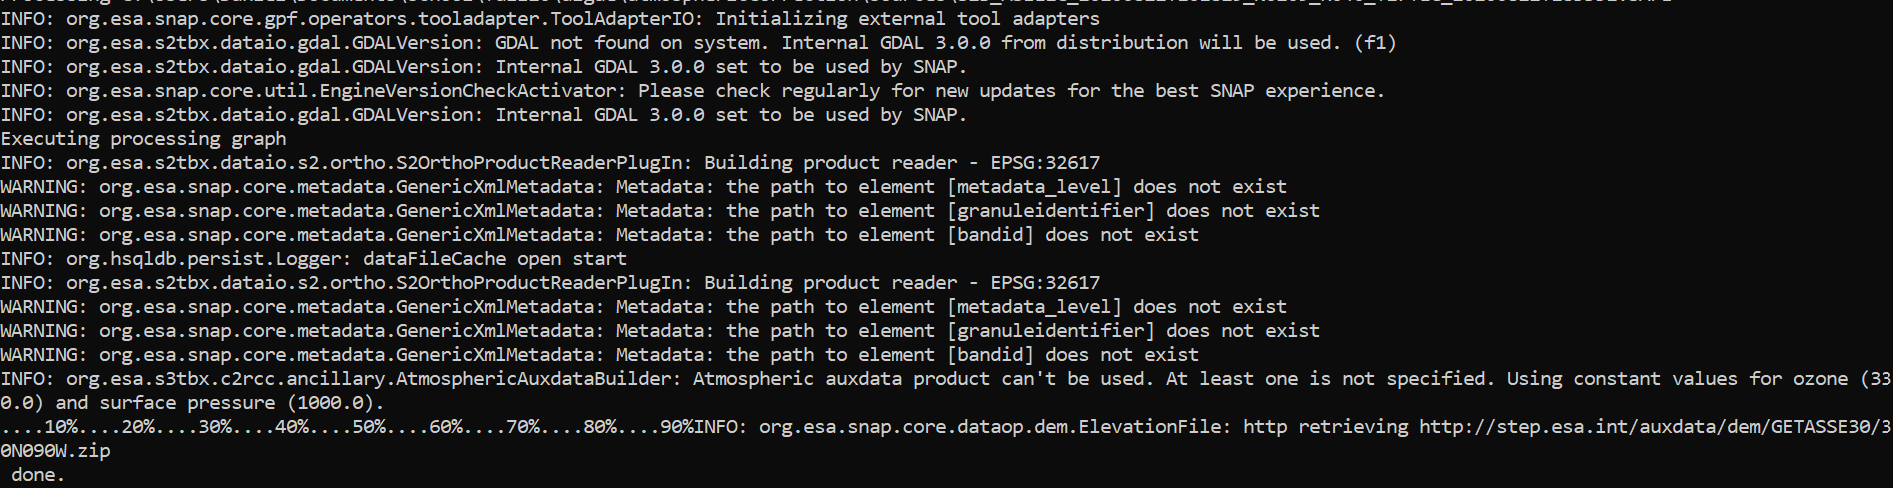
I am trying to use C2RCC to perform atmospheric correction on a subregion of a single Sentinel 2 L1C product. The subregion is over freshwater. I am doing it with GPT Bulk Processing as I will eventually need to perform atmospheric correction on many products. Attached are my graph xml file and my processData.bat files. My properties file is empty because values I need are hardcoded. To install the C2RCC plugin I followed the steps found on this GitHub page.
The call I make to do the processing is as follows:
processDataset.bat resample-subset-c2rcc.xml ac.properties .\sources .\targets s3tbx_resampled_subset_ac
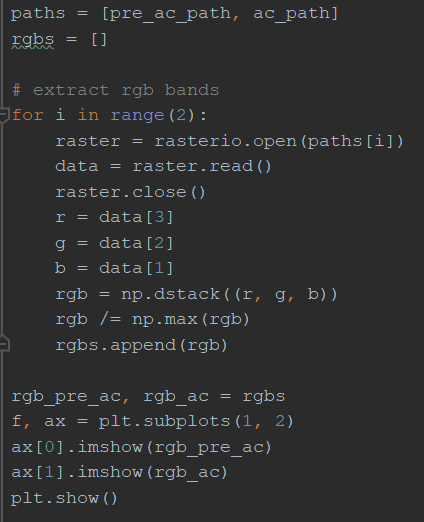
I also tried inspecting the Rrs bands by opening the tif file in python, but I couldn’t pinpoint the Rrs bands. However I found that most bands have pixel magnitudes that are very small, on the order of 10^-2 or 10^-3.
My questions are is this reasonable Rrs output for c2rcc.msi or is something wrong, and how do I know which bands are which in the tif file?
You don’t need the to install c2rcc separately. The code repository you have found belongs to an outdated version.
When you install SNAP 8 and the S3TBX, too, then you get latest version.
So, the problem you see might be caused by the old c2rcc.
Please uninstall the plugin and install the s3tbx via the plugin manager.
This might solve the issue already.
If not, I would suggest sticking to BEAM-DIMAP while processing. At least as long the processing chain is not finalised.
Also, you can investigate the c2rcc flags. It could be that they tell you why no results could be computed.
I figured out why the processed file wouldn’t display anything in SNAP, the processDataset.bat file I was using appended .dim instead of .tif to the file. Once I changed that I could view the results in SNAP. I discovered this once I changed the output to BEAM-DIMAP so thanks for the pointer. I learned I was using the s3tbx version of C2RCC after all, by the way.
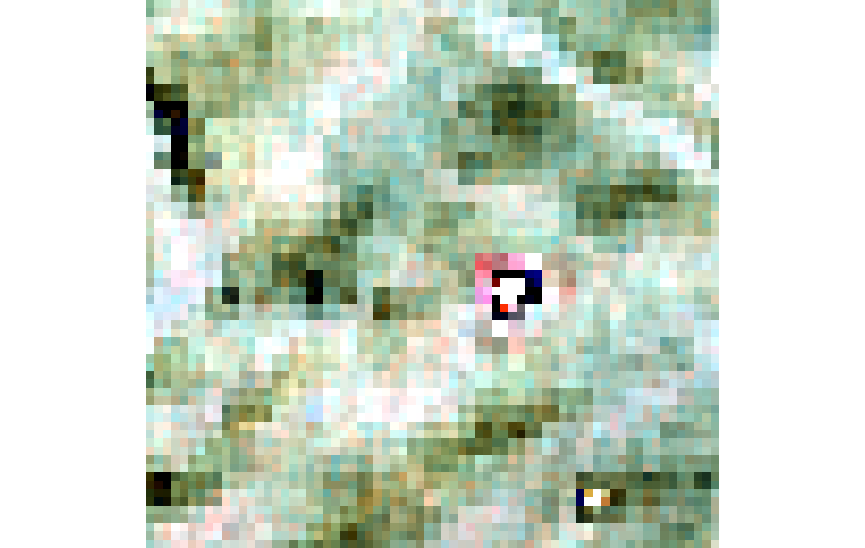
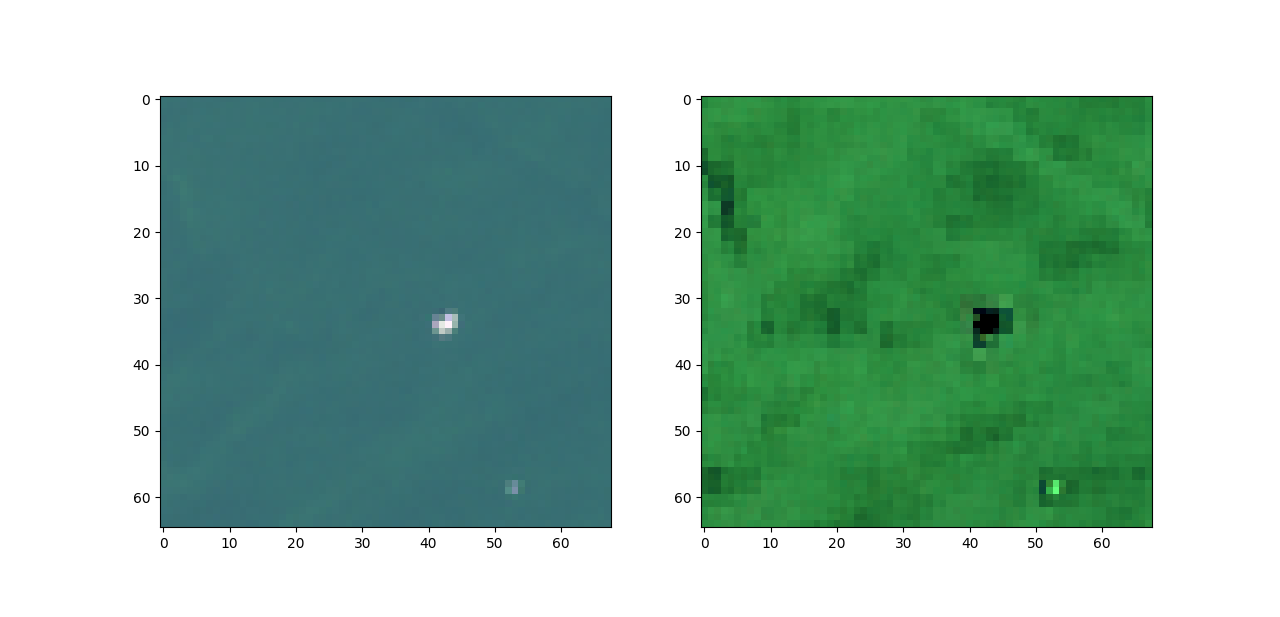
I attached images of the RGB plots in SNAP of a region before and after it was processed with C2RCC, as well as a side by side comparison of the same region I plotted in python. I am wondering:
why do the RGB snap images look so unrealistic and colorful?
how can I tell if the C2RCC processor is working as it should be?
how come the processed image looks less smooth than the unprocessed one in the python image comparison?
let me first answer question 2 and 3.
2. To validate the results, you need in-situ data to compare with. You might need to tweak the conversion factors for tsm and chl, too.
3. For MSI data it is known that the result can look a bit noisy. (SIIITBX-374)
First one is not so easy to explain. because I don’t know what you mean by unrealistic and what you expectation is.
But I assume the resulting images are not colored as you expect, because of the way SNAP is doing this.
The resulting colors depend on the minimium and the maximum values in the image. 2.5% at the upper and lower end of the histogram are clipped, to eliminate outlier.
But if you have many e.g. bright pixels in the image, then the results might not be as expected.
To overcome this you can clip the value range in the RGB expressions.
In this post I explained it and provided an example rgb profile.
You need to adapt the band names and the limits for your case.
To validate the results, I believe you are suggesting comparing output chl-a/tsm to in-situ chl and/or tsm data? I just want to validate the atmospheric correction, not the inversion of the water leaving reflectance spectrum into IOPs. However I don’t have in-situ reflectance data. So does validating output chl/tsm with in-situ chl/tsm say anything about the water leaving reflectance spectrum’s accuracy?
I am also wondering, would the same patch of water produce the same output whether the input was that patch of water by itself or the entire S2 tile containing that patch of water?
I can’t really say something to your first question. But I guess having a good accuracy for chl/tsm would also mean that the AC worked well.
Maybe @abruescas can say more to this?
To the second question I can say yes. The algorithm is pixel based and does not consider surrounding pixels.
It is not an easy question, I guess it depends on the CHL algorithm because some of them only use a limited set of bands (i.e OC4ME), so it is a bit risky to base the accuracy of the Rhow (or Rrs) on the concentration results.You could maybe use some external references. The Sentinel 3 Validation Team may have some presentations on Rhow validation for different optical water types. A search on some published papers could also be helpful.
It isn’t clear how tyour 3 bands were created. In the SNAP help, a search for “RGB-Image Profile” will show weights applied to each band and then log( 1 + (weighted sum of band values). When creating images, you may need to select flags to be masked and also define some “valid range” to delete or trim extreme values.
