Classified image frequencies

Dear All…

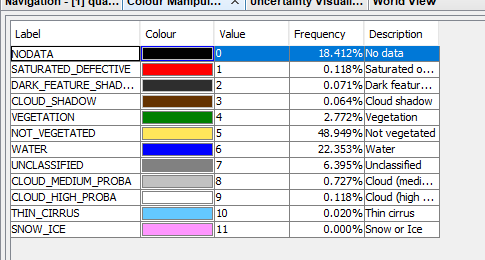
I have classified a sentinel 2 image with the help of Random forest classifier, got the distribution in labeled classes in frequencies…my question is, those frequencies are also representing the area of the particular class …?

Thanks in Advance

the frequency is the relative occurrence in percent. You can get the actual area using the mask manager as described here: Calculating water area

Dear Sir,

I want to find out the maize area with mask manager, but iam not getting…please find the below attachments.

maize area 1

as all sizes are given in square kilometers, your maize area is probably too small to be displayed in this.

But if you are working with Sentinel-2, each pixel is 10x10 meters = 100 square meters. 62 pixels are then 62,000 square meters or 6.2 hectares.

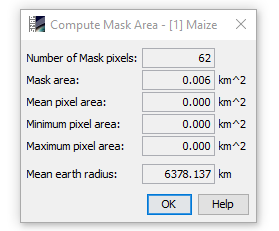
Sir, this particular raster(District) actual area is 3229 square kilometers…but classified image showing very less area as below 100 square kilometers. i think i need to do again ??

Sir… Actually that data (maize area 6.5 Hectares) is belongs training samples, but i am getting difficulty to found the mask area from the classified Labeled classes.

Thanks in Advance

Oh, now I see…

The output of the classification is one thing - if this underestimates a particular class, you have to adjust your trining samples or select a different classifier.

If, however, the area computation is wrong, it is maybe better to reproject the classification to UTM using nearest neightbor resampling.

Can someone here help me out to - calculate classified classes’ area in ESA’S SNAP.
One way I know is to mask out pixels through Mask manager. But in this case, I have a classified image with few classes and I need an area of each one. Is there a way in a snap or should I go for alternative software?

TIA

The only solution I’m currently aware of is to create a mask for each class and repeat the calculation of its area each time.

You have probably seen this one: Landcover classification with Sentinel-1 GRD

Maybe creating a histogram with the correct min/max and number of bins also gives you the pixel numbers per class to export in a tabular format.

1 Like

What might help you is the statistics operator. Unforunately it is not well documented. Best source is this thread:
A StatisticsOp graph - GPF Graphs - STEP Forum (esa.int)
Also some can be found in the snap help:

Also if the classification result is done properly, the classification band is assigned an index coding.
If so, you can see the frequencies here:
image

2 Likes

Thanks, @marpet & @ABraun!!

I haven’t looked at these options.
I’ll attempt these and get back.