Dear collegues,
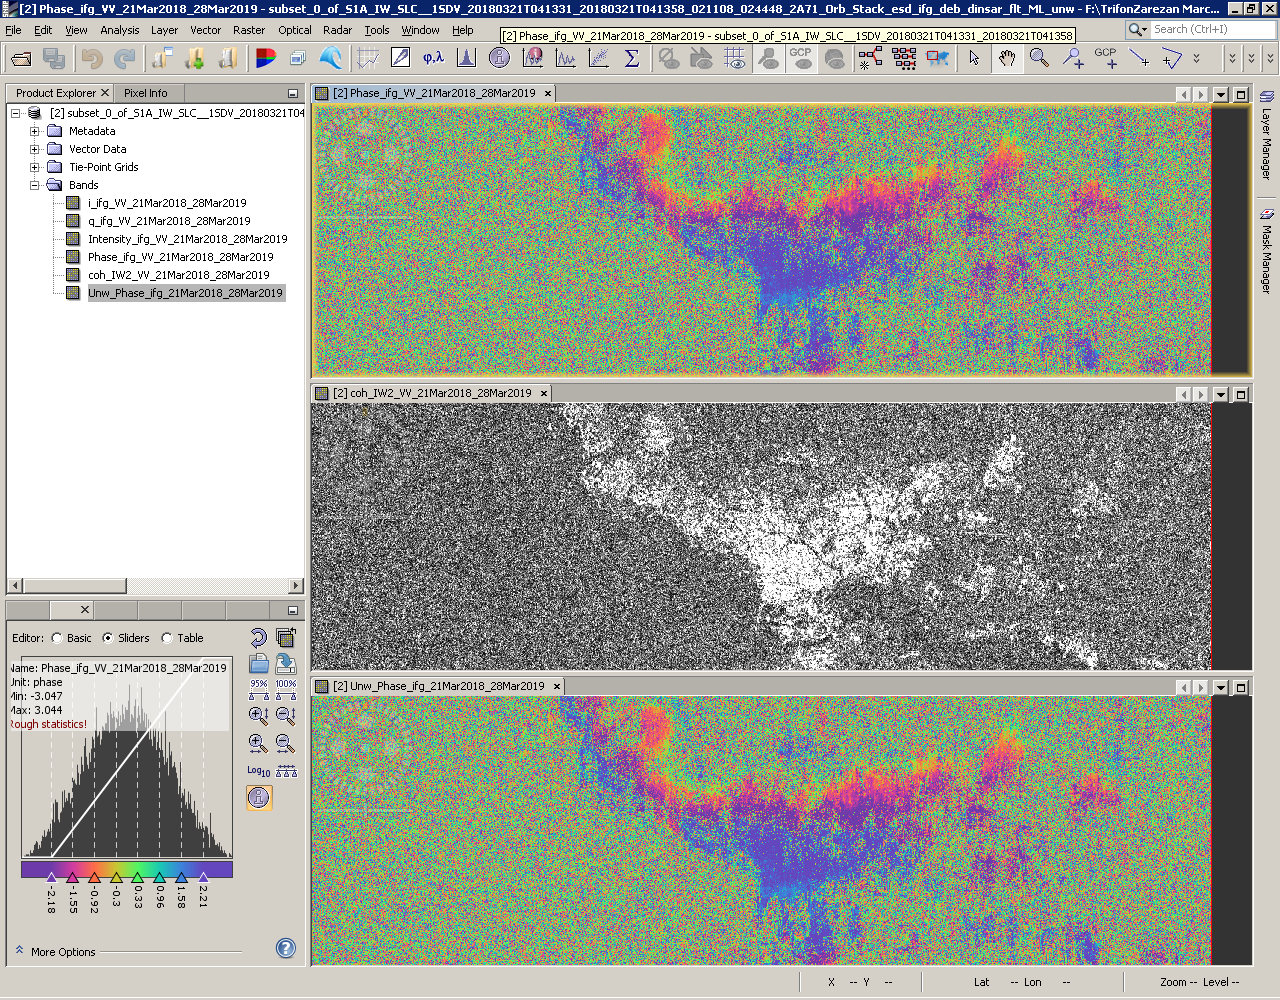
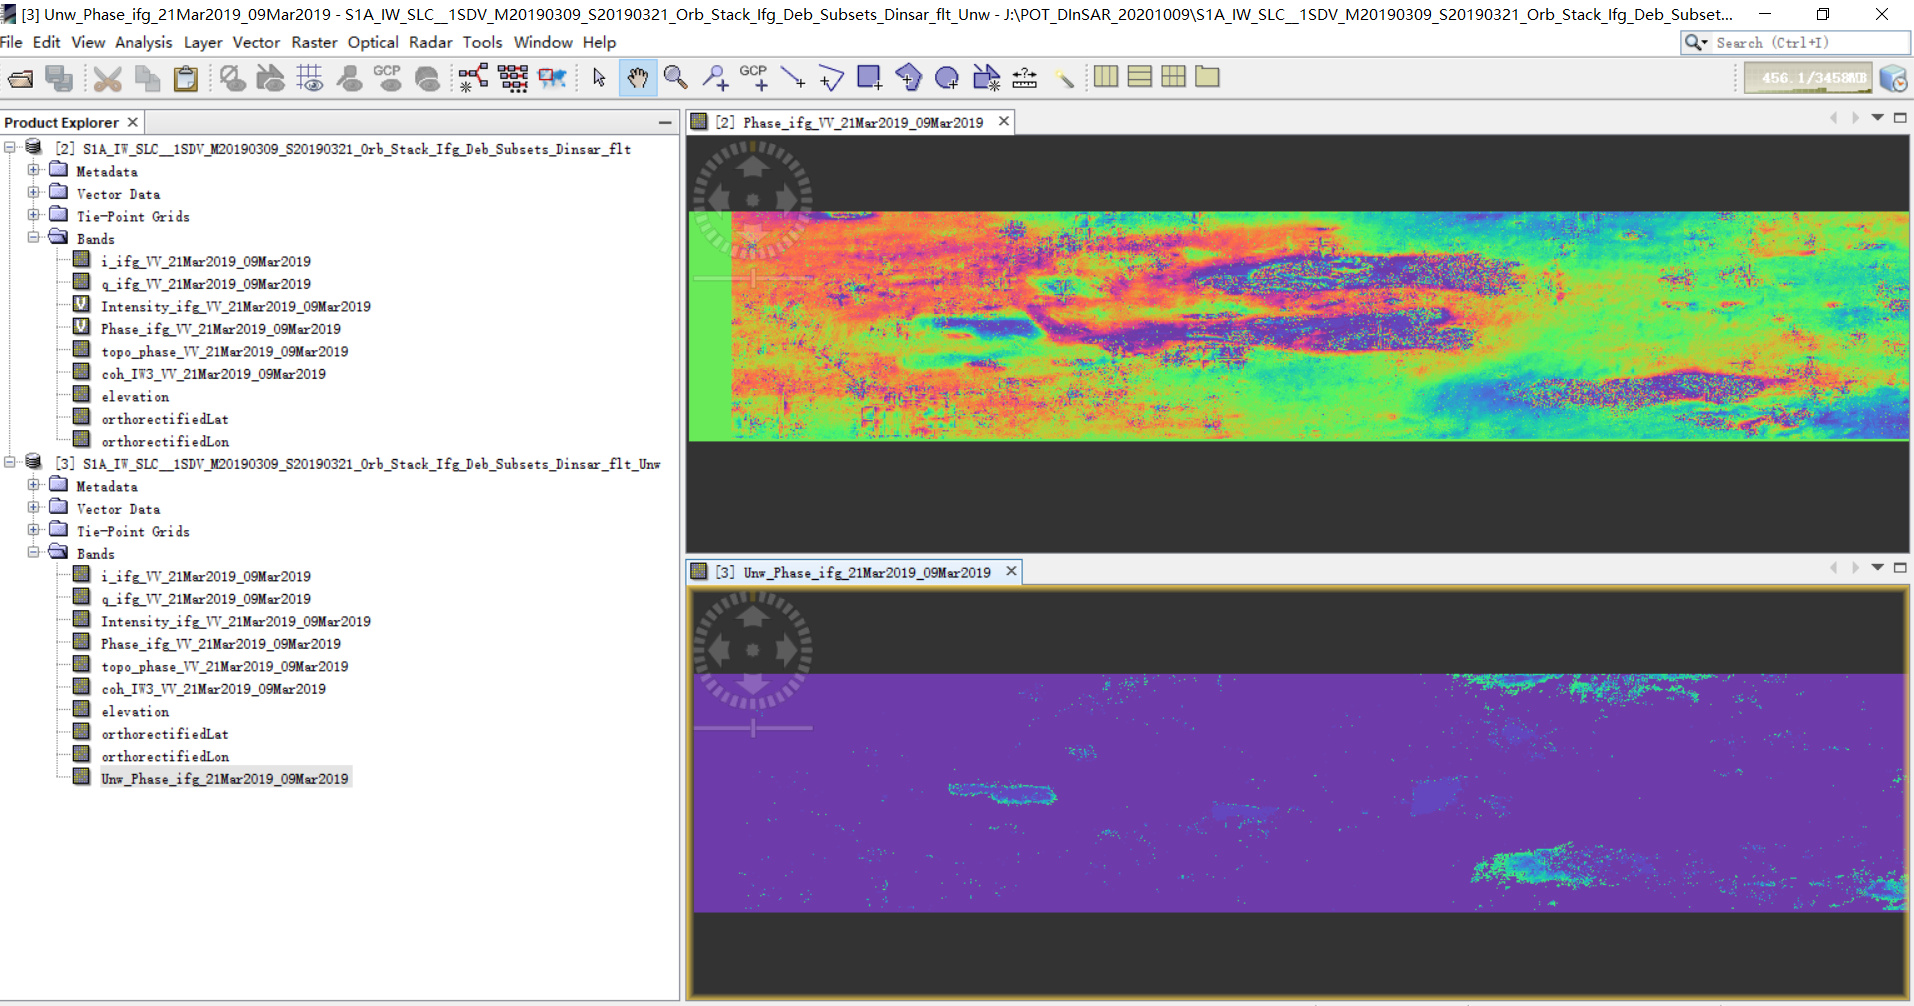
Could you please comment on picture below. The wrapped (up) and unwrapped (down) phase show quite similar patches, while I actually expected to be quite different. In the middle is the coherence which is quite acceptable for the region with white color.
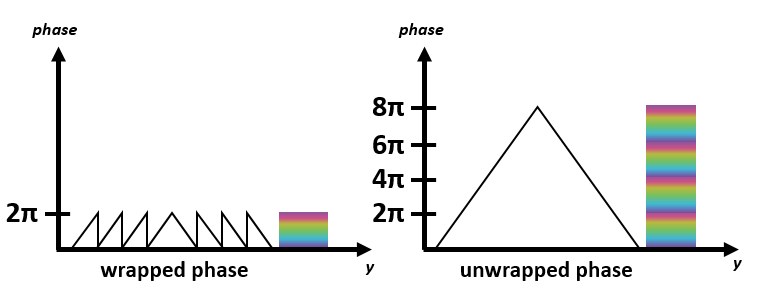
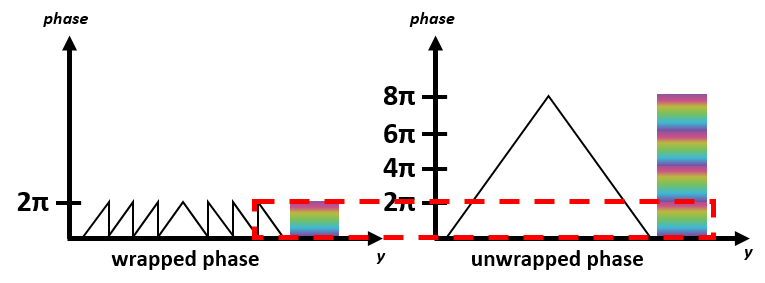
the unwrapping starts at a random location to calculate the cumulated phase. That means random values slightly outside the high coherence area can contribute to the cumulated phase we observe in your screenshot without being real fringes, and its sum gets accordingly higher. Still, the area ranges over one phase cycle only.
You can plot a profile across this area to see that they have the same slope, but simply a different offset. This is why the final deformation map needs to be leveled to a reference pixel with zero displacement.
Everybody please feel free to comment if you think differently.
@ABraun Thank you for your time to be prompt. Perhaps I’ll try to mask the low coherence areas in the interferogram before unwrapping and check the result.
Could you advise please.
@ABraun I was thinking if the values from unwrapped phase converted to displacements are trustworthy.
If i follow your comments they should be regarded as such having in mind that the process monitored is a slow one (in this case landslide).
@ABraun At the interferogram formation the topographic phase was subtracted.
In the region there are several stable points that could be good candidates for a ref. points.
I am not aware of any. Close to the area of interest seems reasonable but if there is a general ramp in your interferogram (like in the screenshot abve) which was introduced by incorrect orbit files or atmospheric disturbance, any reference point will lead to wrong results.
@ABraun Thank you for the reply in this late Saturday afternoon.
The orbit files should be fine - the precise orbits should be there.
Since the ROIs are at the sea shore the atmosphere is hard to estimate, so the data are somehow biased. concerning the ref. points - I could use a point that is 2km outside of the ROI, but I’m not sure how stable the terrain is since this point is part of a permanent GNSS network, but has been used for some years. The stable point could be more than 20km away and for this reason I was wondering about its closeness to the ROI.
Normally the expected annual deformation should in the range of centimeters if not extreme event had happened.
could you maybe terrain correct the interferogram once and overlay it on a Google Earth Basemap (including scale and some landmarks). I currently have no idea about the scale and nature of your study area, so it is hard to comment general things.
the current pattern suggests a general subsidence towards the coast, right? And I have no idea if this is within the range of possibilities or not.
@ABraun@hriston_bg
After the phase unwrapping process, I got some strange results (as shown in the picture below), but I don’t know what caused it. I tried to use multi-looking (range×azimuth=5pixels×1pixel) before Goldstein filter but the result is still the same.
Results before and after unwrapping(no multi-looking):
Does not look too bad to me. Maybe you can adjust the contrast of the low values in the color manipulation tab a bit.
I cannot comment on the patterns, because I don’t know your study area, the scale, the type of expected deformation etc…
What do you mean by the unwrapping starts at a random location? I assumed that the phase difference value that you see when looking at an unwrapped interferogram was simply a function of the phase change in the LOS direction from sensor to the target surface. Are you saying that phase difference values are relative to some location within your AOI? Also, what is meant by “cumulated phase”?
The interferogram is deterministic, you will always get the same based on two products.
But the unwrapping is an iterative process to turn these cycles into a continuous surface. As this involves adding up the different phase values, I called it “(ac)cumulated phase”.
Well explanations are given here: https://ieeexplore.ieee.org/ielaam/6245518/8671796/8672140-aam.pdf
So as I understand it from this reading and your comments (as well as other info online), phase unwrapping begins at some location within the interferogram (pixel of highest coherence or something else?) and all other unwrapped phase values are relative to that point. If this is the case, then wouldn’t I need to filter out pixels of low coherence prior to unwrapping for D-InSAR instead of after generating a deformation map? To avoid error introduced to other areas (accumulated error).
Yes, correctly.
It depends on the quality of your interferogram and on the pattern noisy areas if filtering prior umwrapping is recommend.
One way to do it is suggested here: Filter out low coherence pixels before phase unwrapping