Creating a cropped GRD from SLC using gpt

Have a working processing chain using S1 GRD products but due to the poor geographical location references in GRD products I try to produce a cropped GRD from SLC products. Will do “stack” operations and change detection using the cropped images and need co-registration level of geo references.

Using snap gpt and a batch script as attached. slc2geotiff.xml (6.3 KB)

the geolocation accuracy of GRD data is actually not that bad. It does not contain terrain-induced shifts, but the overall position of the image at the earth’s surface is correct.
Making a GRD from SLC makes little sense to me, to be honest. So maybe we can solve this differently?

Could you please clarify what you mean with “due to the poor geographical location references in GRD products”?

1 Like

Here’s an example, Sulaibiya tyre graveyard in Kuwait

pre-post-diff.zip (662.8 KB)

these images are hard to read - what do they contain?

Did you terrain correct the S1 GRD data before combining them with the vector data?

The images are simple raster TGA (Targa) files.

No terrain correction, or other processing was made on the GRD images.

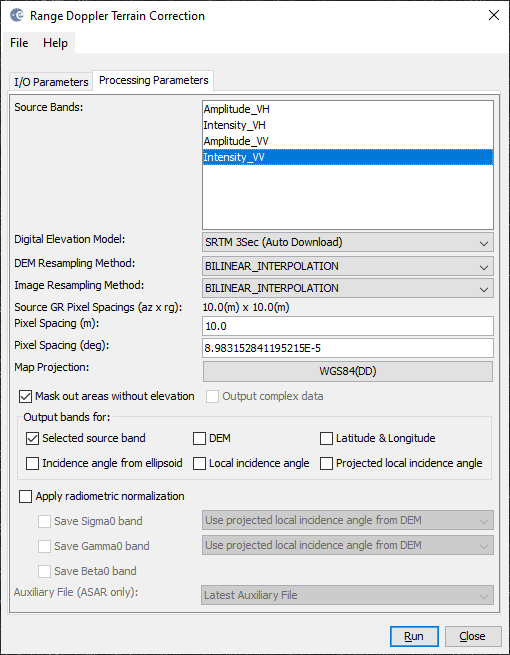
please apply Range Doppler Terrain Correction first before you overlay the data with vectors. This will improve the geolocation accuracy of the pixels significantly.

would that be the terrain-correction as outlined in the gpt batch script, using a local DEM?

slc2geotiff.xml (6.3 KB)

looks good. But again, converting SLC to GRD will not give you better geolocation. I recommend to test it once with GRD outside a batch script and check if the result is sufficient.

Thanks! Got the batch terrain correction/subset working with GRD, looks quite good. Is there a way to add additional map sources, like google maps to the WorldWind Analysis View?

How would I terrain correct the different polarizations separately? I need these as two geotiff files, not one with two bands. Any ideas for the batch script?

During Terrain Correction you can select a source band. If you only select one, there will only be one output

I have never used the WorldWind Analysis view, sorry. You can load a WMS to the main map window as demonstrated here: Better Map overlay?

Thanks a lot, got it all working now with gpt and script… the images are now really nicely geo-located.

very good.

Almost there… the Tie-Point Grids section is missing in the processed (subset’ed + TC) geotiff, how can I add it?

I’m using in-house extraction code to read out the pixels…

you will probably have to create them as separate bands using the Band Maths.

Wouldn’t that create a section under Bands and not at the root level?

Is it the subset step that removes this section? If just doing the Terrain-Correction and saving, would the Tie-Point Grids be left intact?

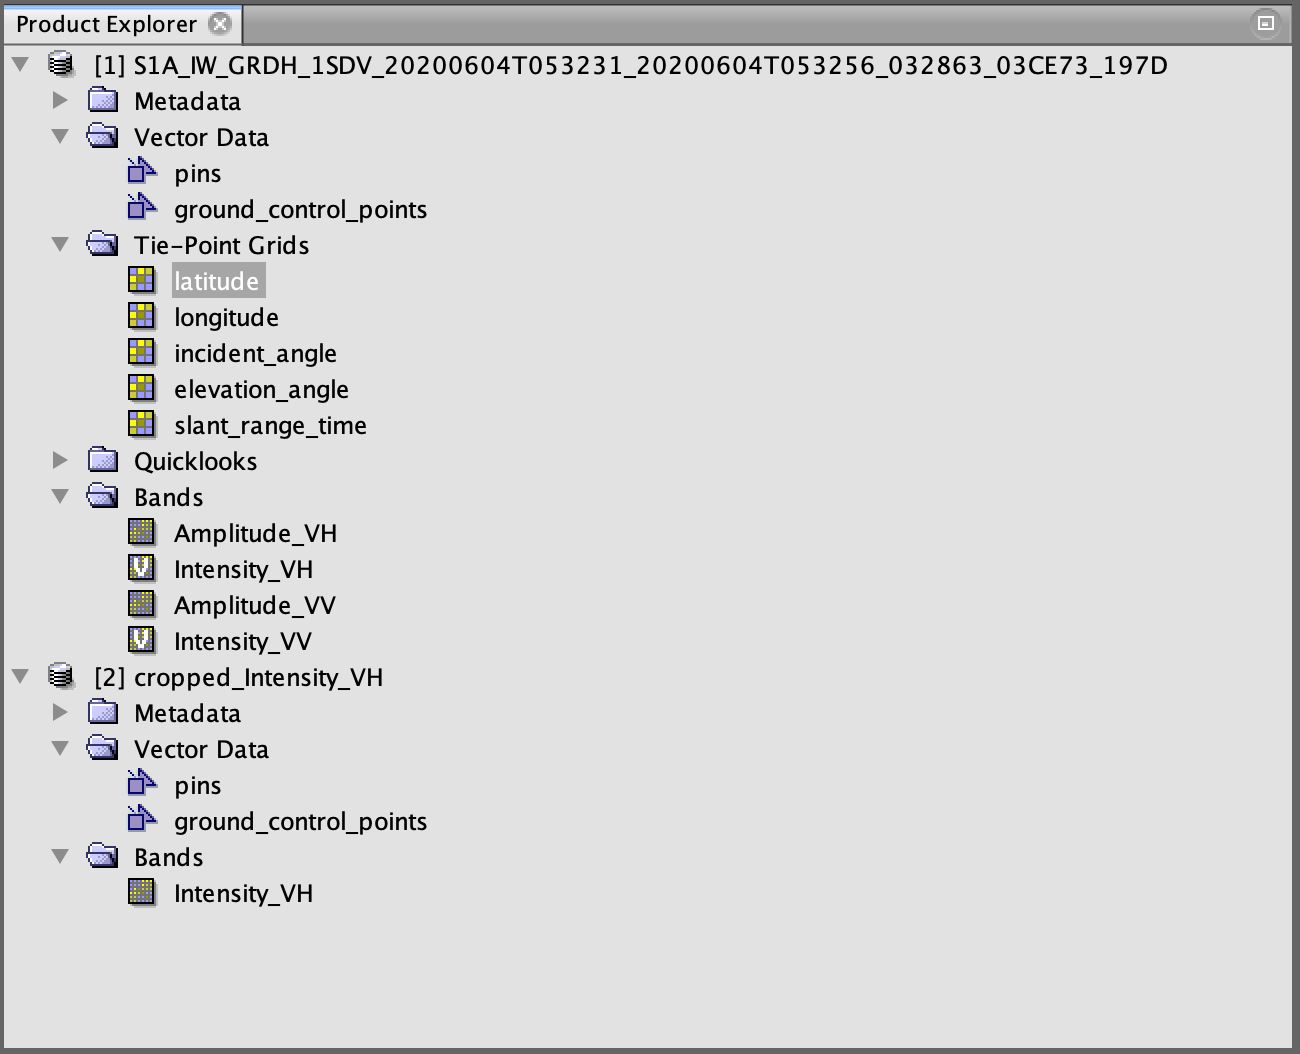
tie-point grids are not treated as official bands and Terrain Correction (including conversion to GeoTiff) will probably lose these grids.
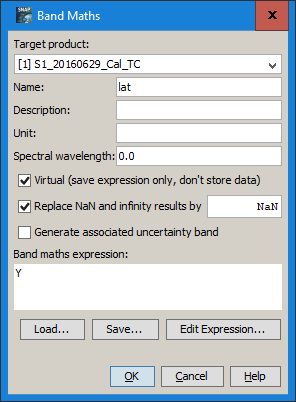
More importantly, after terrain correction, the initial tie-point grids are of lower positional accuracy (they exist from the beginning, but terrain induced shifts are not contained). If you need the coordinates of each pixel, I suggest to perform terrain correction first and then create the lat and lon bands in the band maths with the expressions X and Y

grafik

This can be done with the gpt as well.

In a last step, you can export the GeoTiff with all three rasters.

Seems like tiepoints are part of the standard, see here https://docs.opengeospatial.org/is/19-008r4/19-008r4.html#_requirements_class_modeltiepointtag

If I can’t reproduce the same file structure using SNAP and gpt I’m afraid this is a show stopper for me…

I agree that it can be contained by a GeoTiff, but the tie-points are generally no longer a part (because they contain obsolete information) after Terrain Correction.

I understand that terrain correction is making the initial info obsolete…but then we need to create an updated info, that’s how I see it.

How can SNAP show the Tie-Point Grids data? Selecting properties on these doesn’t reveal much, mainly the raster size…

Here’re the json contents from gdalinfo from the two files, I guess it’s basically the ground control points missing.

gdalinfo_cropped_Intensity_VH.tif.json (2.1 KB)
gdalinfo_s1a-iw-grd-vh-20200307t052415-20200307t052440-031565-03a2fe-002.tiff.json (42.4 KB)

Since it’s a small subset I might be able use these instead…

“cornerCoordinates”:{
“upperLeft”:[
12.6940838,
56.1047535
],
“lowerLeft”:[
12.6940838,
56.098645
],
“lowerRight”:[
12.7059415,
56.098645
],
“upperRight”:[
12.7059415,
56.1047535
],

I agree. But the Band Maths does exactly that.