@ABraun Hi,ABraun.
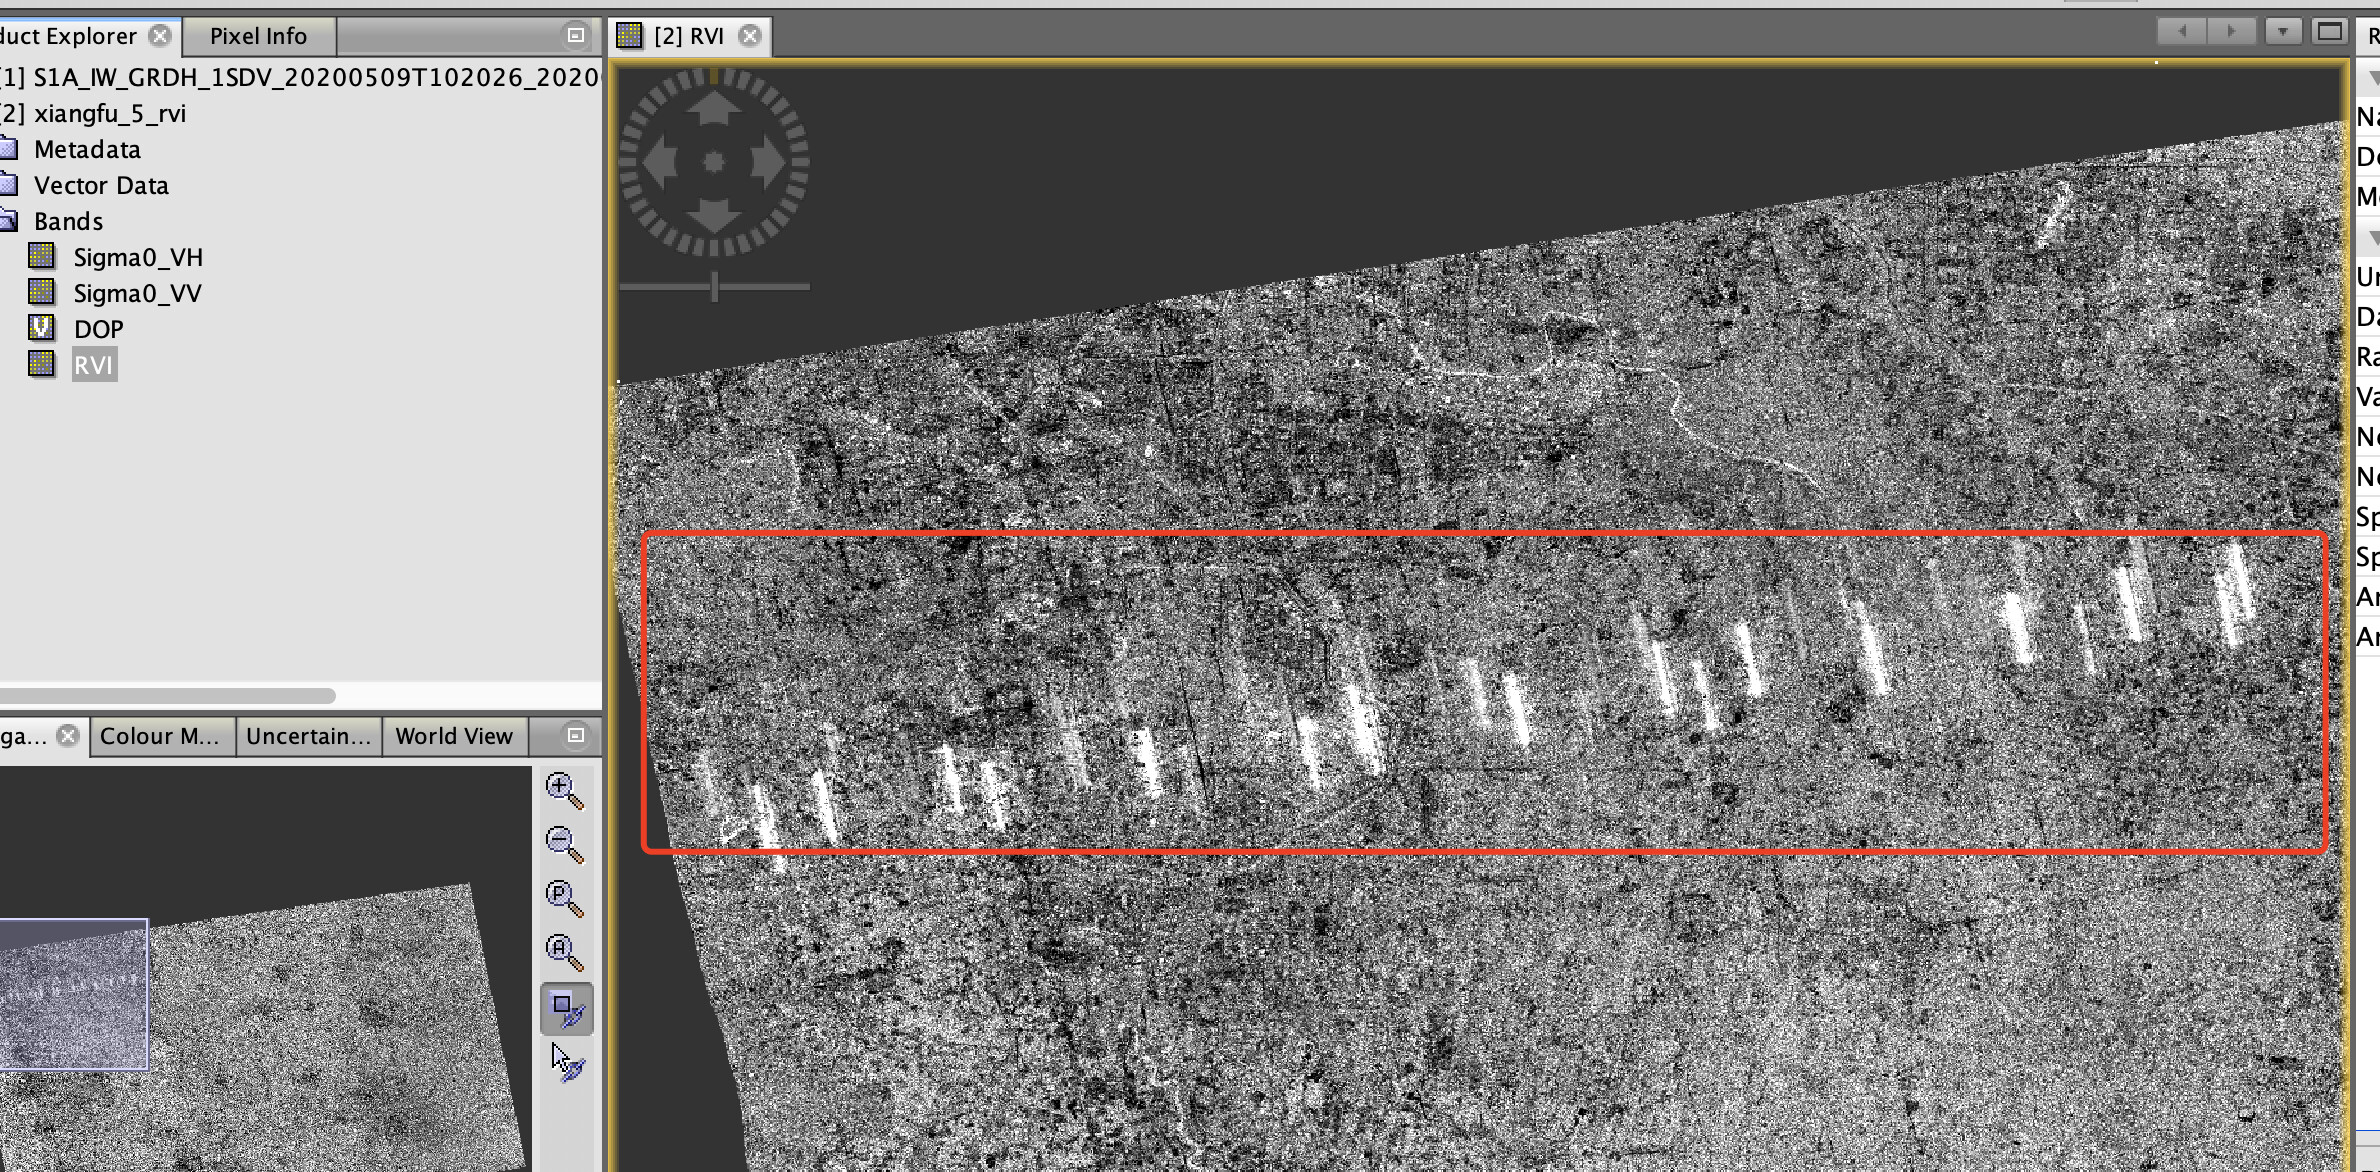
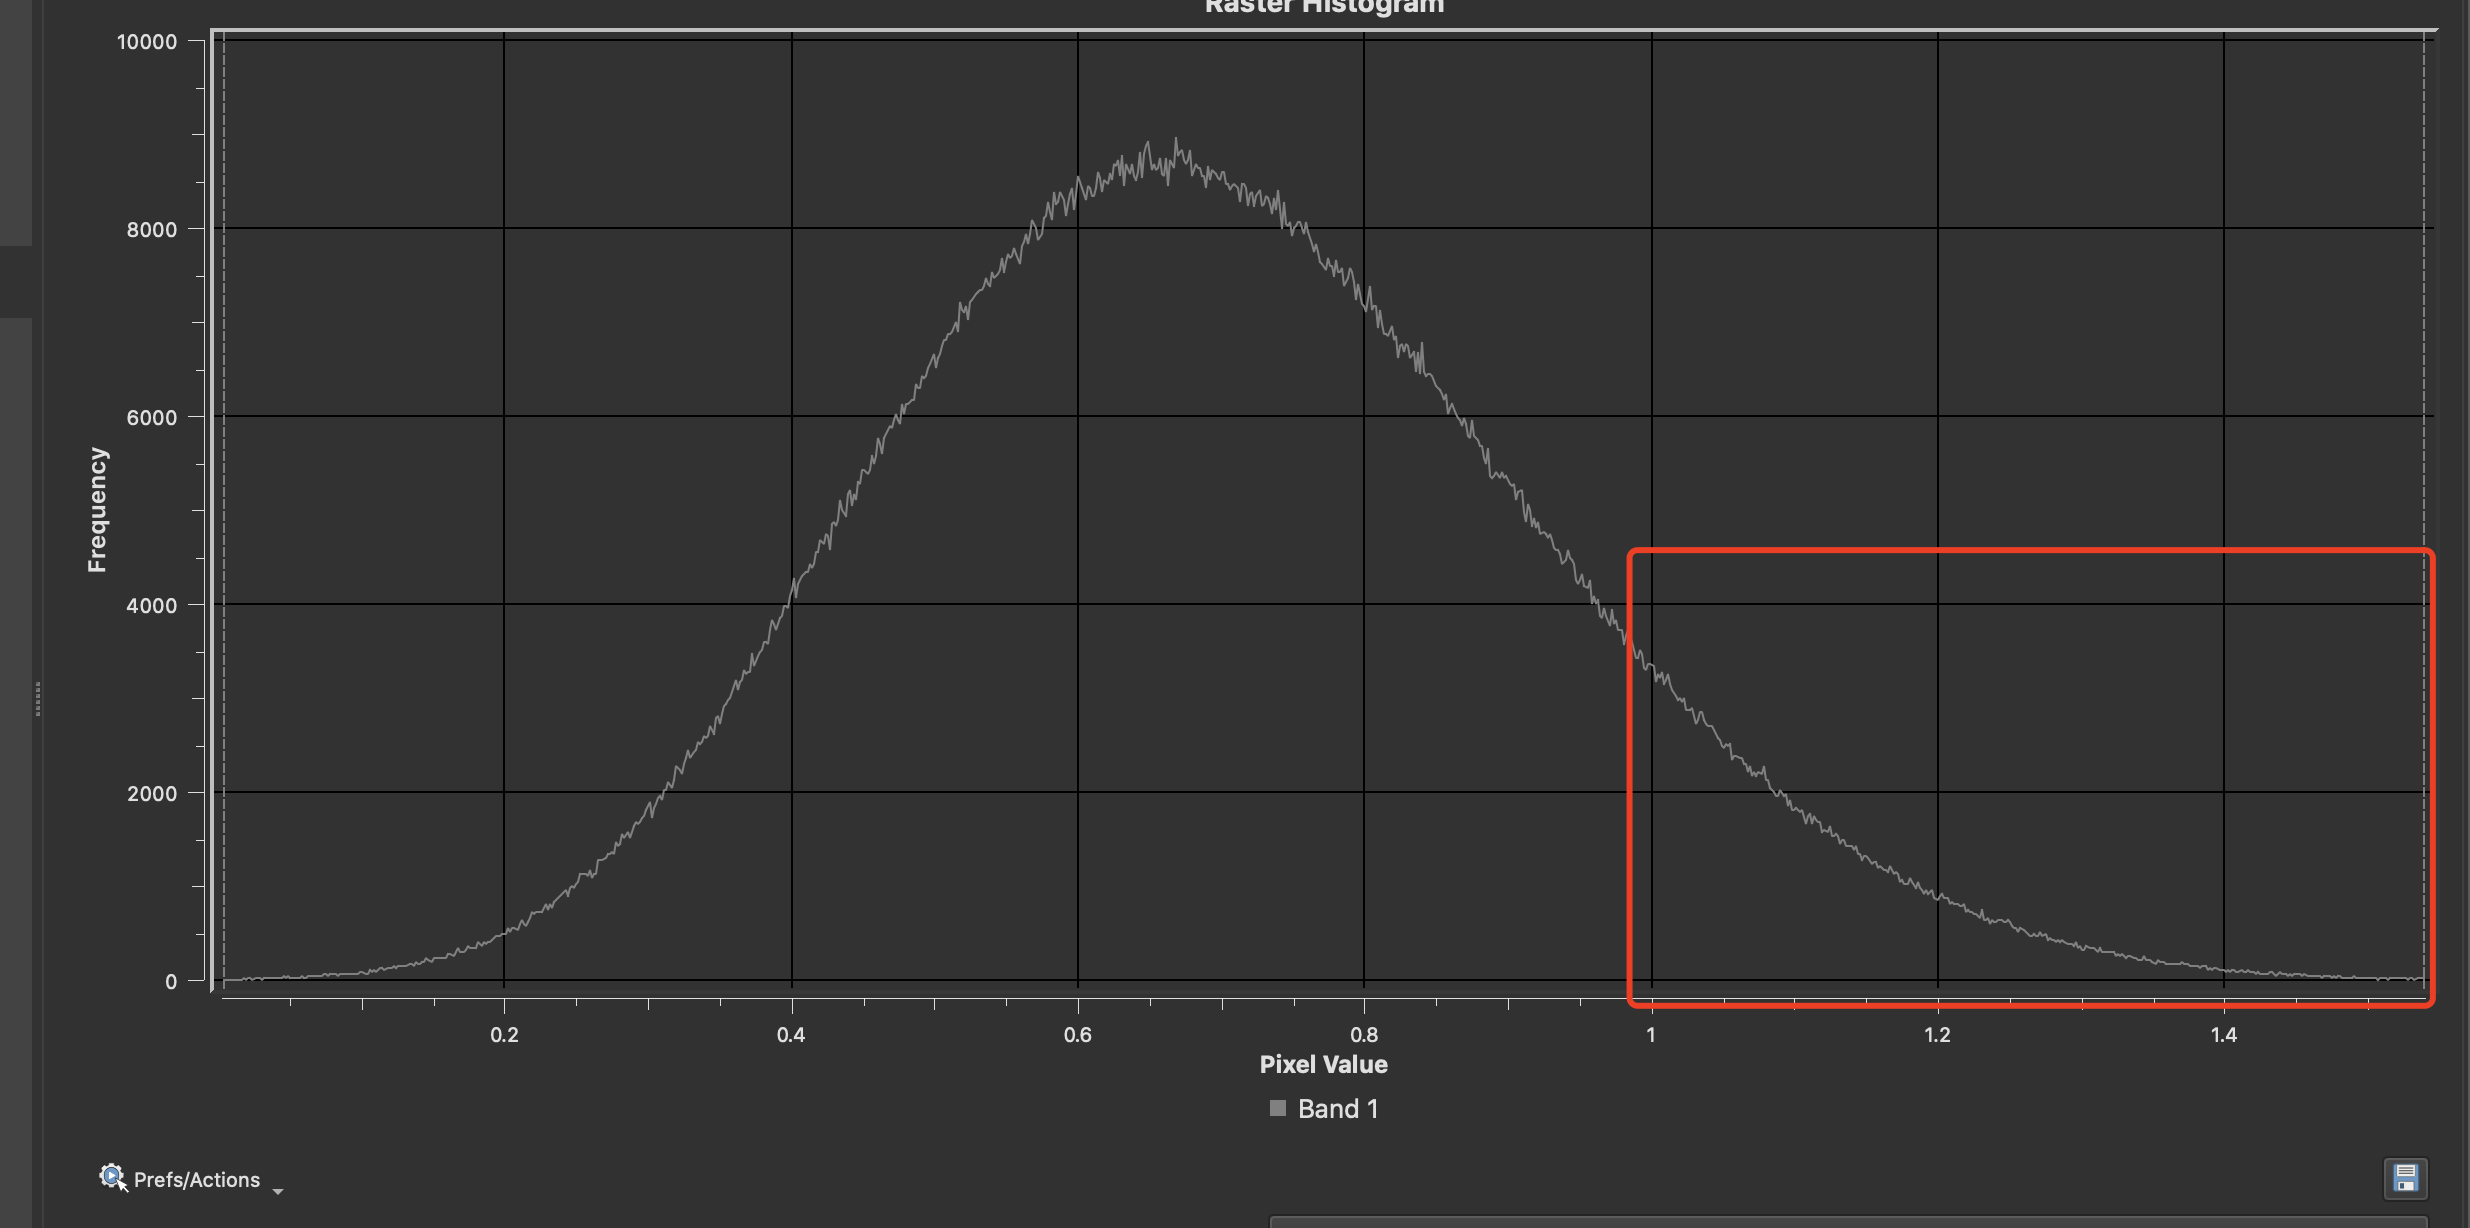
Could you explain what the white area with high value( > 1) means in rvi image?
Rvi band
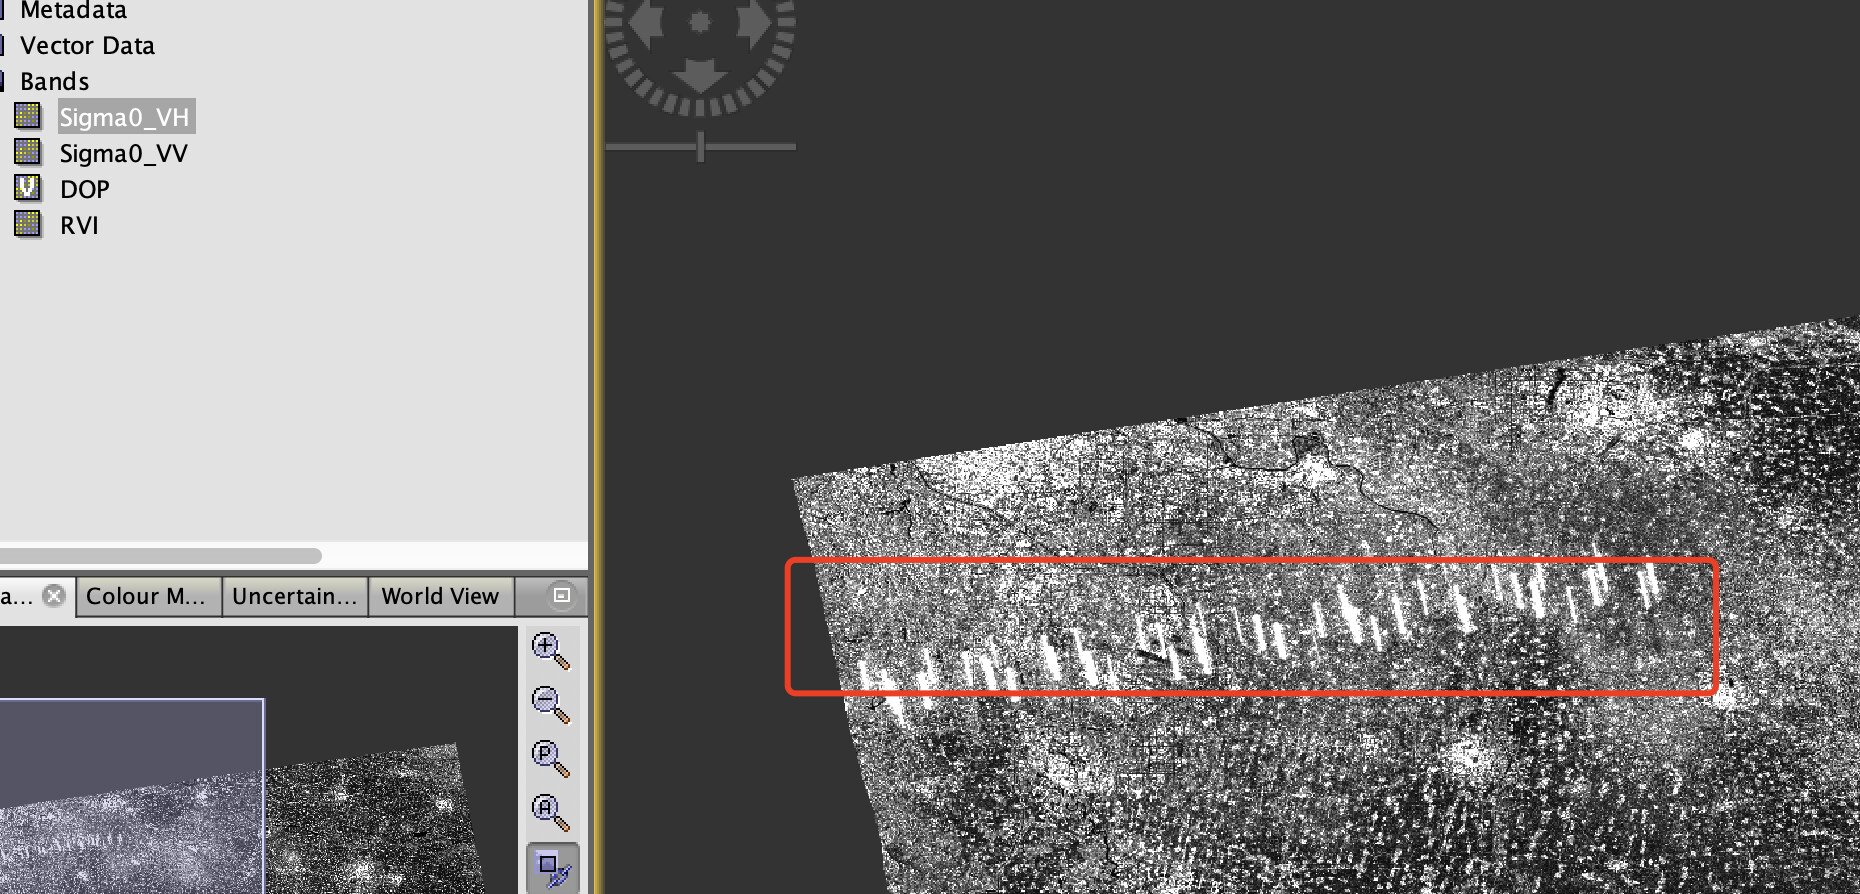
VH band
VV band
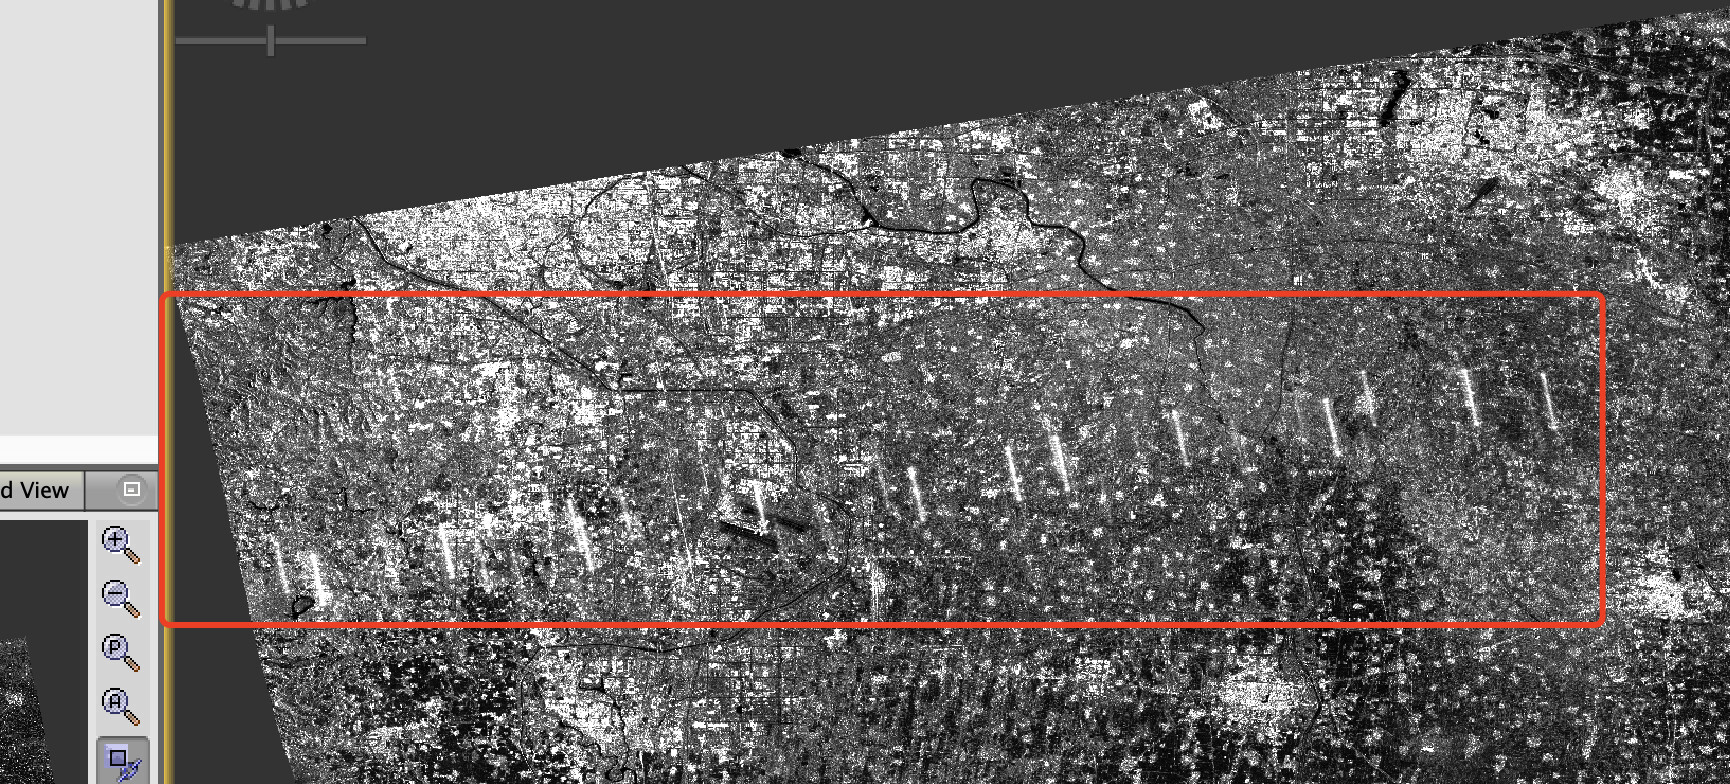
And I tryed servel sentinel-1 GRD scenes for rvi. Whatever there is white strip white area like above,there are always many pixeles with value greater than 1.
Does it make sense ?
Thanks for your time!