Hey STEP Community,
I am currently working on monitoring of crops in India using satellite imagery. I normally use optical data (Sentinel 2), and use it for assessment of crop health by computing various vegetation indices such NDVI, EVI etc. Since this is the monsoon season, many Sentinel 2 images often have a high cloud cover, which makes it difficult for calculation of these indices. Hence I am trying to use SAR data (Sentinel 1) for this purpose. I have been following this discussion. I have computed RVI using the Charbonneau’s equation as mentioned in that discussion, NRPB as in this paper and Radar NDVI as in this paper. I have used the preprocessing methods as mentioned in this post, along with this one from the discussion. I also followed the methodology mentioned in this video. I did all the calculation using Band Math, and compared the results with that of the NDVI maps. They both do not correlate by spatial extent.
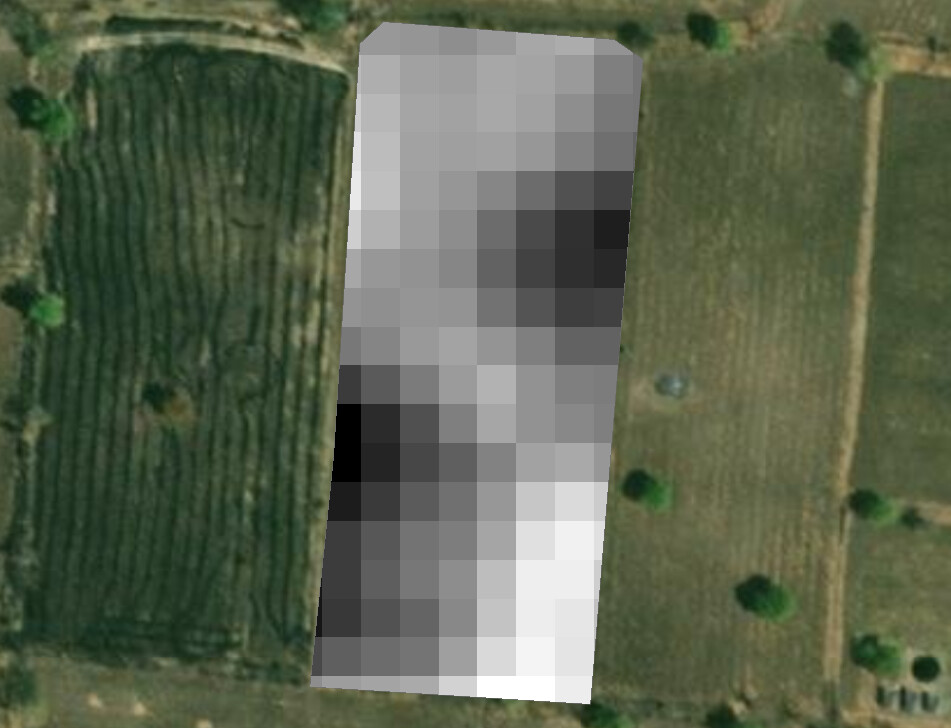
Here is an RVI map for the same area on the next day. The maps for NRPB & Radar NDVI are similar
I realise that both work on different principles, but the general parameters of health should to some extent show a little correlation at least spatially. Am I going wrong somewhere or is there something I am missing out on. Any help and guidance would be greatly appreciated.
The correlation often emerges within a larger range of multiple images over time.
What kind of crops is grown here? The physical characteristics are indicated by SAR backscatter, like the transition from bare soil over seedling to fully developed grains, and finally harvest.
Comparing within-field variation from images of this resolution is tricky.
Thanks for the prompt reply,
This field is of turmeric and it is currently in early-mid stage of growth. I have tried multiple indices such as SAVI, NDMI for the same date, which shows me a similar result. However with SAR, I am not getting the same result. In fact in one case the Optical Indices values for the field decreased over time which corresponds to the field observation (yellowing of leaves), whereas, SAR Index values increased for the same. Is there anything wrong with my methodology, should i try something else for this purpose ? Should i try data fusion of S1 & S2 (however I doubt it would be effective in case of cloud cover exceeding 75%) ?
If you want to be independent from optical data fusion of S1 and S2 will probably not help you during cloudy times.
I don’t think your approach is wrong in general, you can try different combinations of VV and VH to test if they have higher correlations with NDVI. As you say, the chlorophyll decreases but the volume continues to increase, so at a certain stage measures might no longer match together.
Did you try to create a scatter plot to see how well both bands correlate?
Hi,
I think there is nothing wrong with your analysis. I would give you some suggestions, though.
When compare optical and SAR values compare average polygon values. Do not compare pixel-per-pixel because SAR is noisy.
SAR data might need some smoothing. If you have only limited number of SAR images they might not yield anything useful because of the date-to-date inconsistency of SAR imagery (mostly because of the different levels of moisture/dew/humidity in the field, I assume).
If you use SAR imagery acquired under different local incidence angles (different tracks) use the local incidence angle normalization or treat images from different tracks separately.
Use other optical VIs such as EVI. If you use Sentinel-2 try red-edge indices such as ReNDVI, MTCI, WEVI, WNEVI.
Plot on one big graph you VV, VH (separately for each loc.inc angle or together if you normalized the angle) and your VIs. Staring on the graph for 15 minutes might be insightful. Try different VV/VH combinations.
If finally there is no correlation (including negative correlation) don’t be upset. Optical indices measure “greenness” of the field, while SAR VV mostly related to biomass and SAR VH to canopy development. Some crops might not have any meaningful correlation between these parameters.