Thank you so much.
Hi!
I’m trying to create a RVI from S1 data by using Charbonneau’s equation from the paper above. But instead of getting a value between 0-1 I get one between 0-4

I could just divide the result with 4 to get a band with values between 0-1, but I’m curious if I’m meant to do that or if I’m doing something wrong.
I replaced HV with VH and HH with VV in the equation
Cheers
I’ve split this thread into two. Because it went into a different direction as the initial question.
1 Like
Can I see your research results?Thank you!
Sorry but I can’t find the splitteds posts, could you link these?
That’s the other one:
1 Like
Goodmornig,
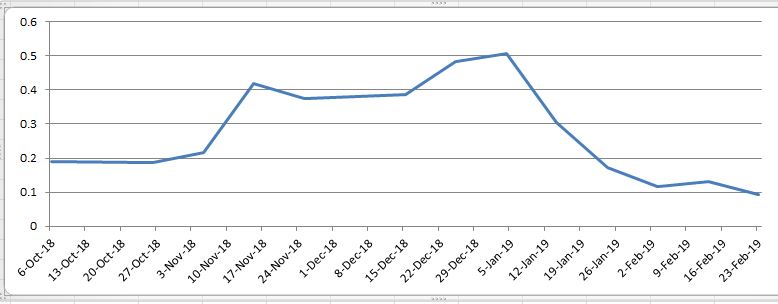
I’ m trying to get RVI values by HV and VV polarization GRDH data of a two years (2017-2018) time lapse on meddle Portugal. Now, that’s the result of RVI=4*VH/VV+VH formula
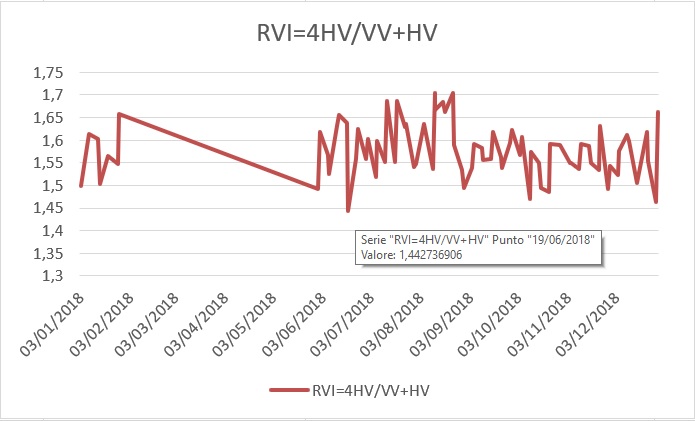
Values range is min=1,44 max=1,7, is it possible?
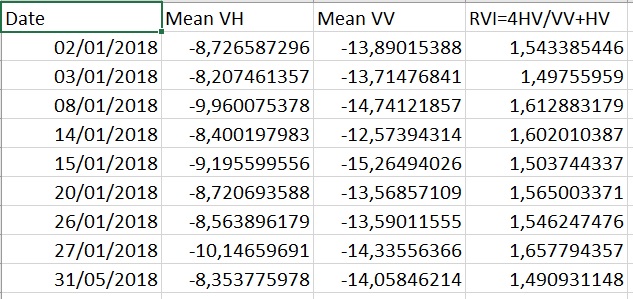
Starting values are the means dB values of the whole parcel pixels, ones of them are showed below
this parcel is an Eucalyptal forestry, and we would to detect the cut date, which has supose to be in 2017, using this data. Datas were getted with SNAP and S1B_IW_GRDH kind products by this process
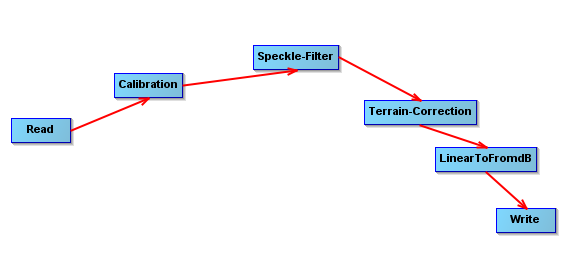 Calibration with sigma0band.
So, could I use RVI in this way?
Where I can find _Charbonneau, F., Trudel, M., and Fernandes, R. 2005. Use of Dual Polarization and MultiIncidence SAR for soil permeability mapping. In: Advanced Synthetic Aperture Radar (ASAR) 2005, St-Hubert, Canada. _
and _Kim, Y., and van Zyl, J. 2004. Vegetation effects on soil moisture estimation. In Geoscience and Remote Sensing Symposium, 2004. IGARSS ‘04. Proceedings. 2004 IEEE International, Vol. 2, pp. 800-802. _ used here to justify RVI?
Thanks for your attention
one thing to note is that if you convert to dB scale, your data is in logarithmic scale. That means, you cannot divide as initially given in the formula. I tried to translate it back to power scale (here), but I am not 100% sure if it is mathematically correct.
I recommend skipping the LinearToFromdB step instead and then apply the formula as you mentioned it: RVI=4VH/VV+VH
4 Likes
Hi everyone,
I have done the RADAR VEGETATION INDEX process by using the formula 4VH/(VV+VH), after that I need to extract RVI value for my different fields,can you please help me to extract RVI values for my fields, and also I have done RVI for the time series images, now I need to plot RVI Vs time series images, I’m requesting you to please suggest me the process.
like this I got some time series images, please help me to do the process…
many thanks in advance.
you can either digitize polygons for your fields or place pins. In a second step, you use the time-series plugin to extract and display temporal measures as described here: Time Series (Temporal) of NDVI
hi team,
I’m trying to do RVI for time series images, by using RVI=4* VH/VV+VH this formula, I’m getting some outputs, but I don’t know whether it is right or wrong. Sir kindly please help me, how we will calrify that.
is the RVI will come same as NDVI??
thanks in advance.
It will not completely replace NDVI because it is based on surface characteristics (mainly the ratio between cross-polarization and co-polarization) instead of the chlorophyll concentration.
But similar to the NDVI higher values indicate higher vegetation presence. It is quite a relative measure with no distinct minimum or maximum.
thank you sir for your information, but sir I’m not getting the proper output.
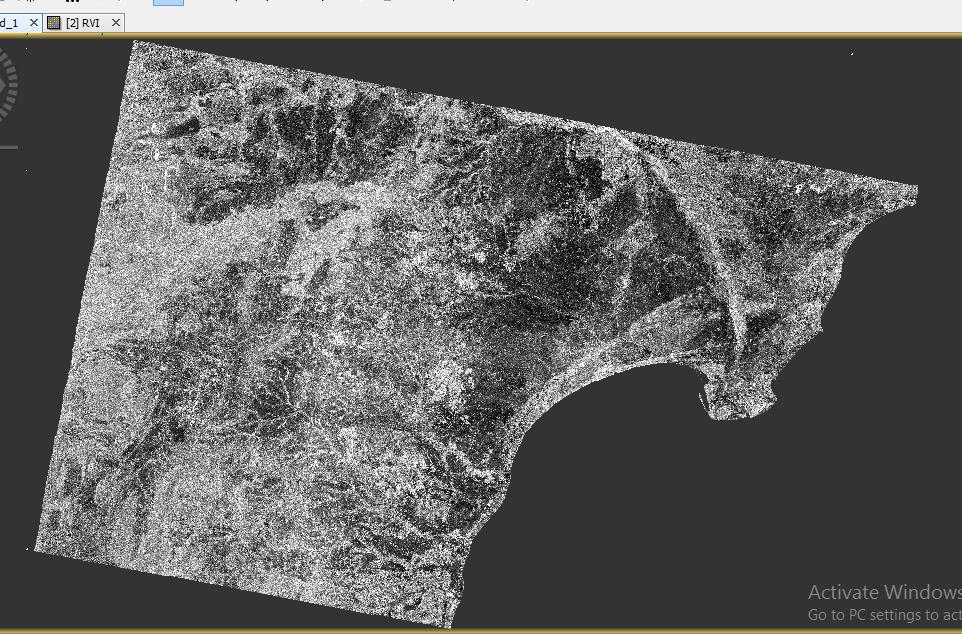
these are the outputs I got,Sir RVI is fully opposite to NDVI. I have done this process for Sunflower crop,these are the steps I followed
1.speckle filtering(Lee filter)
2.Radiometric Calibration
3.Geometric terrain corrections(DEM : SRTM, resampling: Nearest Neighbourhood)
4.Band maths (4*VH/VV+VH).
sir is it right or wrong, if wrong means please help me sir to get proper RVI
thanks in advance
I’d say there is no right or wrong.
If you technically derived the index according to the published equation (make sure to set paranetheses around the numerator and denominator), the index is correct.
While for some vegetation it might match the variation of the NDVI, it coudl be different for others. It is important to understand that all information derived from SAR backscatter originates from roughness, size and orientation of the objects or surfaces within a pixel.
I read this topic, but I didn’t understand how to calculate RVI.
Sorry for my ignorance, but can anybody write the algorithm how to create RVI, using Sentinel 1 data? What kind I product must I use - LSC or GHRD?
GRD is the correct one but Sentinel-1 has only VV and VH data. The original RVI can only be computed from full polarization data (HH/HV/VH/VV).
1 Like
but what about this equation?

where is this from?
in this paper
I can’t read it and don’t know if it is a suitable measure but you can simply open the band maths by right-clicking on a raster and select “band maths” and enter the expression there.