after converting the velocity in the csv file and try to open in qgis from creating a layer from delimited text layer it doesn’t work. plz suggest me what I am doing wrong in this.
based on “it doesn’t work” we cannot tell you what is wrong. Please give more information about the data, the CSV and why you cannot import it in QGIS (error message, wrong location…)
You can also post screenshots in here (simply copy and paste) or upload the CSV with this button ![]()
Sir
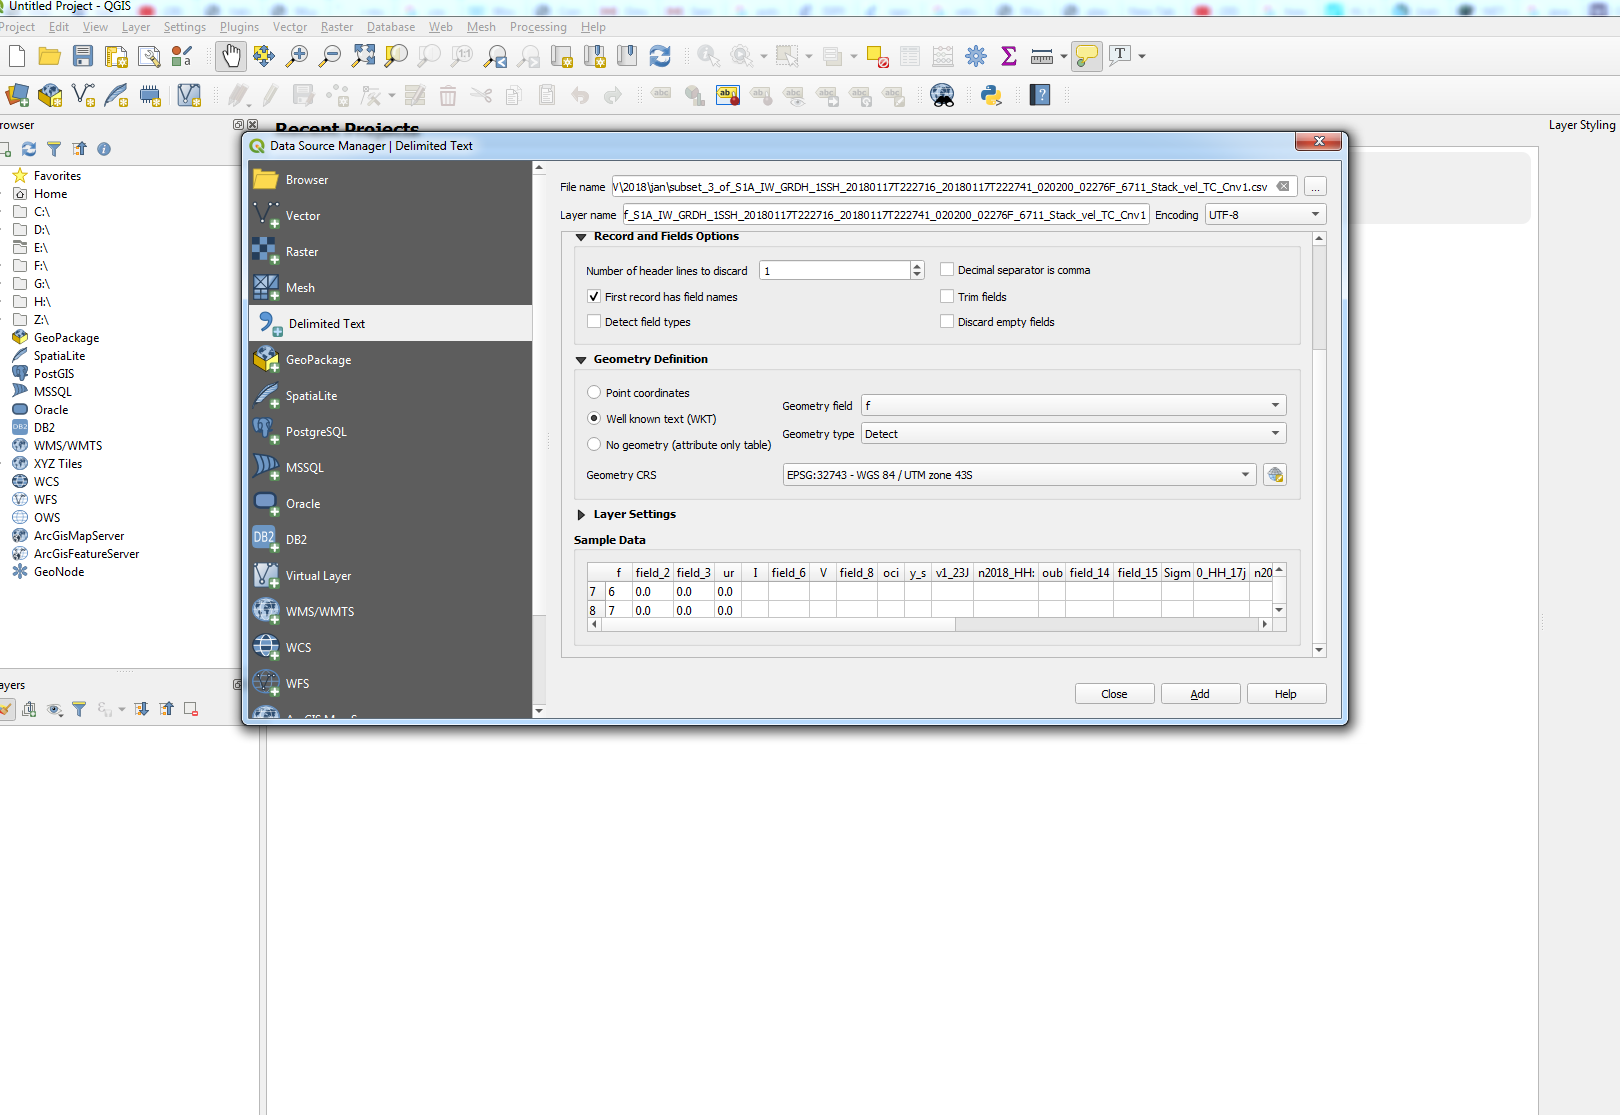
why the second image not loaded. I am wondering about the table that shows in the sample data, why the values showing Zero there.
plz help sir.
Sir
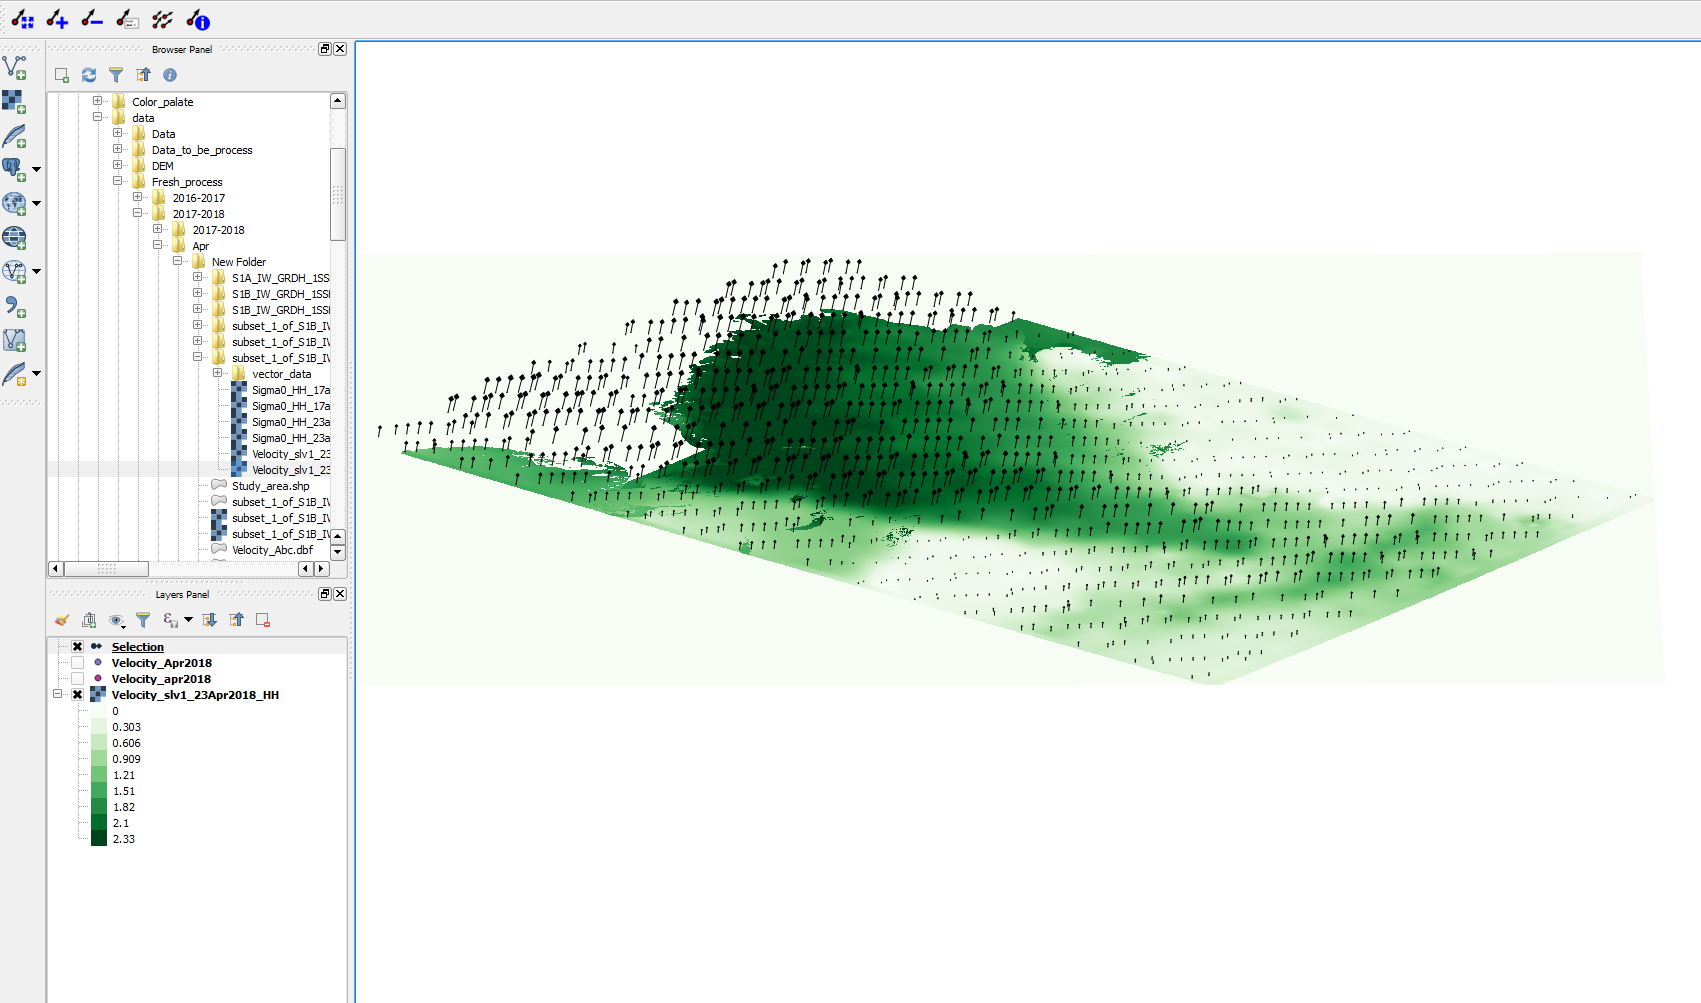
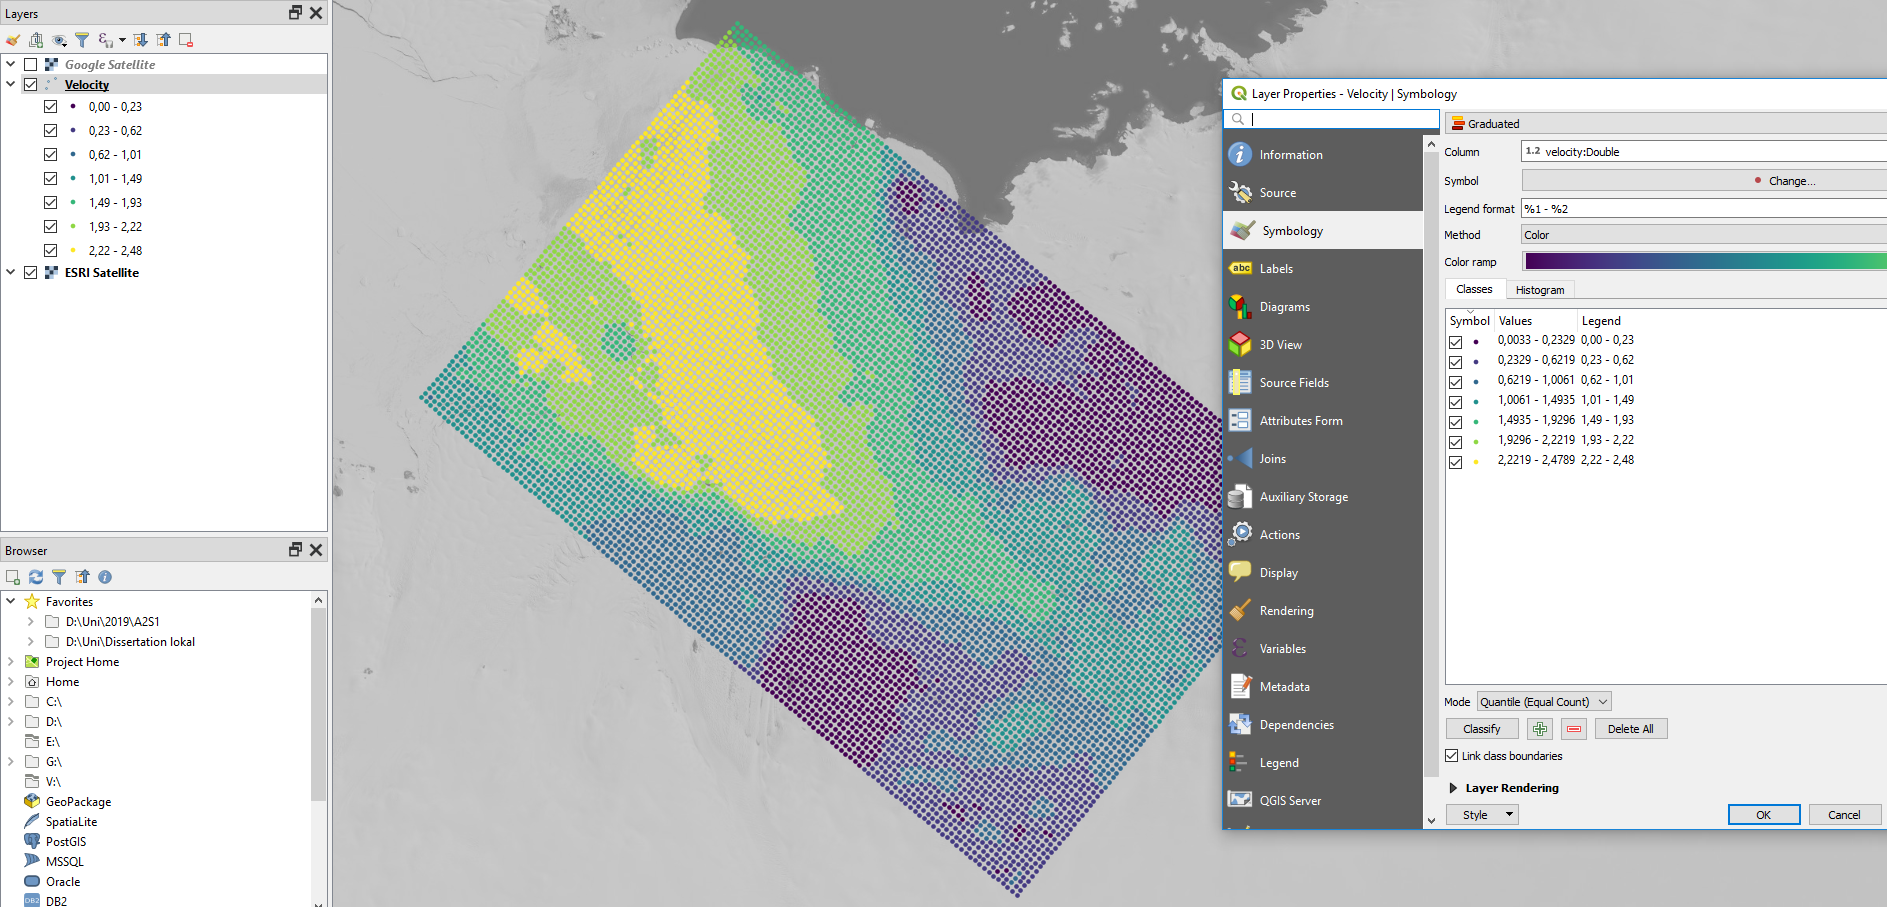
Actually i want to get the flow direction of the glacier. by prefering the eesa RUS copernicus tutorial. i tried to get but i am not able to get the flow direction.
can you please upload the csv file in here (or send it to me via private message)? Based on your screenshot it is not entirely clear where the problem lies, but I think it is a matter of correct import parameters for QGIS.
How i contact you personally?
just click on my avatar/username and select > message
please wait until the upload is finished before you submit the post. The one above was not ready yet.
The file you provided (1.5 MB) cannot be displayed in QGIS because it has no lat/lon coordinates.
How did you generate it? File > Export > CSV is not the correct way in this case.
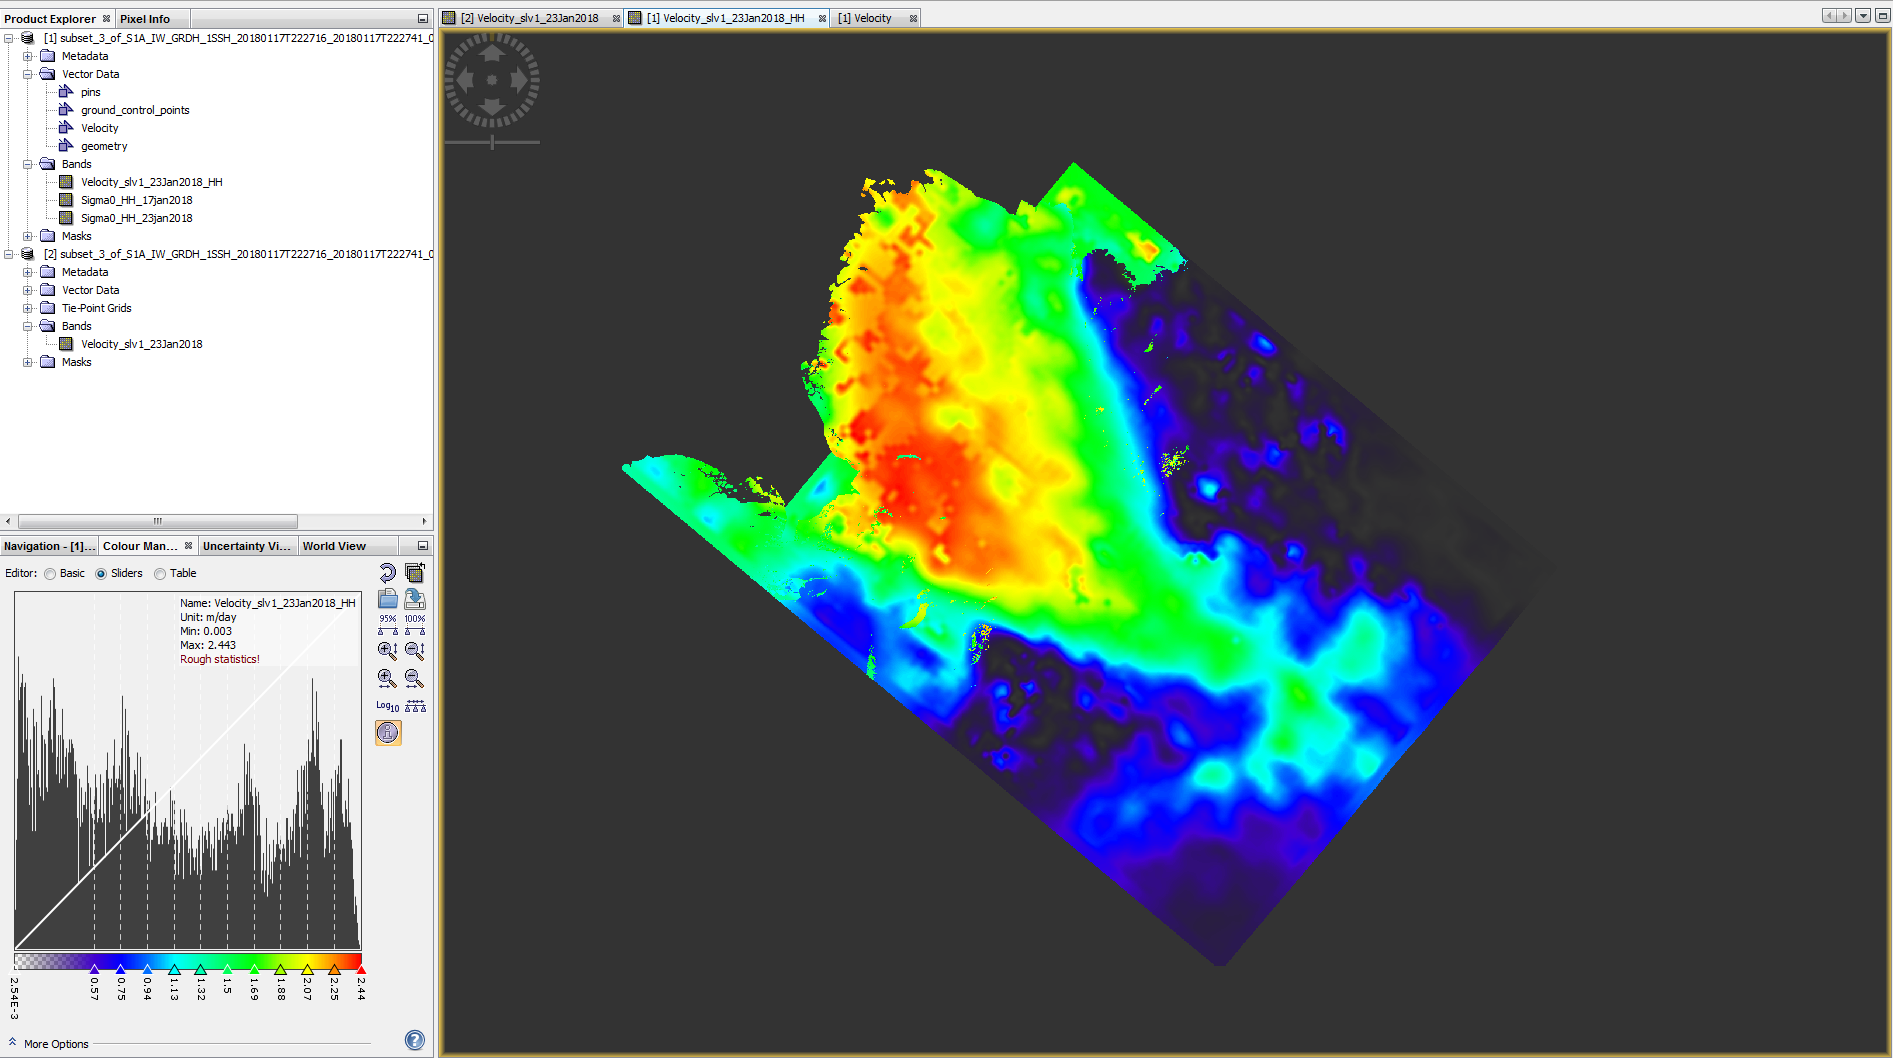
Please have a look in the .data > vector_data folder of your BEAM DIMAP file and see if there are any other files besides pins.csv and ground_control_points.csv
I would expect a file which indicates the velocity vectors in the image as well.
yes sir there is a velocity vector in the BEAM DIMAP format.
how to convert the BEAM DIMAP to to .csv. to i get the lat and long value.
once i had tried by Raster>Data Conversion> convert data type>save as csv> and convert the target type to float 32. but it also not work.
What is the right way to convert the BEAM DIMAP to csv.
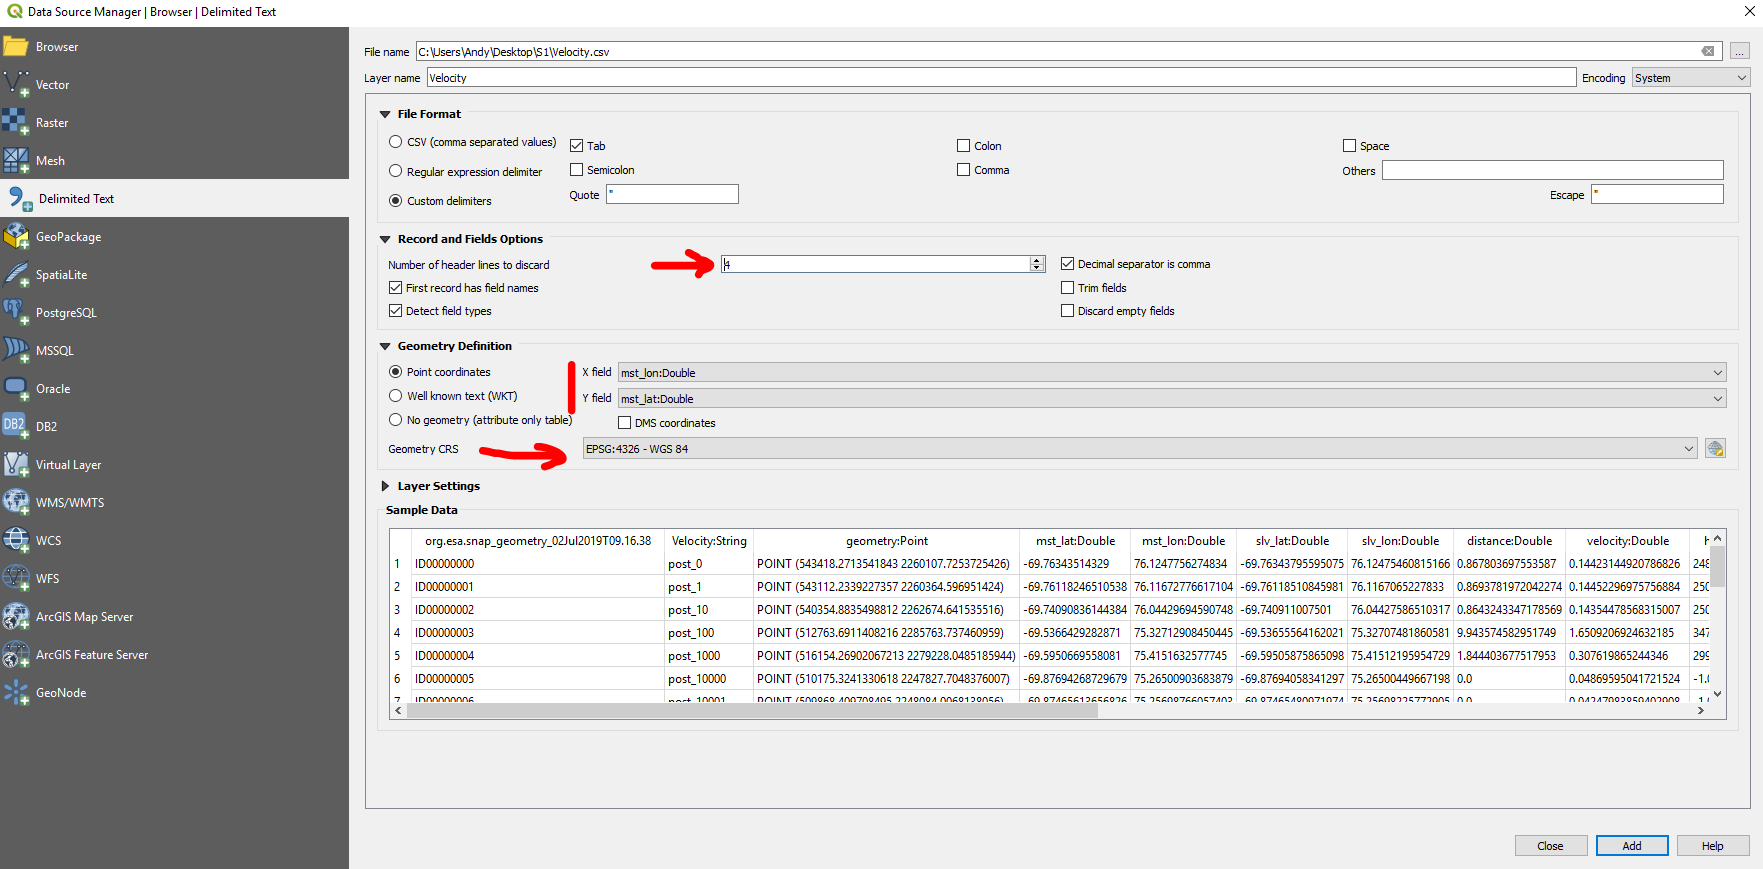
this only exports the pixel values but not their locations. Please upload the velocity vector from the data folder here and we can try to help you.
ground_control_points.csv (209 Bytes) pins.csv (225 Bytes) Velocity.csv (3.4 MB)
I have done it. I got the direction.
Thankyou sir so much
Hi sir
I have to plot profile for the velocity that i get and compared it to the the data that i get from NSIDC.
The data i get from NSIDC is in Netcdf format. how to plot profile for both data.
once you imported your csv into QGIS you can save it as a point shapefile in a first step.
Then you use the “point sampling” plugin to extract the values from the netcdf to these points (including the velocities). The output is a table which has both values ready for comparison.
Sir Can u please give me an example of it. I don’t understand.
Is NISIDC data that is in Netcdf format directly open in QGIS.
I installed the point sampling plugin.