I am trying to generate DEM from a pair of product:
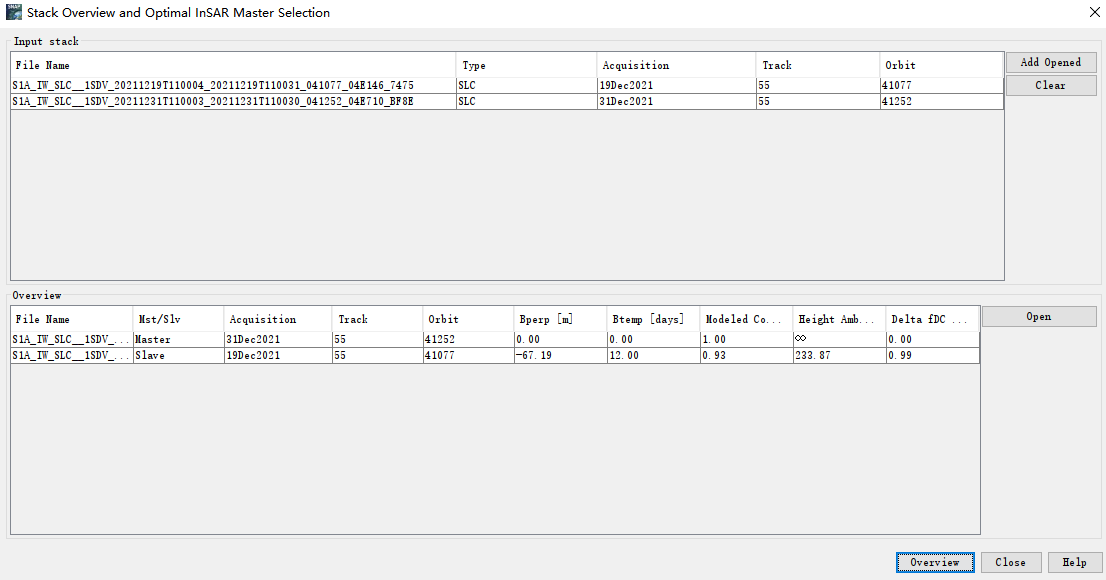
S1A_IW_SLC__1SDV_20211219T110004_20211219T110031_041077_04E146_7475 (master)
S1A_IW_SLC__1SDV_20211231T110003_20211231T110030_041252_04E710_BF8E (slave)
following this guideline step by step:
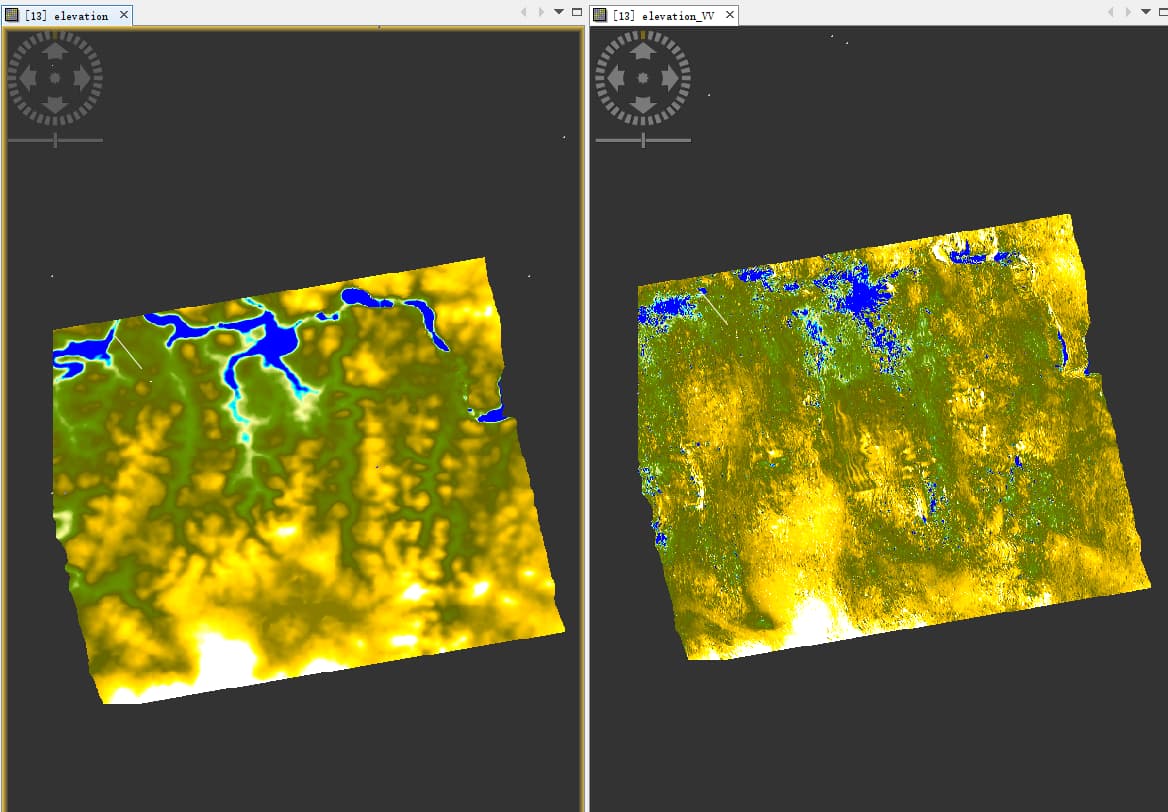
however, the results I got doesn’t looks weird… and wondering if anyone could help explain (left: SRTM DEM 1sec ; right: DEM generated from VV of the image pair):
In fact, I do have a few related things that need help clarifying:
I am trying to find out if there is subsidence happening at target area from 2019 to 2021, and trying to do that by generating DEM for 2019, 2020 and 2021 seperately. (tried DInSAR first using image pair 2019-2020, 2019-2021 and 2020-2021, but might because of the temporal baseline of year gap is too long, the coherance is quite low (around 0.2-0.3 for most pixels) I didn’t get reasonable outcome.) Wondering if this methodology would work theoretically?
The SRTM dem 1sec - would that affect the quality of the InSAR/DInSAR output?
Your approach is challenging. DEM differencing would require DEMs which are extremely precise for all three years. I am not sure if this can be achived by the coherence observed in your area. There are some studies which make use of this concept (TC - Recent mass balance of the Purogangri Ice Cap, central Tibetan Plateau, by means of differential X-band SAR interferometry), but these use bistatic SAR (temporal baseline = 0 days) to minimize temporal decorrelation.
Any differences, either calculated between the Sentinel-1 DEMs, or by differencing openly available ones (SRTM, ASTER, ALOS W3D30, Copernicus…) should be interpreted with highest care and take into account how the DEM was formed (InSAR, phogogrammetry) and what this means for the surface (does it include vegetation height?) and its error sources.
As a start, you could compare the openly available DEMs I mentioned above and carefully compare their date of creation, their method for creation and in the end their altitudinal differences. If these height differences, even if they do not enclose the time you are interested in, are not of sufficient for your area, l doubt that Sentinel-1 will bring you better results.
Sentinel-1 DEM differencing works best for very small areas of interest, for example glaciers or landslides: https://www.mdpi.com/2076-3417/10/17/5848
Thanks a lot for the answer and all the references you provide!
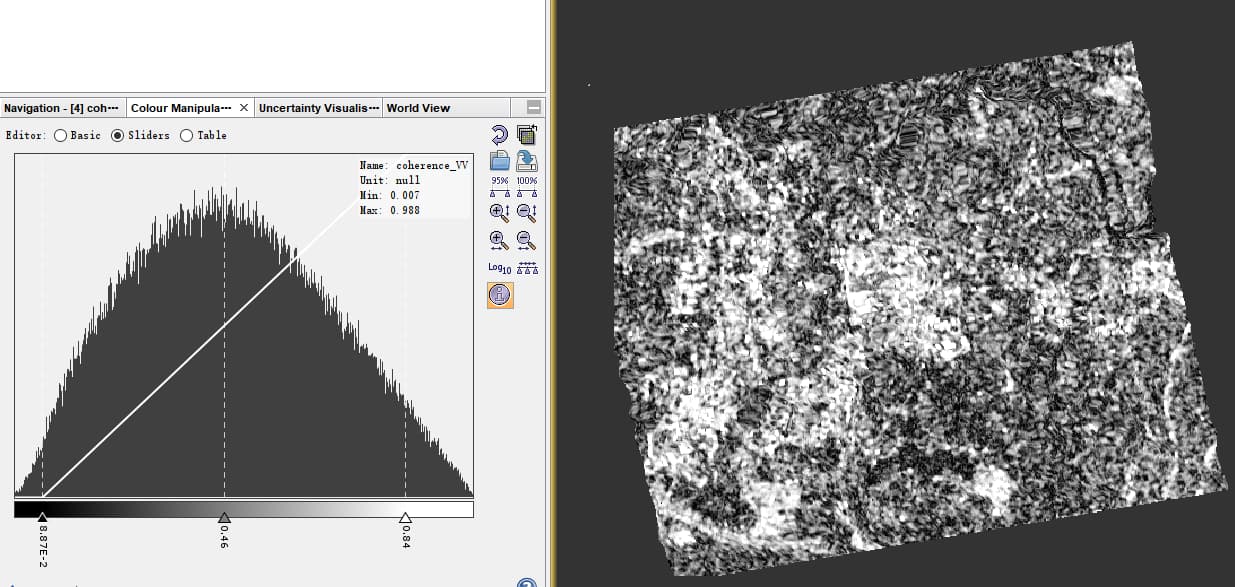
And one more question (sorry ) - the elevation generated looks twisted and pixalated in various areas, that’s mainly due to the low coherance between the data pairs?
As for a purpose like this, generating deformation consecutively throughout the years, would result from that approach be more promising?
Yes, wherever phase quality is low, unwrapping can produce weird results.
If you want to study the deformation over a long period, maybe persistent scatterer interferometry would be a more promising approach. But it uses larger amounts of data and is not fully implemented in SNAP. You can read about it here: StaMPS - Detailed instructions - #2 by ABraun
 ) - the elevation generated looks twisted and pixalated in various areas, that’s mainly due to the low coherance between the data pairs?