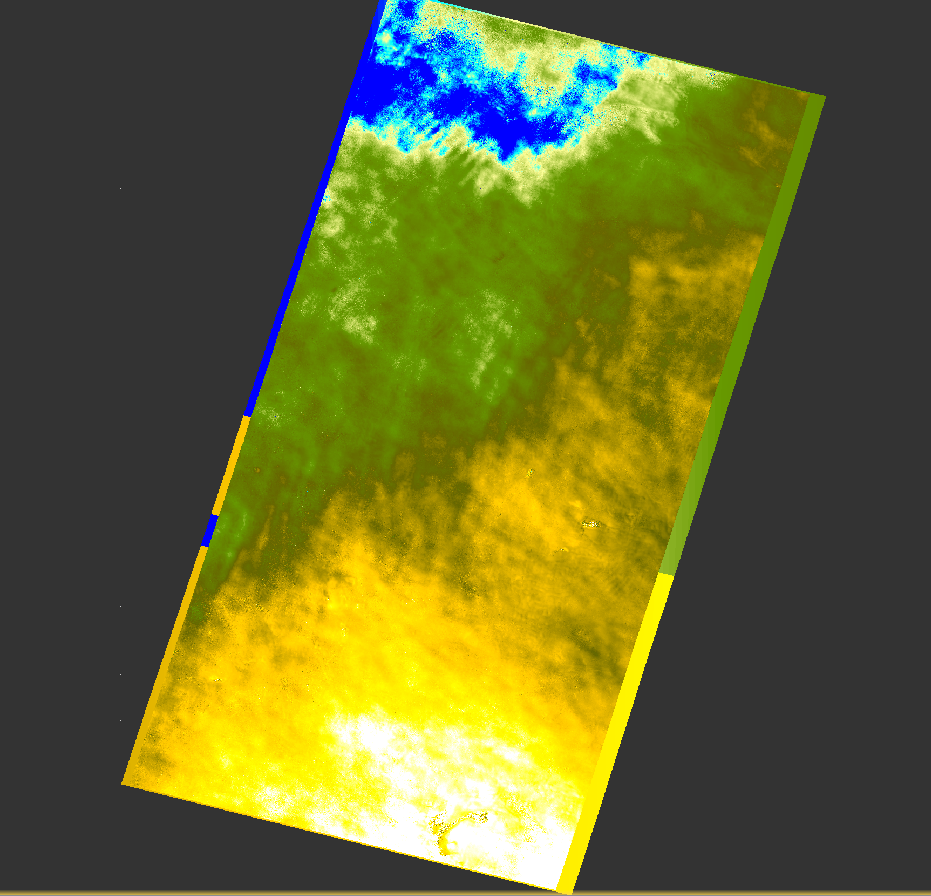
I am trying to make a series of DEMs for the area surrounding the Kalgoorlie open pit mine in Australia. However, when I create my DEM, I get some values that are almost 500 meters greater than values seen in the SRTM 3sec DEM. Additionally, I do not see relief patterns that I expected to see in the area. I have attached screenshots to better show my issue.
What is the temporal and perpendicular baseline of your image pair? The only thing you can do to improve the interferogram quality is to select suitable images: Help in DEM Generation using Sentinel-1
There are some excellent documents on the selection of suitable images for interferometry by ESA: Source Section B- 1.3 Selecting images for InSAR DEM generation.
Thank you for your feedback! I tried to use some of the helpful tips presented to others in your links, with no success. I suppose to the best for me to do is chose a more suitable satellite to use for DEM generation.
actually not the worst conditions for DEM generation.
This pair could be suitable: temporal baseline 12 days and perpendicular baseline of 150m
S1B_IW_SLC__1SDV_20180711T211721_20180711T211749_011768_015A6C_9453
S1B_IW_SLC__1SDV_20180723T211722_20180723T211750_011943_015FBF_883F
maybe even this: temporal baseline 36 days and perpendicular baseline of 181m
S1B_IW_SLC__1SDV_20170821T211717_20170821T211745_007043_00C684_C296
S1B_IW_SLC__1SDV_20170926T211718_20170926T211746_007568_00D5C6_FC98
As ERS and ENVISAT are now also freely availably from ESA, you can consider them as well, especially because there was a period when ERS-1 and ERS-2 operated in an offset of 1 day. ESA offers to search for pairs according to their baseline configuration: http://esar-ds.eo.esa.int/socat/SAR-ASA_IMS_1P/pair_search
I’ve tried a few image pairs, but I’ll try those pairs as well. And yes, I was considering switching to ALOS, but I’ll attempt to use the pairs you’ve suggested first. Thanks for all your help!