As ESA tutorials mention, we should apply debrust after interferogram step, could I apply debrust after back-geocoding and ESD step, before interferogram step? So that I can save time for the other debrust for InSAR stack if I want to prepare StaMPS output.
Another thing is that if I only use 1 brust of the Sentinel-1 image, I think it is not necessary to apply S-1 ESD, is it corrected?
Personally, I see no problem applying deburst before interferogram formation.
However, if strong azimuthal displacement occurred, you will have phase jumps between bursts. Nothing critical but if you apply Goldstein phase filtering, the phase jumps will pollute the filtering, since now bursts are joined.
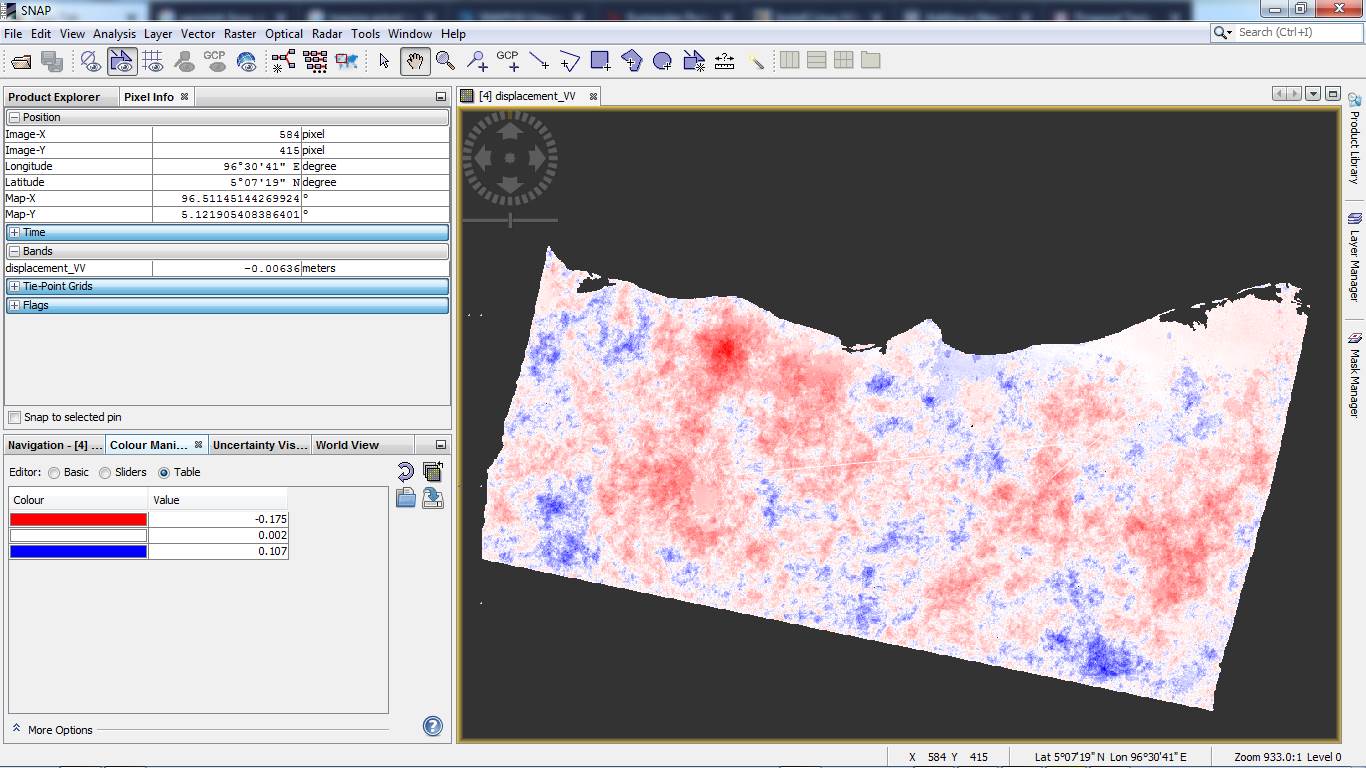
I am confused with this result. Is this a LOS displacement and deformation, but why is the deformation like this. So many deformation. Is this caused by atmospheric and vegetation?
How to input atmospheric and vegetation correction to SNAP?
Please your teachings, it is for my post-graduated thesis
SNAP doesn’t intergrate atmospheric effects. To be able to detect them, you need a stack of multiple interferograms, otherwise you cannot be sure what is caused by actual topography/displacement and what by unwrapping errors or atmosphere.
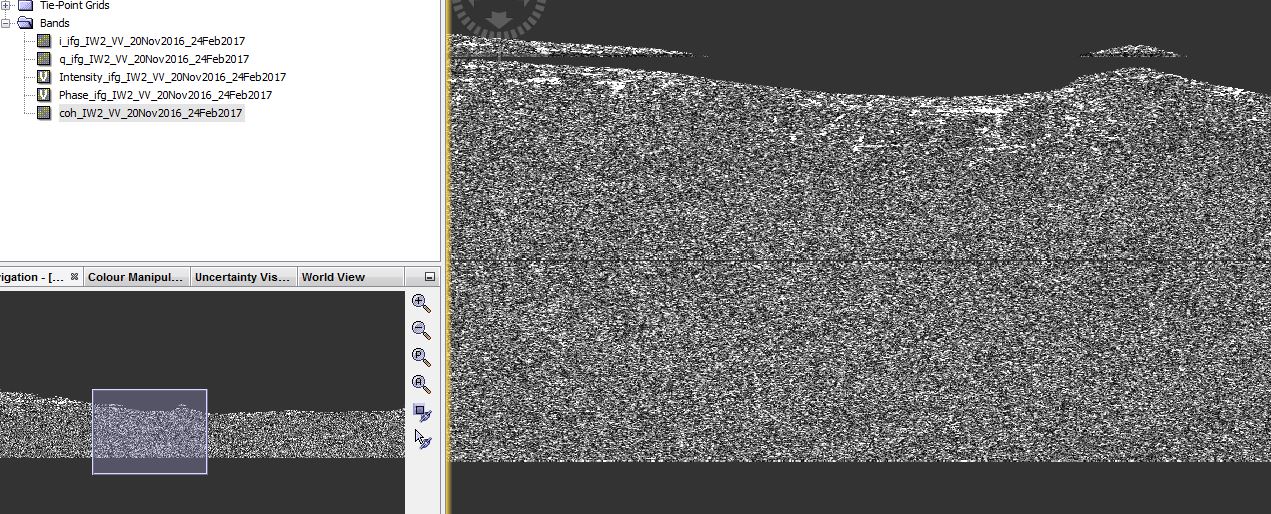
Did you have a look at the original interferogram and coherence? These often give you insights on which areas are reliable to use.
Similar is for vegetation. You can create a vegetation mask by optical data (NDVI, for example) or mask out low coherence areas to reduce uncertainties. But if coherence is too low over large areas, unwrapping errors can easily add up.
Your coherence doesn’t seem very high. I doubt that the observed displacement patterns result from usable phase information. Have you tried masking out values below 0.3 and see what is left? (see the approach here: Subsidence map in 3d view - #19 by ABraun)
Do you have much vegetation in your study area? Maybe you should also look for a shorter temporal baseline:
just switch to the color manipulation tab to see the value range of your colors.
Alternatively, use the pixel info tab at the top and move your mouse over the image.
Visually masking out low coherence pixels in your interferogram is explained here and here.
hi @ABraun, thanks , I have seen my coherence, and coherence with value 0.4 up are too little, almost all the image are 0,0… how is it?
and I still dont understand this " Visually masking out low coherence pixels in your interferogram"
Sorry, thank you very much
please read the posts I linked to above regarding temporal decorrelation and the valid-pixel expression. It is explained in the links I provided above.
I see from your image posts that you are trying to do InSAR on Sumatra, which is a heavily vegetated tropical island. It also seems that your interferogram interval is three months. With the Sentinel-1 radar (C-band), you can’t expect to make any useful InSAR measurements unless you use very short time intervals. This explains why the coherence values are all very small, except for some areas along the coast that have been cleared. When the coherence is very low, the InSAR measurement is pure noise with no valid signal.
As @ABraun suggested, you should read about temporal decorrelation (loss of coherence).