Ok…thanks for your helpfull answers…
I will try it.

hi!
i have a question that might be late to asked.
its HOW TO DETERMINE MASTER AND SLAVE?
for example, these date, January 2016 and february 2016
which one should be master and which one should be slave
actually i used to the earlier date as the master and the latest one as the slave, but i just got a case as i just tried too. here
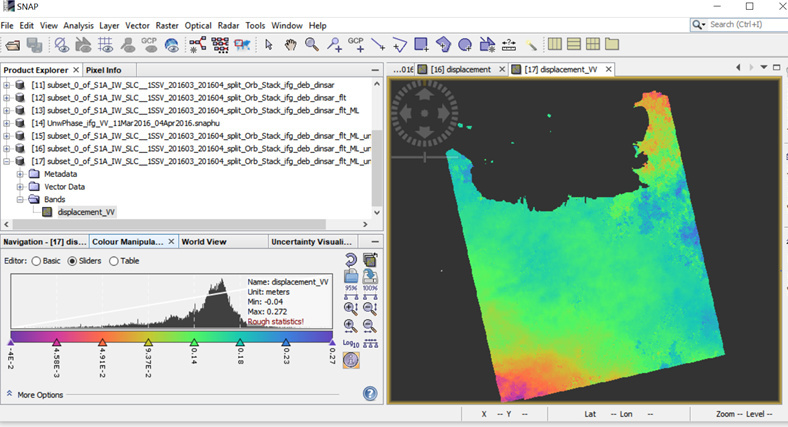
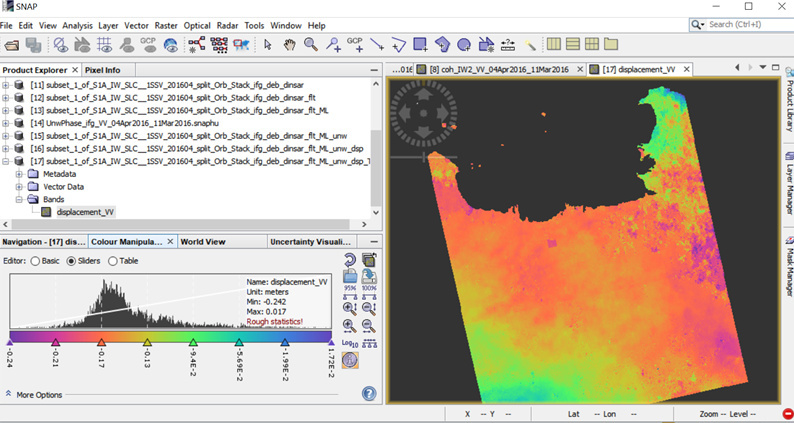
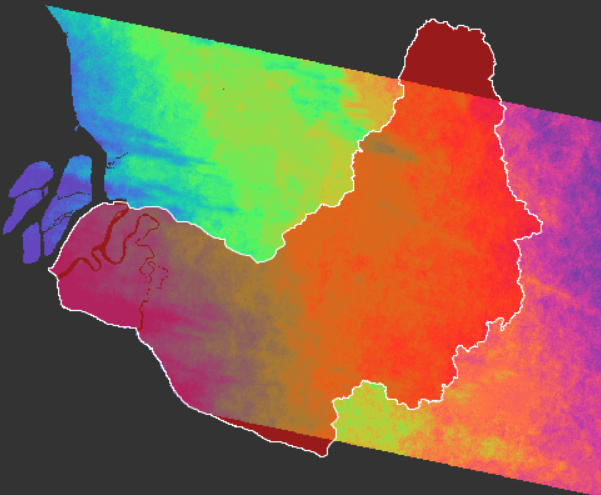
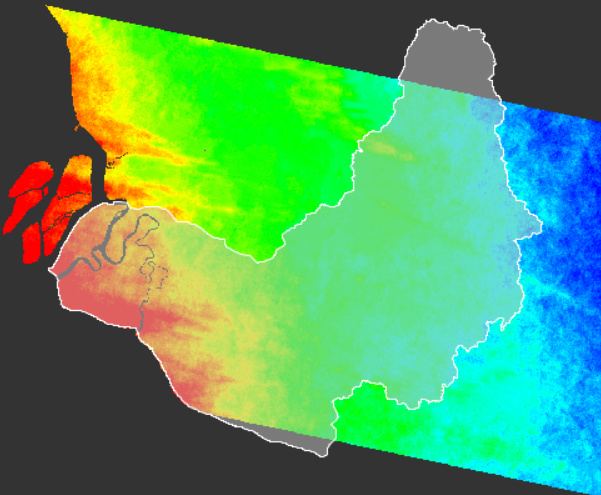
first image, i used as usually which is early date as master and latest date as slave. second image i did reverse, which is early date as slave and latest date as master.
thank you
ohya addtional, this land is used to subsidence.
first image showed dominant uplift. otherwise second image showed dominant subsidence (which is it relevant as the condition land)
so i got confuse by this. hopefully gotta answer soon
thank you
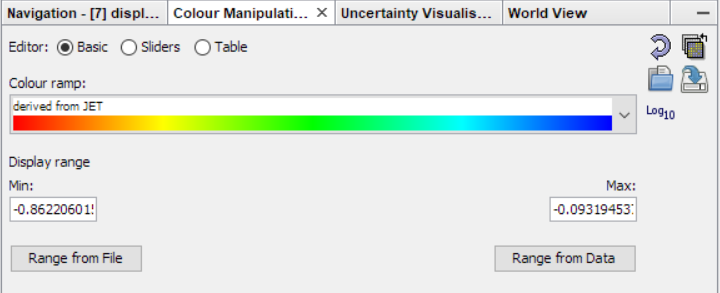
You see in the results that it doesn’t matter. Both the image and the histogram are their respective opposites. In one case the displacement of an area is +5, in the other one it is -5.
alright, but the numbers of displacement are difference, as u can see in the left below the images.
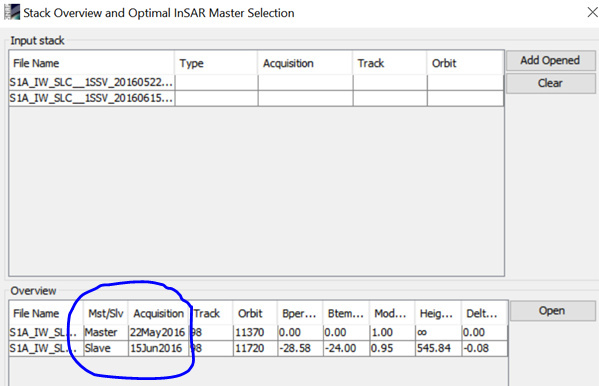
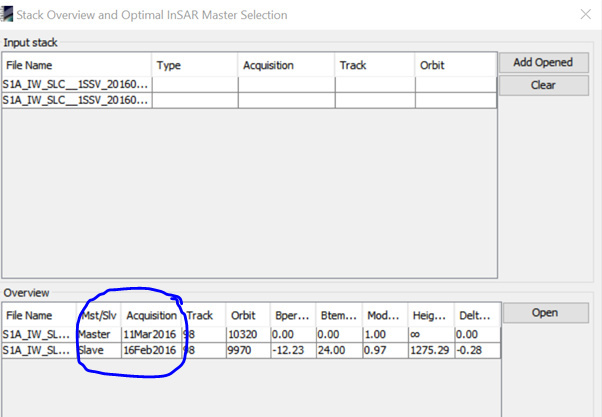
btw, do you chose master or slave by “stack overview” said ?
alright, but the numbers of displacement are difference, as u can see in the left below the images.
I don’t think so. The peak of both rasters is roughly at 0.16 and -0.16
Did you understand that DInSAR measures the relative displacement between both images? Comparing A to B, an area might have negative values but comparing B to A the value is positive.
The image which is top most at the coregistration image list defines your master.
right, now i see those are same. then, how i know it showed subsidence if example i use the first one?
negative values mean movement of the surface away from the sensor (anong the line of sight), positive values mean movement towards the sensor respectively. It is always relative to the master image.
You should really have a look at the existing topics, many things are well explained there:
Ok. Thank you for your information and answers
Dear, sir.
I want to ask you about university/institute through master degree for remote sensing geohazard. Do you have any recommendations, I would like to study more and deep about this field.
Thank you
Sincerely
Cyntia
I am doing a offset tracking on Siachen & Gangotri Glacier it is successfully processing but the end i get result whole image as red.
I Am using Sentinal 1 Grd with 12 days gap file for generating displacement map ?
Any step for correcting this error?
was your coregistration successful? Can you visually see some changes in the images which indicade movement? The module needs some patterns which are found in both images but have changed their position.
You can always test different window sizes and parameters, every case is different. Also, masking the area of change often helps to narrow reasonable results down to a smaller area.
yes my co-registration was successful and yes i can visually identify the movement. But i tried also on 2 different windows size but same type result i am getting red image
When i tried using SLC product offset tracking was not working giving error that cannot find amplitude& Intensity band.
Guys, please advice.
I am trying to get a subsidence information within a basin area. Given my Basin study area with Wrapped-, Unwrapped-phase and Displacement (uncalibrated) of S1 Multi-looked IFgram from Dec2014/Dec2018 pair.
Mask of coherence gt 0.2 during filtering. How can i tell that i am getting the right output? What i meant is, should we get a high displacement where there are lots of fringes on an area (right above the basin boundary)?
the patterns in your interferogram and the ramp in your displacement indicates that your result is not reliable at all. It is just randomly aggregated phase noise. The fringes should at least be connected over the area you want to observe.
This is most probably because you use images from 2014 and 2018, which is a way too long time for differential InSAR, because your signal is completely decorrelated.
These things are well discussed in here, you might have a look: Some explanations about concepts of fringes of interferogram and coherence
High coherence does not indicate high displacement, it simply is a measure on where your signal can be used for displacement mapping. But this only works if the area of interest has connected areas of higher coherence because otherwise unwrapping errors occur and produce a trend as seen in your result.
Is your study area covered by vegetation? This is one of the major reasons for decorrelation. I would suggest using image pairs with smaller temporal baselines but if there is much vegetation, you cannot do much about it at all.
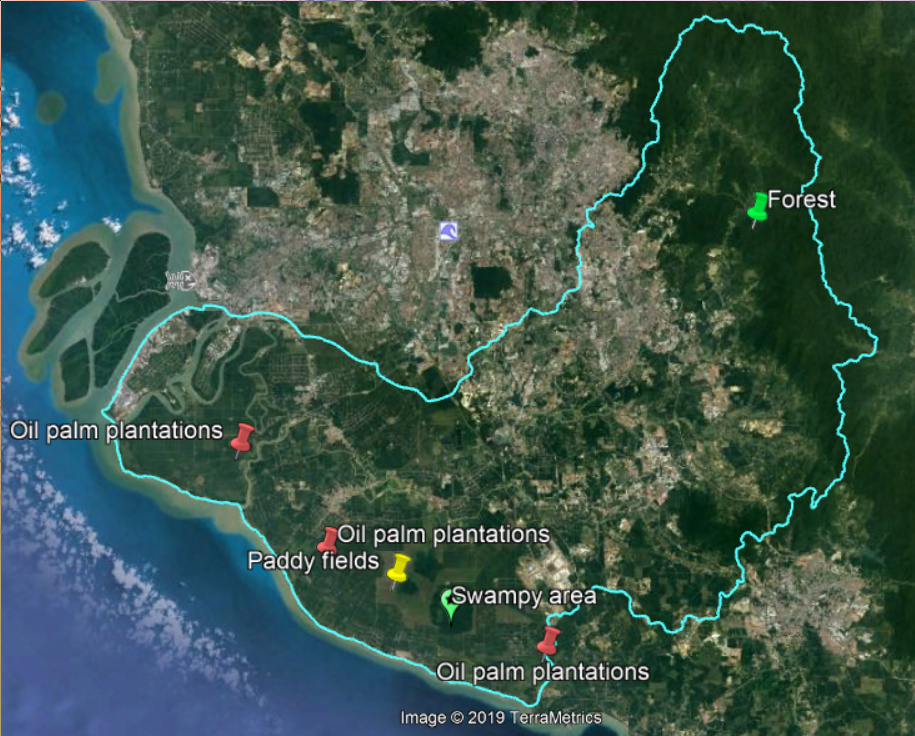
SW: large oil palm area + paddy fields + swampy area
Centre: urban area
NE: forested area of the main range mountains
I will try smaller baselines: 12/6/3 months or shorter
Thinking of PSI method but can my 24gb ram, 24.ghz pc handle it? i am also very new to this. Trying to finish my masters prog due Feb 2020. Still running thru the posts in the forum. Lots of info. Thanks
too much forest for traditional DInSAR, I’m afraid. You supervisor should have mentioned this in my opinion.
24 GB RAM is not bad, PS InSAR should work if you prepare a subset using SNAP2StaMPS
1 Like
Dear all,
what do you think about the idea to use DInSar to detect vertical displacement of gravel-bed rivers due to flood events?
The question is deliberately generic so you can express your own view  !
!
Thanks
Daniele
Dear all,
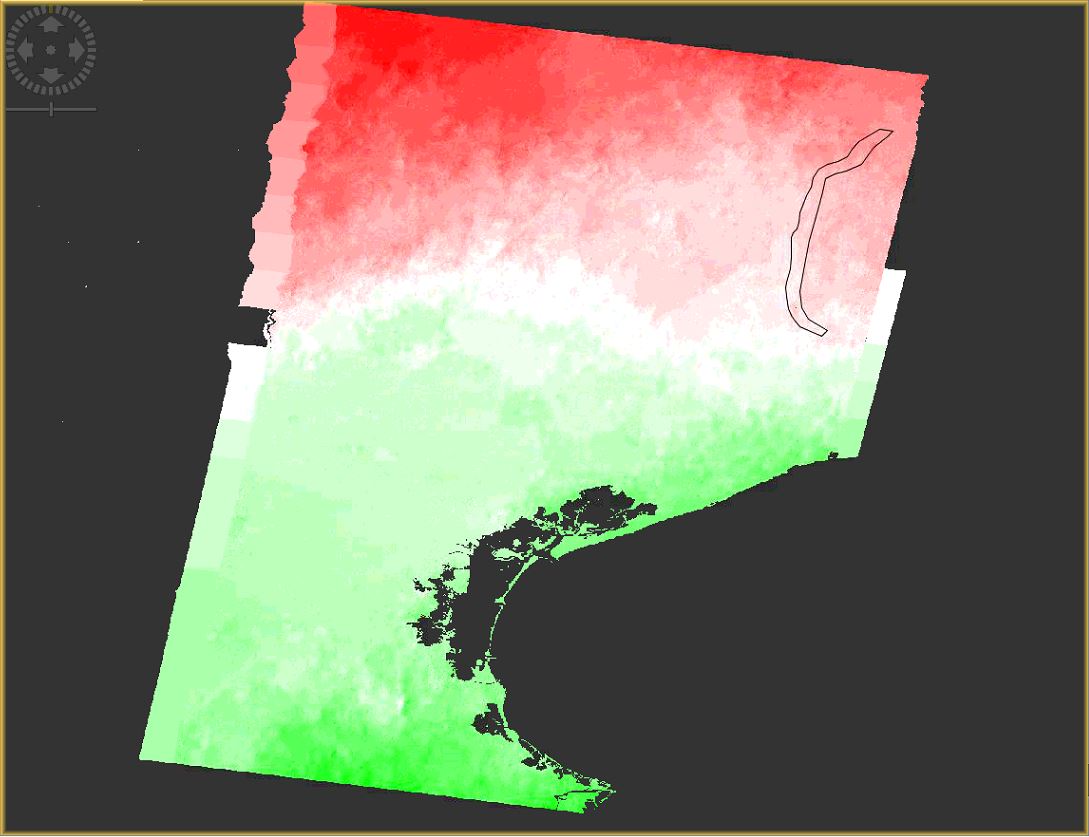
I’ve followed the entire process to get the displacement recorded between two images (17th August - 10th September) in the area of Nord-East of Italy, and I’ve obtained the same type of results gained from @chronomanz.
I completely agree with @ABraun when he says that the presence of forest compromises the results. So, how can I evaluate reliable displacement only of the gravel bed of the river surrounded by the black line?
Thank you in advance for the suggestions