Dear All,
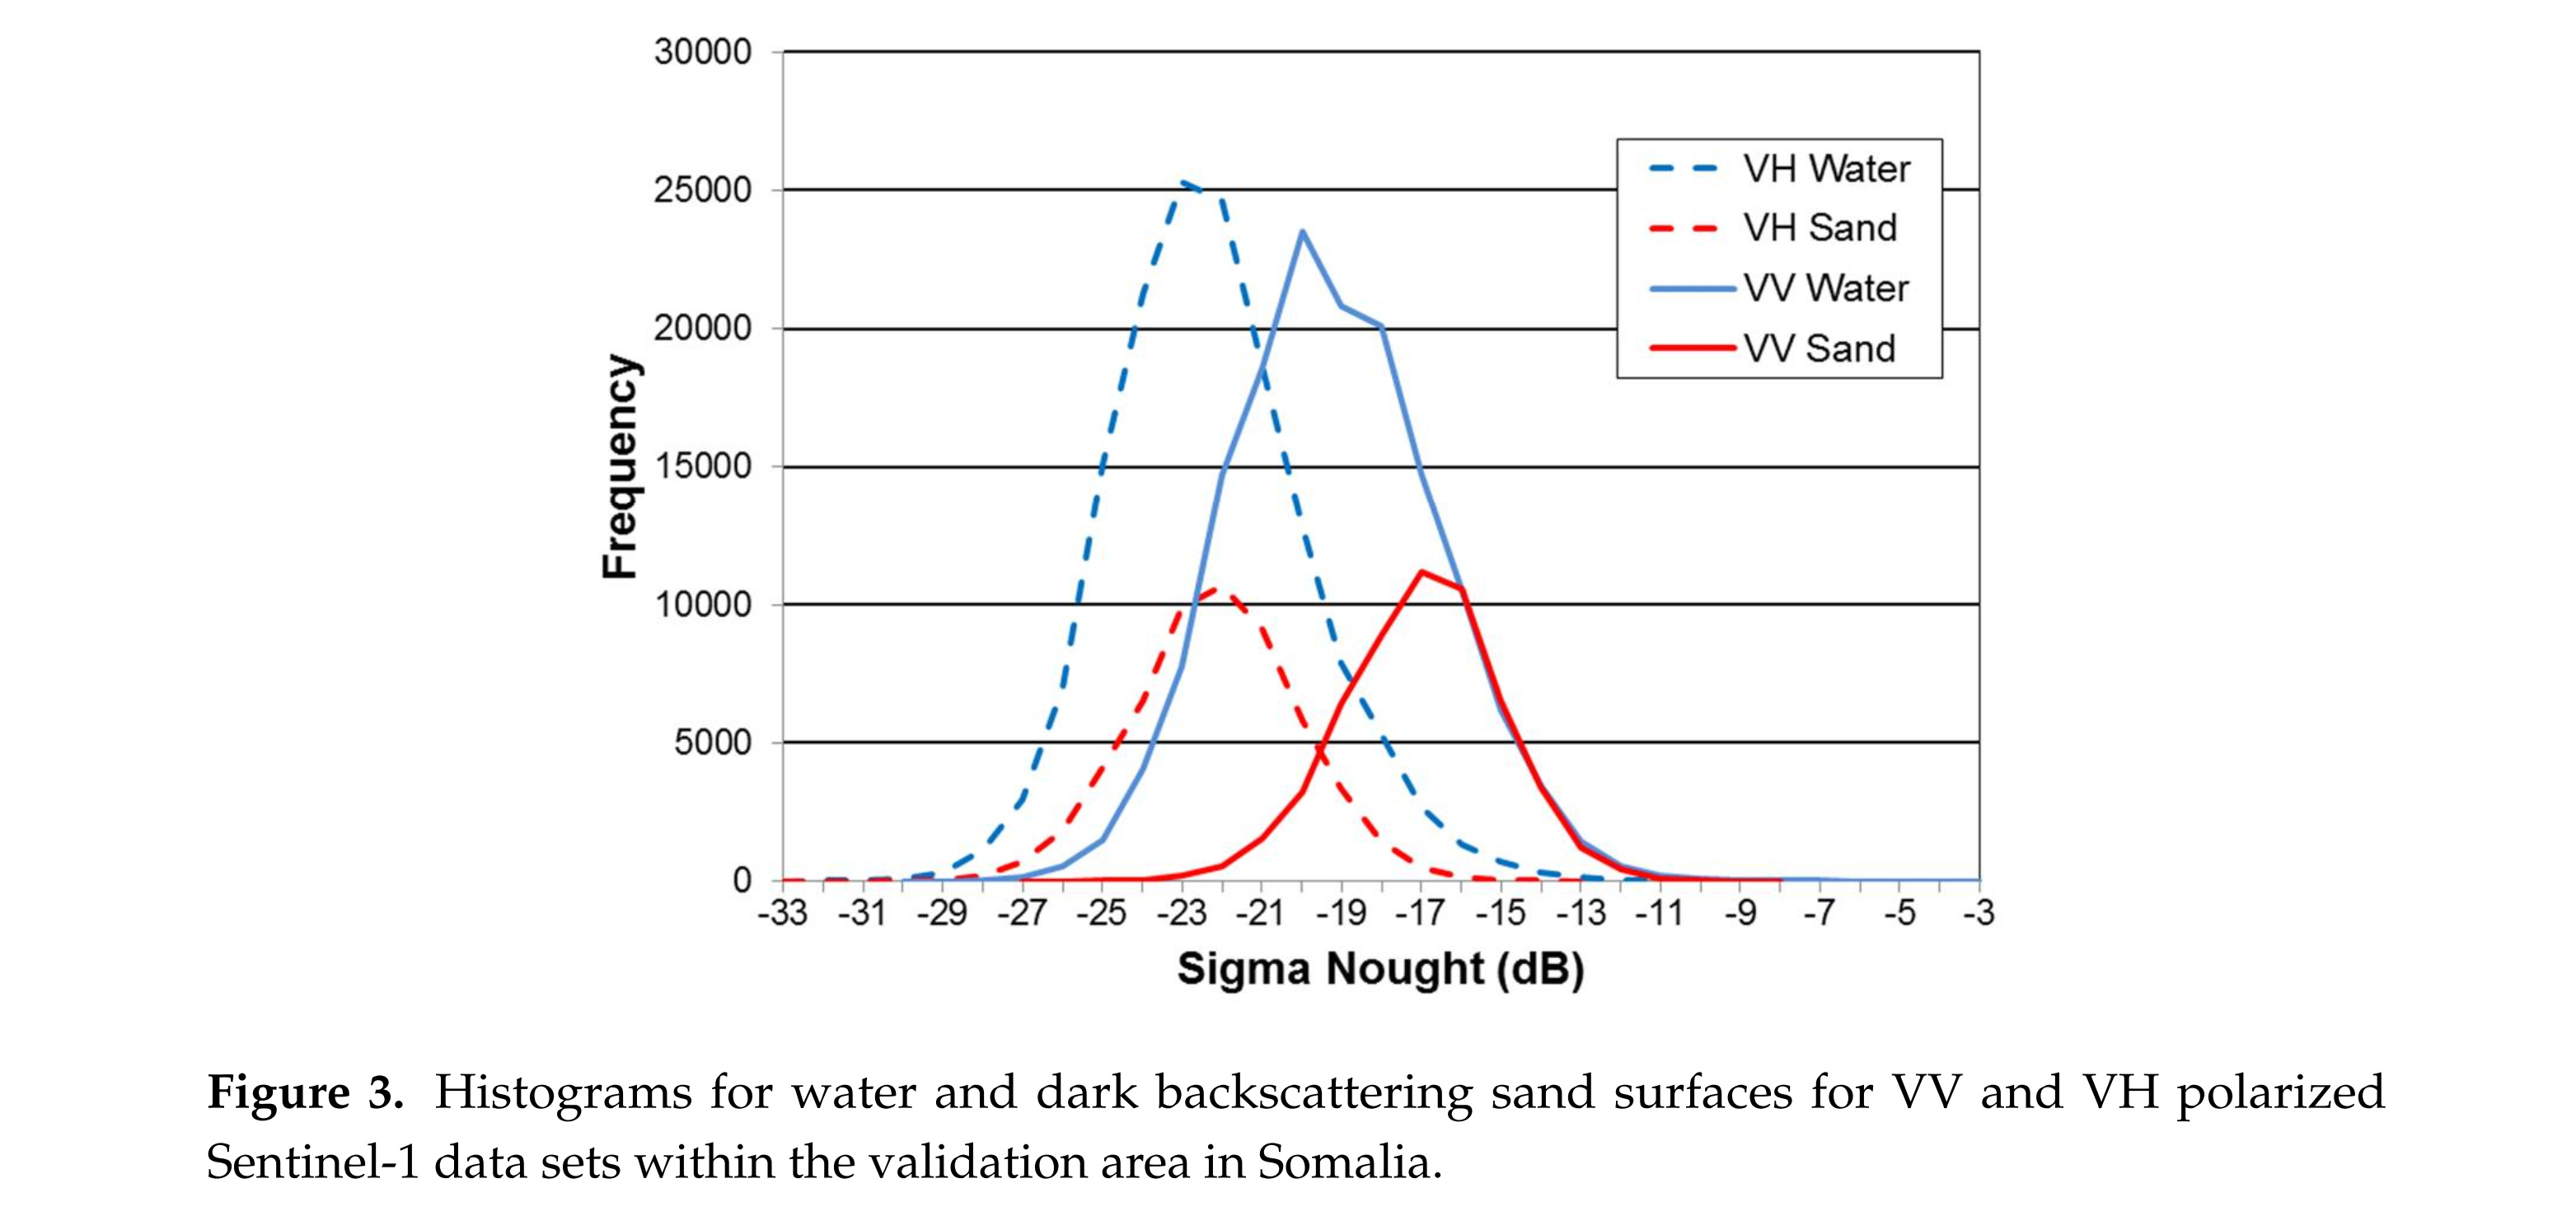
How can I draw a figure like the attched in SNAP or any other software. the used SAR in this figure is Sentinel1A GRD.
Dear All,
How can I draw a figure like the attched in SNAP or any other software. the used SAR in this figure is Sentinel1A GRD.
A similar issue was lately asked here: View multiple classes (ROIs) in same feature space?
The histogram tool cannot display ROIs of different bands or classes at the moment.
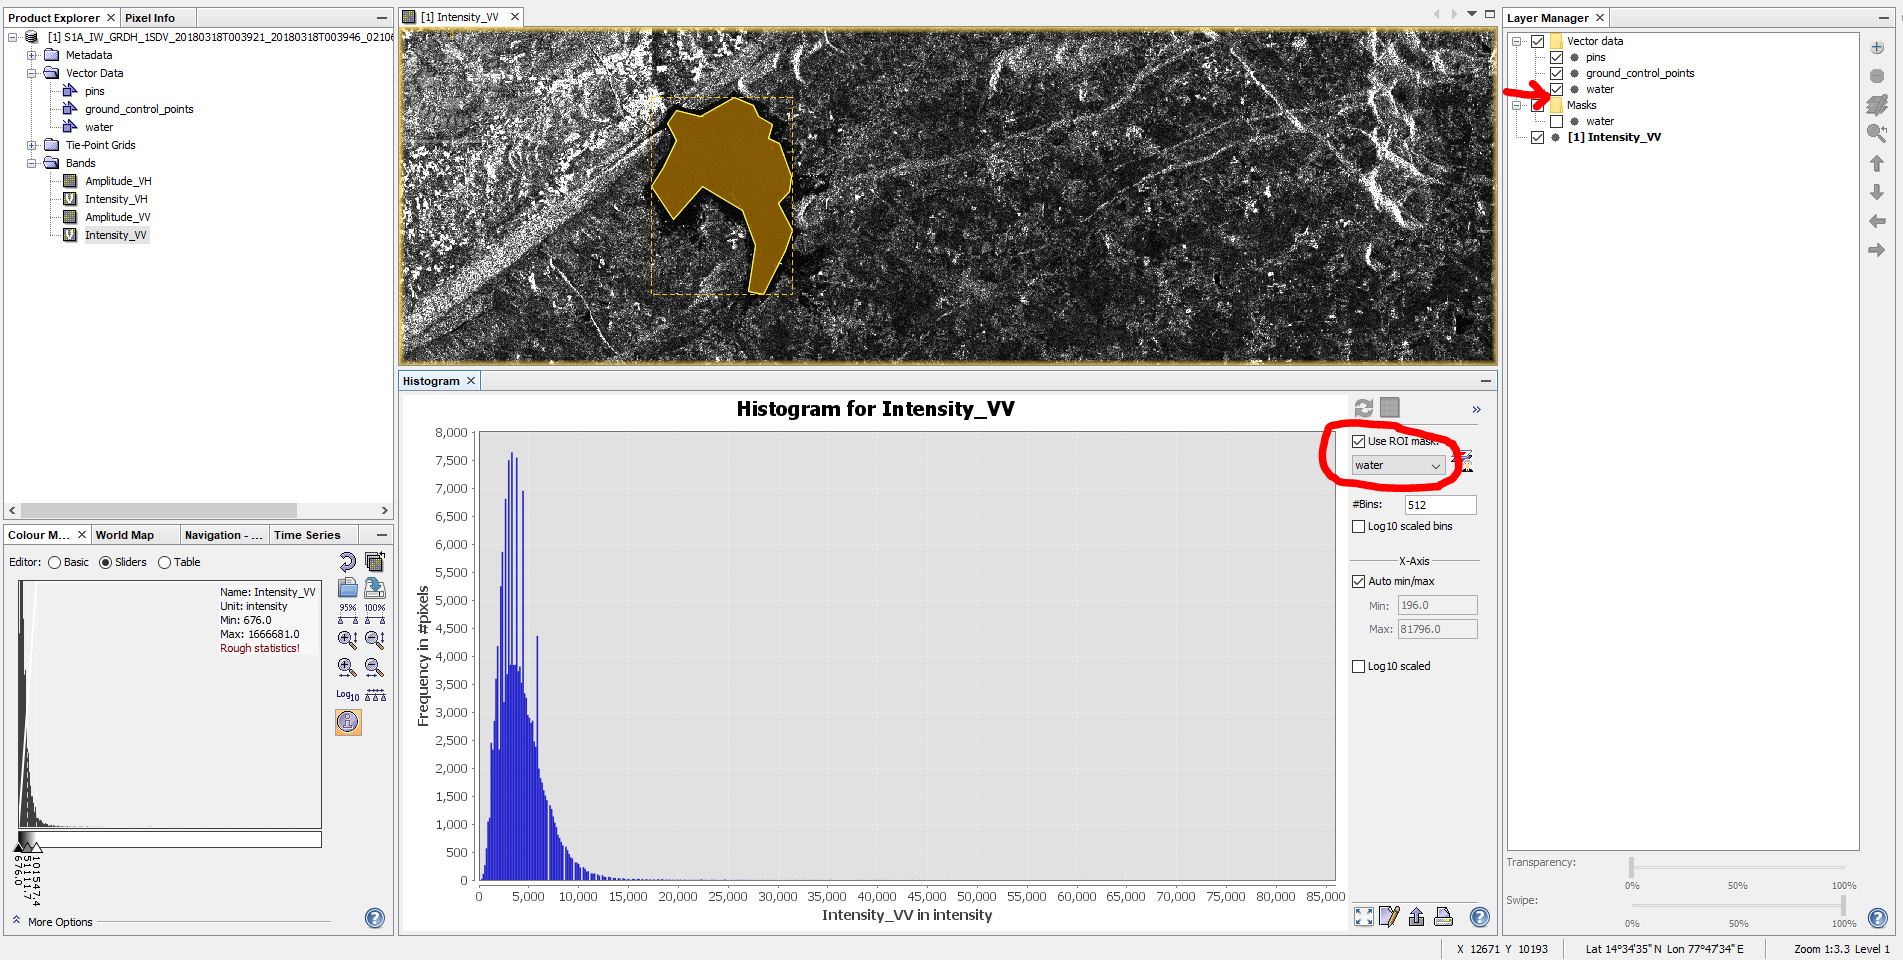
If you want to highlight only one area of interest you create a vector geometry and limit the histogram to this area:
Thank you very much. For creating vector geometry, should I use Vector/New Vector data container or use on of the drawing tools.
if you want to digitize several vectors of different classes, you first create them as containers and then digitize the corresponding classes using the drawing tools as described here: Drawing vectors
Thank you very much.
Hello, which function from snappy is used to plot histogram of SAR imagery?
Creating histograms is not yet available as an API. It is currently only possible via the GUI.
But you can load the data and use the powerful functionalities of Python to create the histogram.