Iran is one of the best places for the application of InSAR to earthquakes, because most of it is arid so the coherence is good. You don’t need 3-D deformation to make a slip model for an earthquake, but it helps.
@EJFielding Yes exactly, especially land subsidence caused by underground water exploitation. That’s great, I thought that the 3-D deformation is essential to make a slip model. So, I can go ahead and at the same time, try to make the 3-D deformation 
I need to find some innovations through these experiments.
Pay attention that what you see there is the vectorial grid surimposed on your raster results. You can uncheck the box “vector data” in your layer manager tab (on right panel). Here, we cannot see anything because of that.
@mengdahl, do you thing it’s possible to deactivate the default surimposed vector layer? It often makes the visualization very slow responding.
1 Like
I just want to put the attention on this article which introduces a quite impressive pixel-offset method (not mine) : PO-SBAS
the PO-SBAS measurements have been validated, leading to an estimated accuracy on the order of 1/30th of a pixel in both range and azimuth directions.
Thank you so much for your hint. I already found that I was wrong in showing the result and I need to turn off “vector data” in layer manager tab. I applied this tool for my study area and found the unreasonable result as follows:
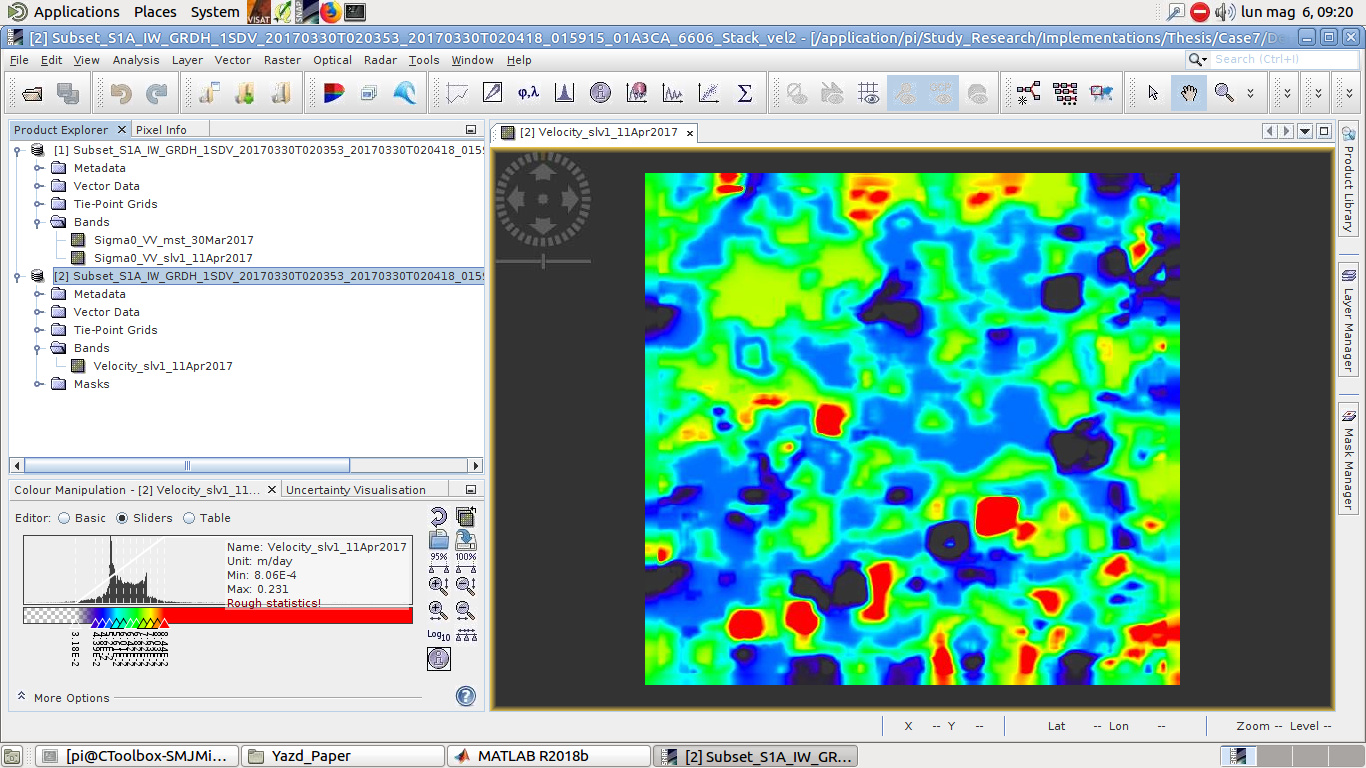
It doesn’t have a pattern like InSAR result. Based on the nice information from Prof. Fielding, I think the spatial resolution of used dataset has a very essential relation with the value of displacement in the area. So, we need to pay attention that to get the result.
Pixel-Offset, as implemented in SNAP, requires an extreme attention in selecting pairs, and also requires lots of parameters tuning / post-processing, with an achievable accuracy a bit meh. I am not surprised it doesn’t work for abrupt events but thank you for sharing.
In my experience, it is still quite useful for glacier monitoring
Pixel Offset can work for Earthquake and literature showed examples where results are achievable. However, I am a bit skeptical about Pixel Offset in SNAP for Earthquake monitoring.
@qglaude Thanks for the link to the Casu et al. (2011) article. They obtain higher accuracy for the pixel offset measurements by doing a whole time series of pixel offsets and applying some spatial and temporal smoothing. As they say on page 2754:
we compute (for each investigated pixel) an estimation of the range and azimuth shifts, finally leading to offset maps for each data pair with accuracies that are commonly on the order of 1/10th–1/20th of a pixel [30], [31].
The accuracy of offsets calculated from a single SAR image pair is less accurate than the estimate from the PO-SBAS time-series.
1 Like
@EJFielding Thanks for the clarification 
In addition, I need to tell you that we can have the displacement in vertical and east-west directions using InSAR. So, we need to provide the displacement only in north-south direction using offset method. If you see Offset-Tracking in SNAP, It works in both azimuth and range directions.
It is not related to this topic but I would like to say that I am enjoying in this discussion and I see the great experiences of Dr. Fielding and also other nice guys through the statements. It helps me to how I can improve myself
2 Likes
I was interested in checking the atmospheric condition in this study area. So, I got the atmospheric results from GACOS, http://ceg-research.ncl.ac.uk/v2/gacos/, and made a plot from them as follows but I am wondering. I used the atmospheric delay for 2017.03.24 and 2017.04.05 and made a different between them, which was resulted in 4 to 6 cm Atm. error. Is it possible?!
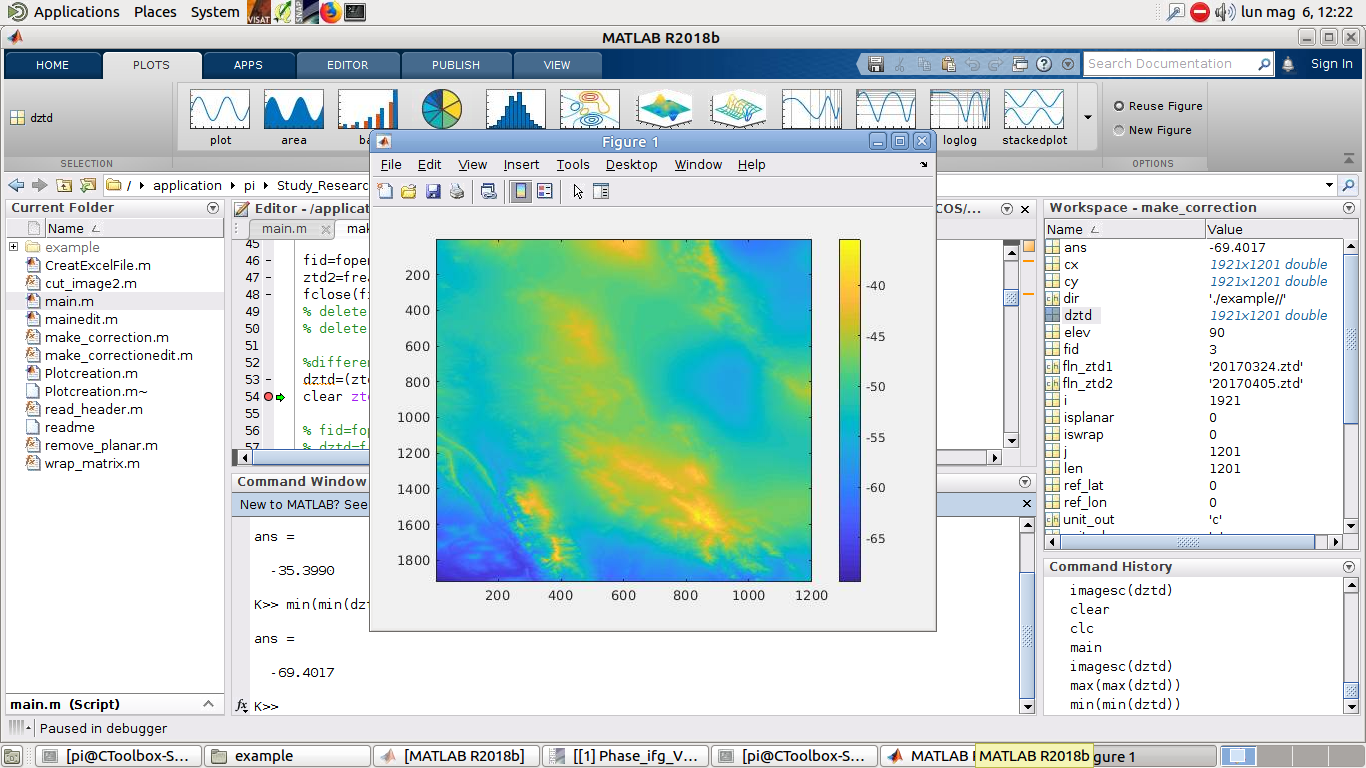
Have you ever used the GACOS files to do the atmospheric correction?
Yes, it is possible and even likely to have 4 to 6 cm of atmospheric error due to tropospheric water vapor variations, especially where you have significant topographic relief. The atmospheric corrections from GACOS and other methods are most effective for the part of the water vapor variations that are correlated with topography, as in the southwest area of your image.
Note that the important part of the atmospheric correction (difference between the two dates) is the change across the scene, not the absolute value. Since your differences are all between 4 and 6 cm, the relative correction is only about 2 cm. InSAR is always a relative measurement.
2 Likes
I’m so sorry for my misunderstanding. Do you mean that I need to define the reference area to get the relative correction and then, apply on my results after unwrapping?
It does not really matter whether you subtract the reference area value from the correction before you apply it to the interferogram or from the interferogram after you apply the correction. The results should be the same.
I got it very well. Like Mean LOS Velocity derived by InSAR, I need to convert the GACOS results to absolute values in terms of the reference area and then use or …
Thank you so much for the great hint
Whenever we don’t have any evidence or ground observations such as GPS or leveling, we should consider some hypothesis for the reference area. For example, in studies about subsidence monitoring caused by underground water exploitation, we can consider the mountains or like this as the reference area.
What about the earthquake application? Could you please share your knowledge with me?
here you can find a manual of deformation models by Maurizio Battaglia, Peter F. Cervelli, and Jessica R. Murray (USGS)
https://pubs.er.usgs.gov/publication/tm13B1
cheers
Federico
@FeDiT1982 Thank you so much for your nice document
Excuse me, regarding the GACOS atmospheric delay files, I generated the following plot for my study area. I am worried about the pattern of these atmospheric error maps. They were set in terms of the reference area but I think they should have the same pattern but as you can see, they are very different 
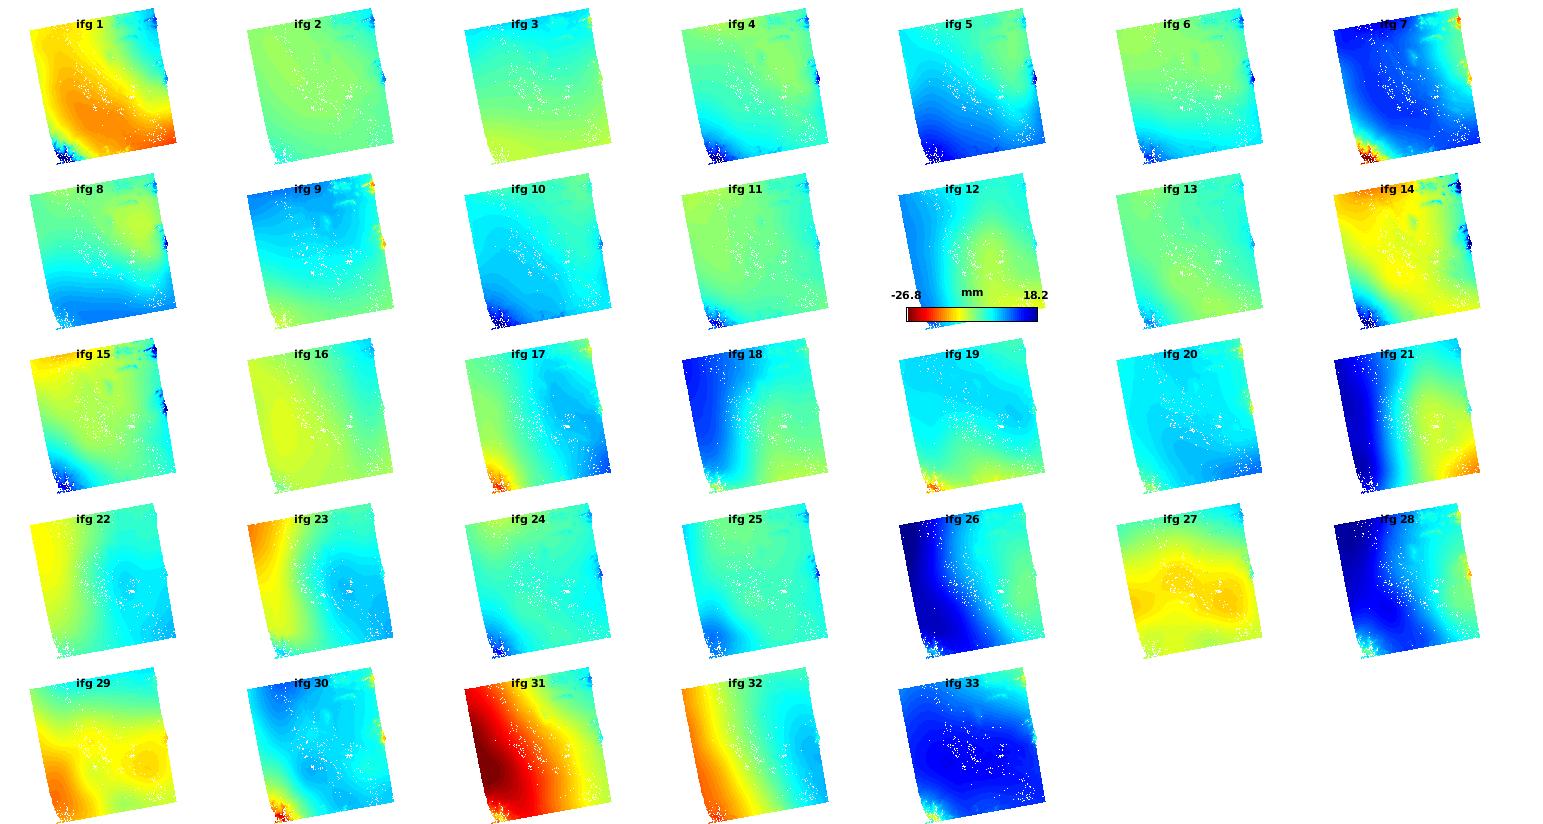
Could you please let me know your idea?
I don’t think that they should have the same pattern, because the atmosphere rapidly changes over your study area and these maps represent an approximation about the extent of this disturbance to the time of the image’s acquisition.