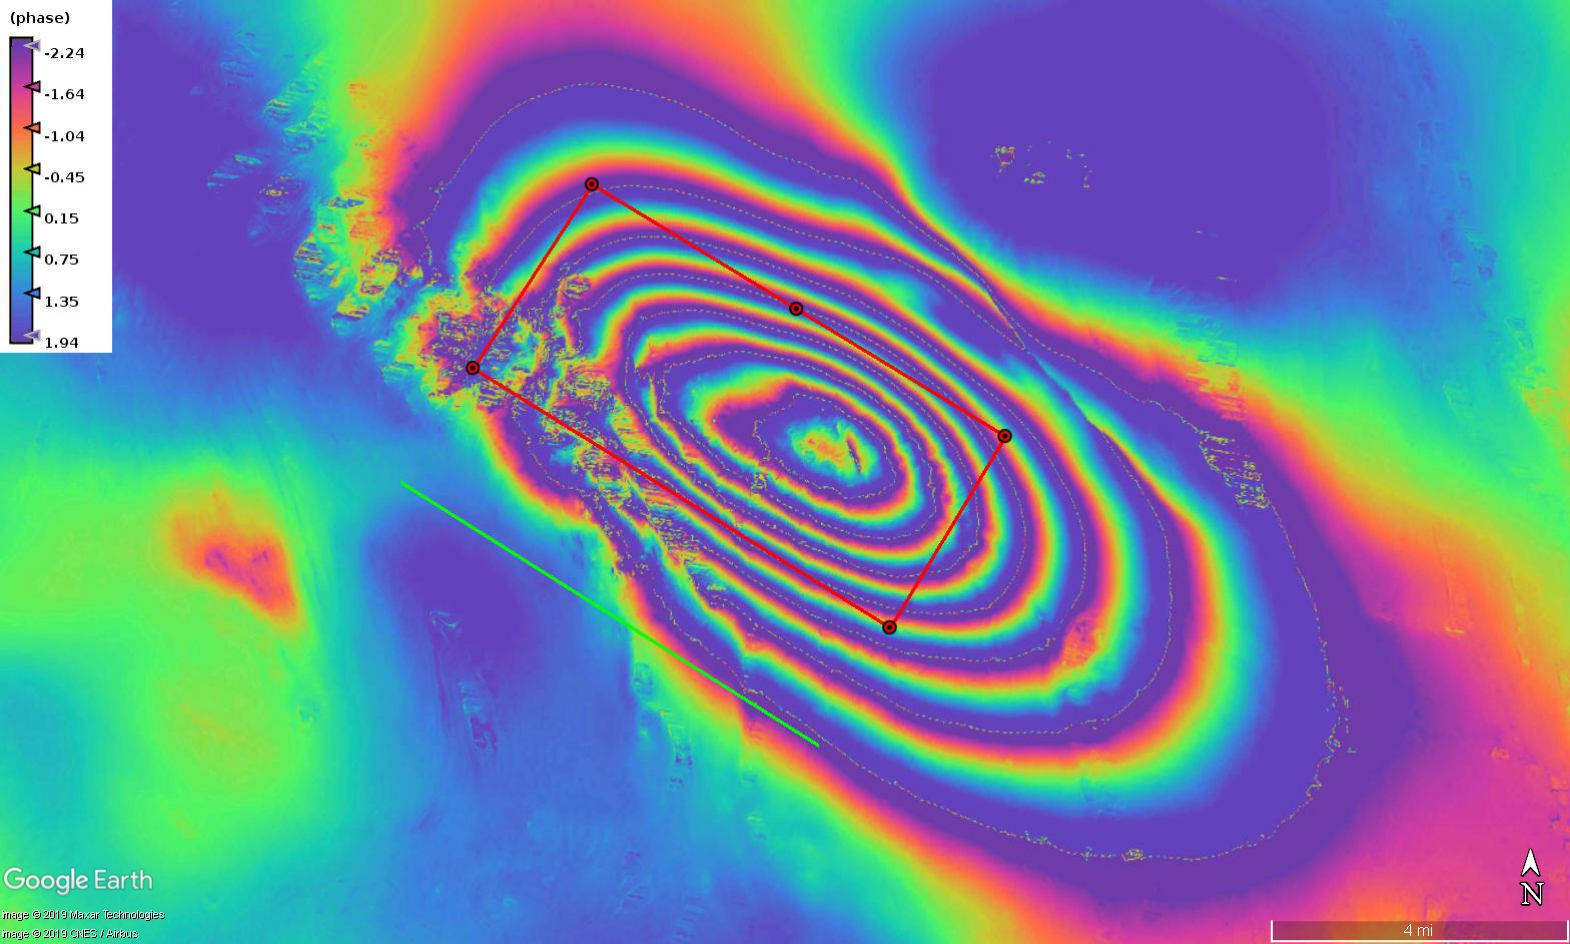
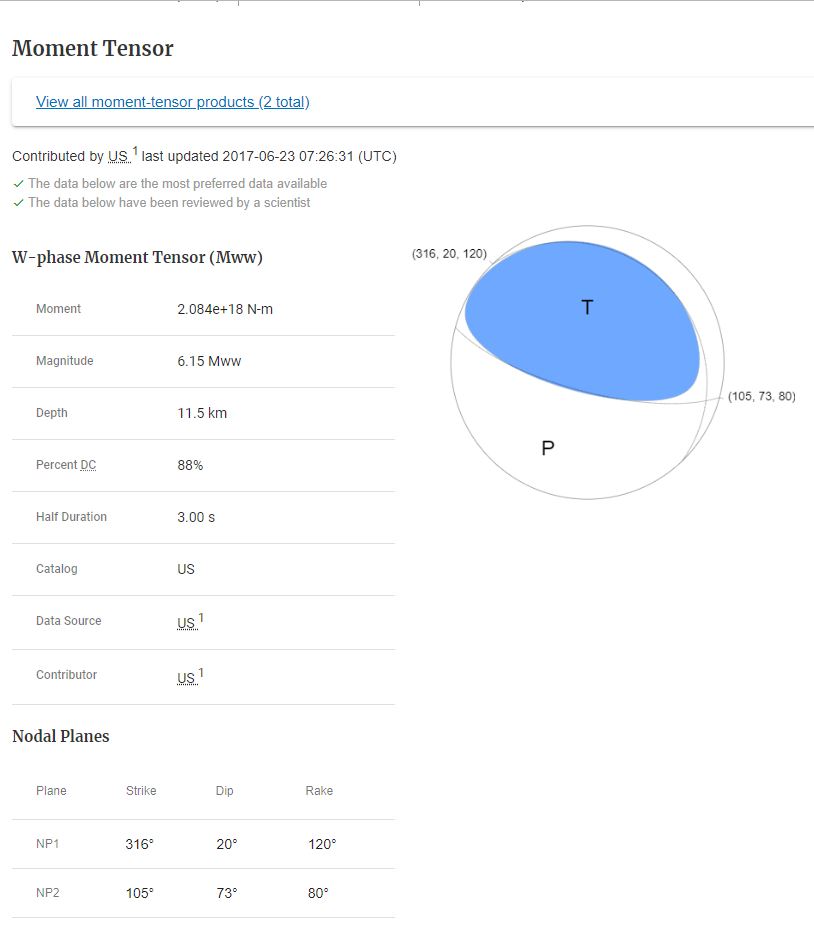
I read this document (https://www.ocean.washington.edu/courses/oc410/reading/Focal_mechanism_primer.pdf) and found some good information about the parameters. Based on what is expressed in page 6 and also the values of Rake parameter, reported by USGS (the following picture), the fault type is the pure Reverse-Slip without any Strike-Slip element. Do you confirm my view?!
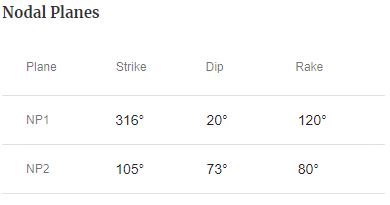
A pure reverse-slip mechanism would have a rake of 90°. This mechanism has NP1 rake that is 19° different from 90° and NP2 rake that is 18° different from 90°, so there is some minor strike-slip motion for either nodal plane. You could assume pure reverse slip as a first approximation.
The dip direction is determined by the strike direction. If you look along the fault in the strike direction, then the fault plane is dipping to the right. It seems very likely that your fault plane is dipping to the north, so the 320° strike would be the most likely of the two nodal planes.
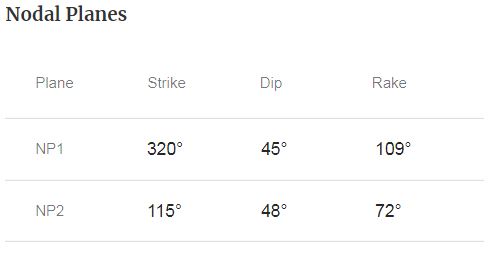
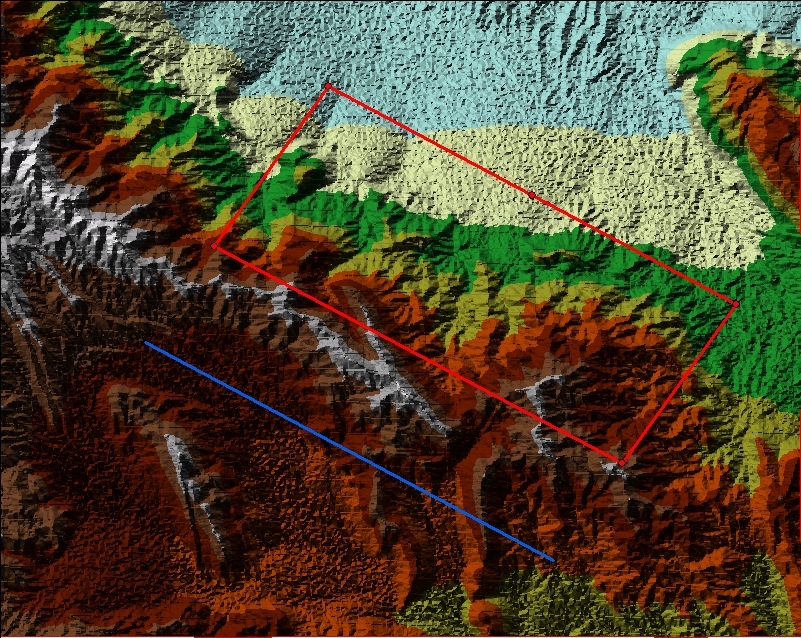
@EJFielding Sorry to disturb you, I tried to project the fault plane on the surface and also the fault trace in google earth, which you can see in the following:
I am worried about the location of the fault trace I drew with a straight black line. As you can see, I have some complexities in the black polygon in this figure but the fault trace is far away that area. Could you please guide me about It can be correct? To calculate the location of the trace line along the fault plane at the cut-off the surface, I used the 90-dip angle and depth value, derived by displacement modeling.
The fringes due to the earthquake deformation extend further southwest of the area of surface disruption. This suggests that your fault plane projection is correct because it is at the edge of the fringe pattern. There could be a secondary fault or fault curvature that caused some shallow deformation in the area of disrupted fringes.
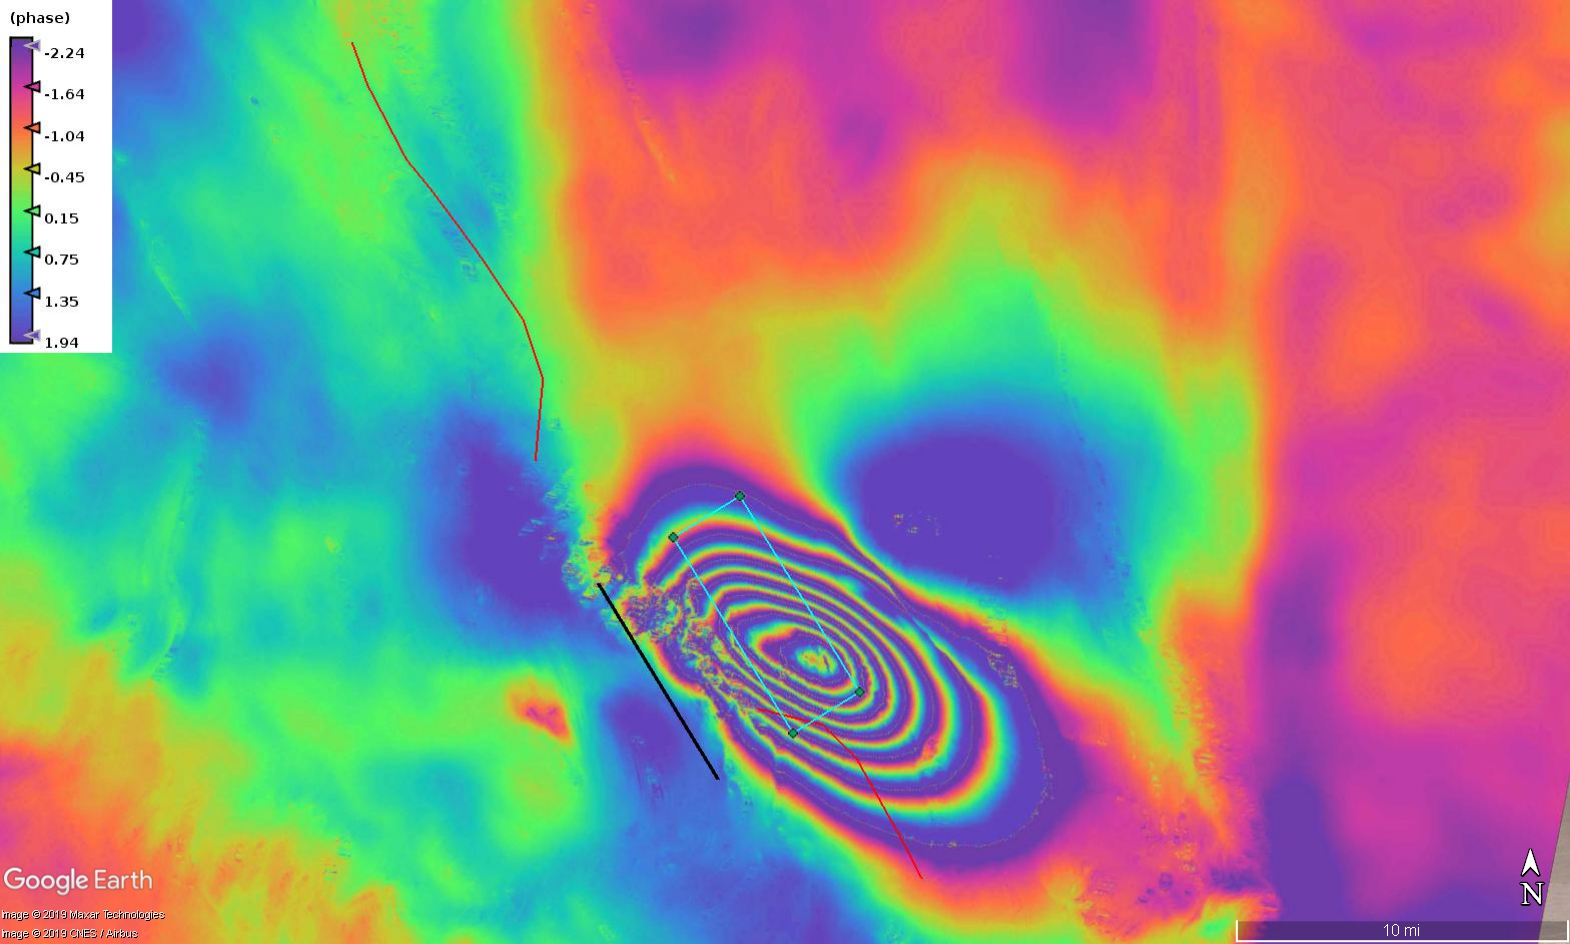
@EJFielding Thank you so much for your kindness and nice information. So, based on what you said and the following figure, we can say we have one or two faults (red lines) as receivers and one secondary fault as a source fault (black line) to check and calculate the stress using the Coulomb software. Am I right?
I would like to extract 3-D displacement caused by an earthquake (Mw < 6.5). So, I discussed here about the efficiency of Offset-tracking tool of SNAP and then tried to read these following papers:
As I found in these documents, if we can access the very-high resolution satellite images over this kind of earthquake, we can find the horizontal displacement using COSI-Corr software ad try to decompose by this and two orbits of InSAR processing.
The accuracy of MAI method, as reported in these papers, is in a range of centimeters which I think not compatible with the displacement caused by this kind of earthquake. On the other hand, finding any signal using Offset-tracking method or COSI-Corr software depends on the spatial resolution of satellite images we use. If we can find VHSR images, we can able to be happy with 3-D displacement.
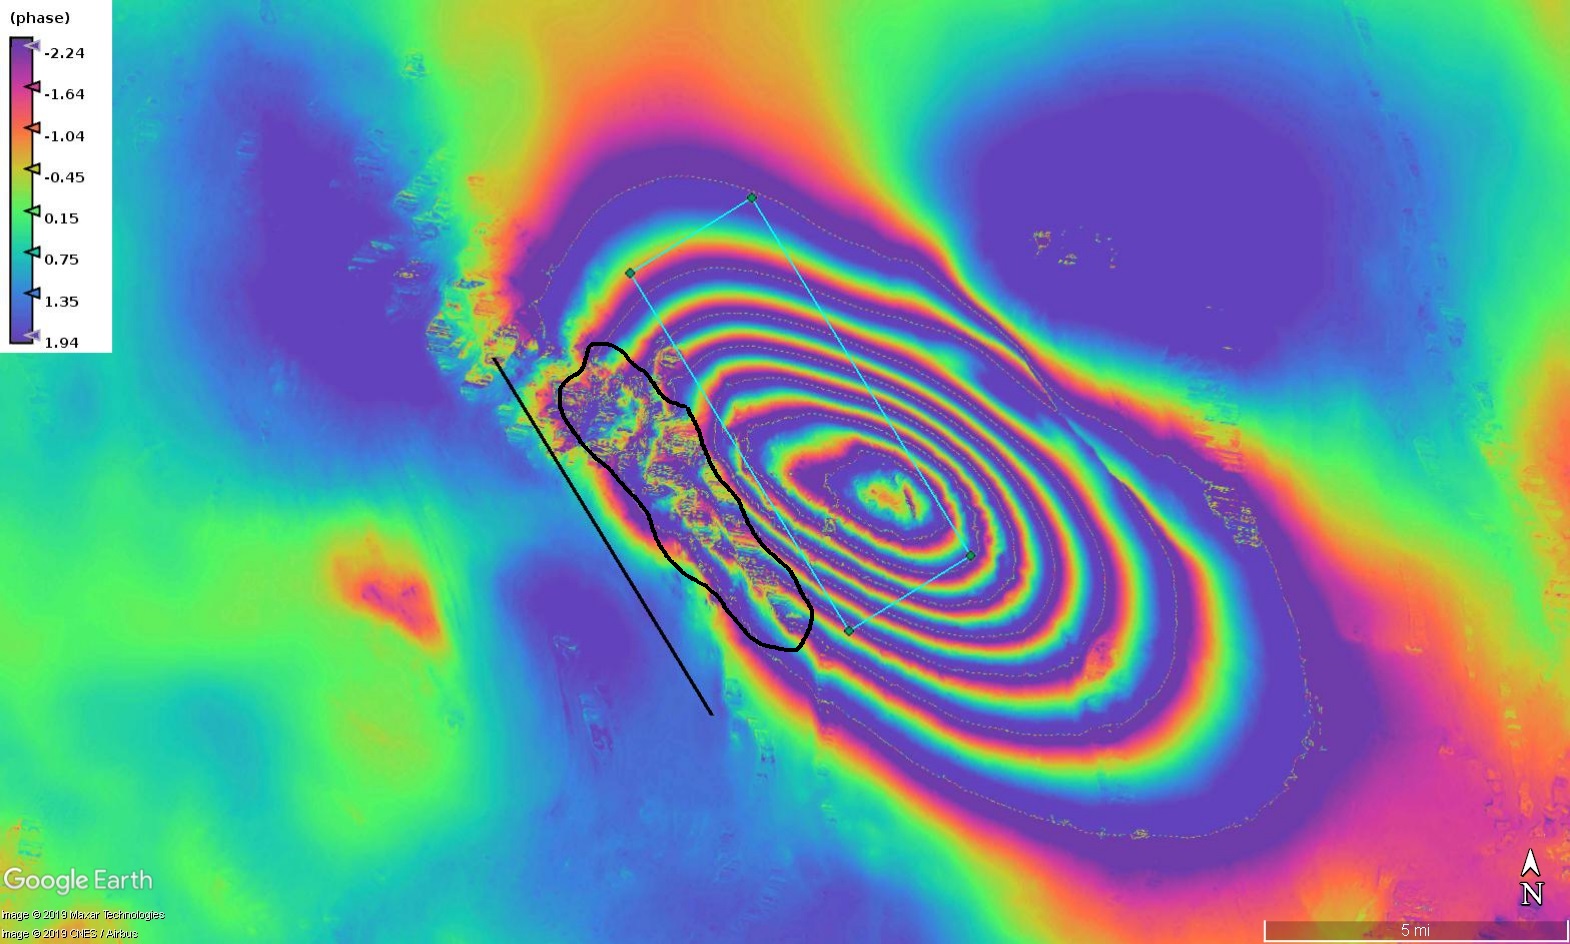
@EJFielding So sorry to disturb you again. Because I had some mistake in orientation and location of the considered fault projected on the surface, I would like to just show you the correct results as follows:
Fault projected on Google Earth with the wrapped result:
It shows that the rupture happened on the slopes of mountainous areas, far from the trace line of the fault along with the slip. I think it is reasonable!
Yes, it makes sense that those areas of disrupted fringes are on steep slopes above the rupture at depth. They are probably landslides or other mass movements triggered by the earthquake shaking.
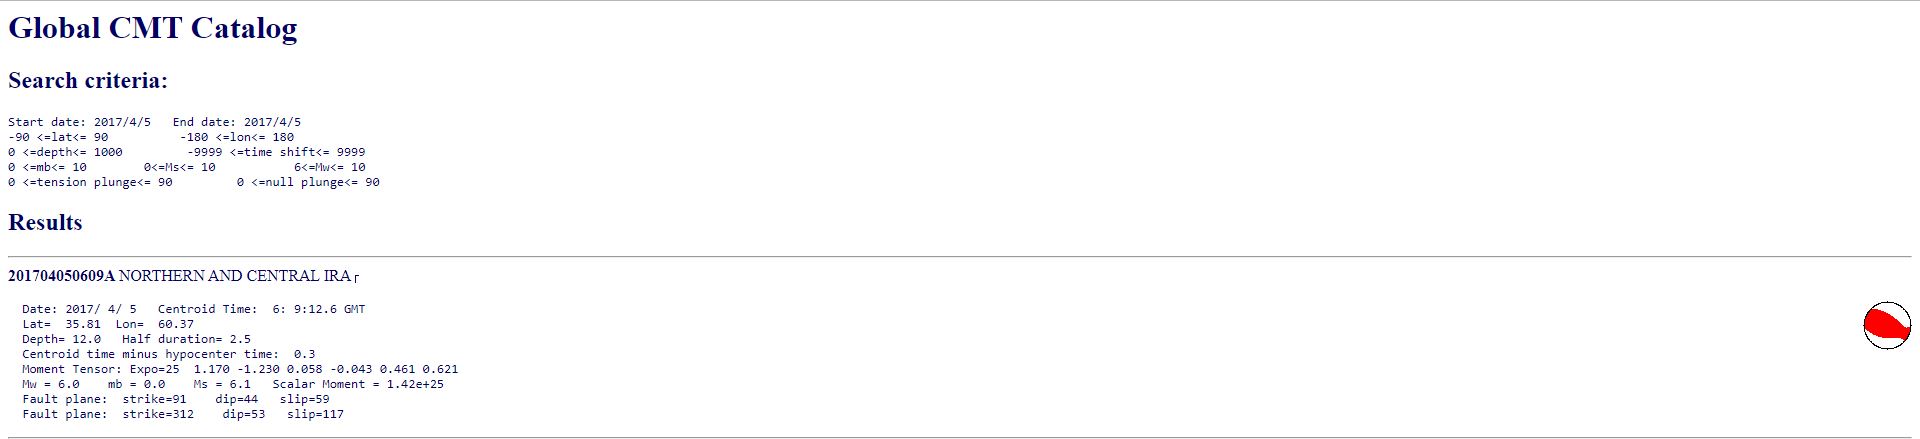
USGS reported an earthquake with the following properties:
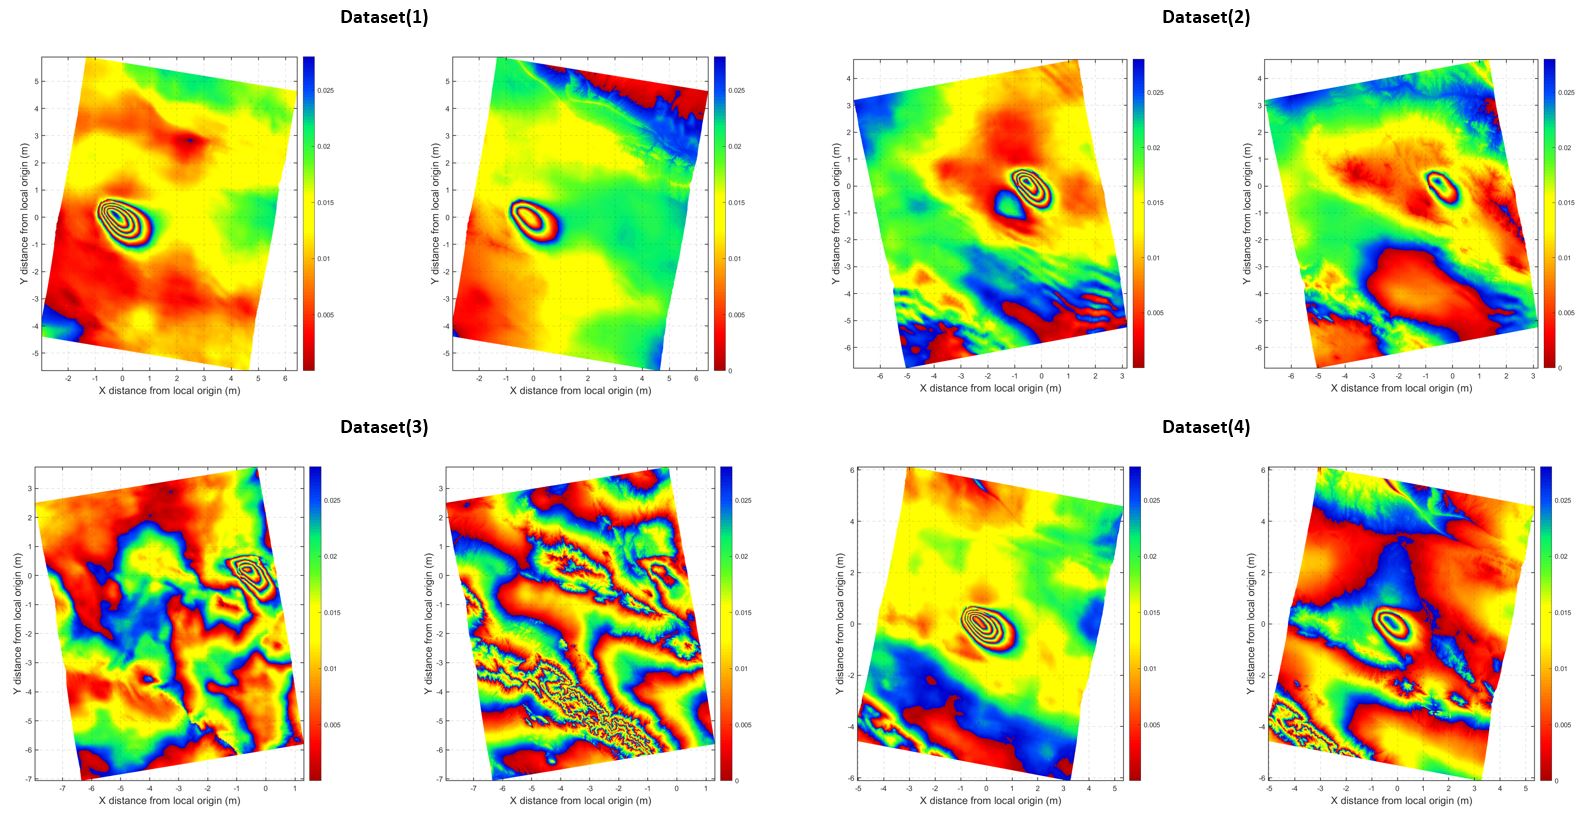
I think this property can be related to the reverse type of fault or maybe the reverse right-lateral oblique type! I considered it to do the modeling using the InSAR results. As you can see in the following, we have four orbits to cover it completely.
I got the modeling results which shows there are both strike-slip and dip-slip with the values of 0.43 and 0.59 meters. Based on the values of rake and beach ball reported by USGS, I think it must be similar to a reverse fault but the values of strike-slip and dip-slip suggest a reverse right-lateral oblique fault for this case. So, I was confused about being confident for USGS information.
The USGS usually posts a moment tensor from the W-phase moment tensor inversion for global earthquakes, shown by “Mww” in the source table. You did not mention the magnitude of this event, but I am guessing that it is around magnitude Mww 6.0. The moment tensor from W-phase is usually good for events of this size, but there is substantial uncertainty on the exact values of strike, dip, and rake, probably at least 5 degrees for each of them.
You should look at other catalogs of source mechanisms, including the Global Centroid Moment Tensor (GCMT) catalog, to see how much variation there is between the estimates.
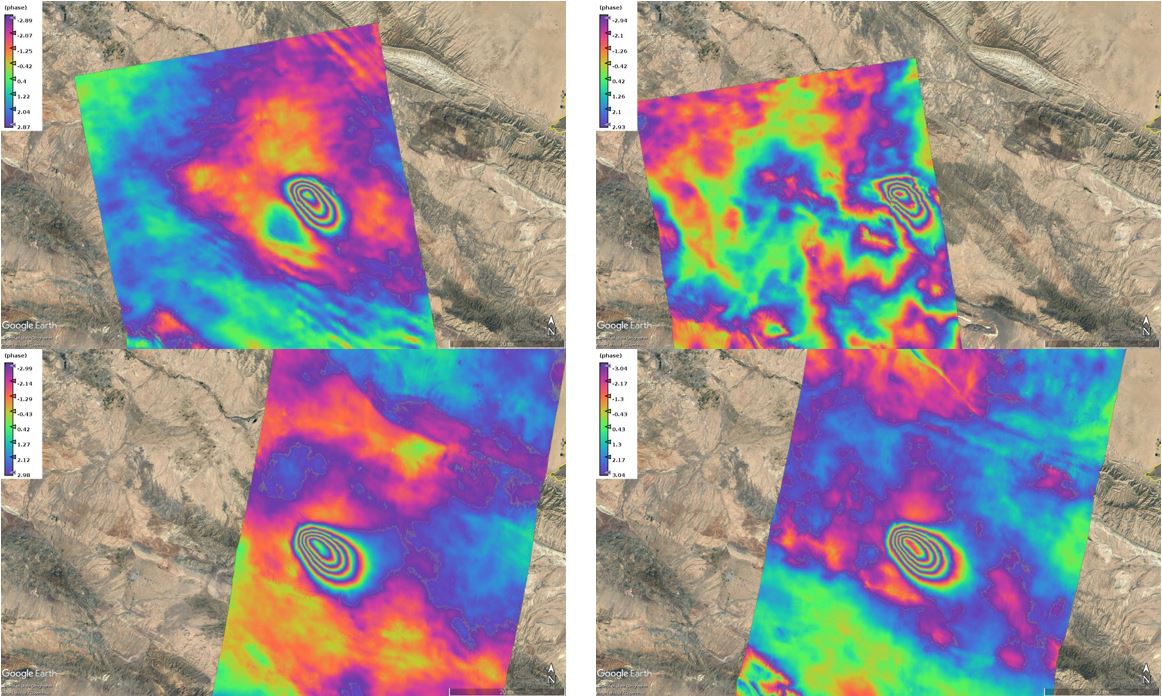
You also need to consider the errors in the InSAR data when you do a model slip inversion. The interferogram in the top right has obvious atmospheric effects. The other interferograms have smaller atmospheric effects, but more than zero.
@EJFielding Thank you so much. Sorry about I didn’t say the magnitude.
Its magnitude is 6-6.1 based on both USGS and GCMT catalog but when I compared the values of the strike, dip, and rake, I found that their variation between these two resources is not small as follows:
The difference between the USGS W-phase moment tensor and the GCMT gives you an idea of the uncertainty in the moment tensor solutions. The best-fitting nodal planes are substantially different, but the P and T axes are probably more similar. For this event, it looks like the dip is more different than the strike or rake, so that is probably the parameter that has the least constraint from the global seismic solutions. Modeling interferograms can give more precise information on the fault strike, dip, and rake than the global network moment tensors, so I would not worry if you get values different from the seismic solutions.
As suggested to do the atmospheric correction on the IFGs, I applied using the GACOS files because unfortunately, I don’t have any other resources to calculate this artifact. As you can see in the following, it is interesting that two fringes were removed after the correction in all IFGs but, I am wondering about the Dataset(3) which seems to be destroyed the fringes after the correction and also Dataset(4).
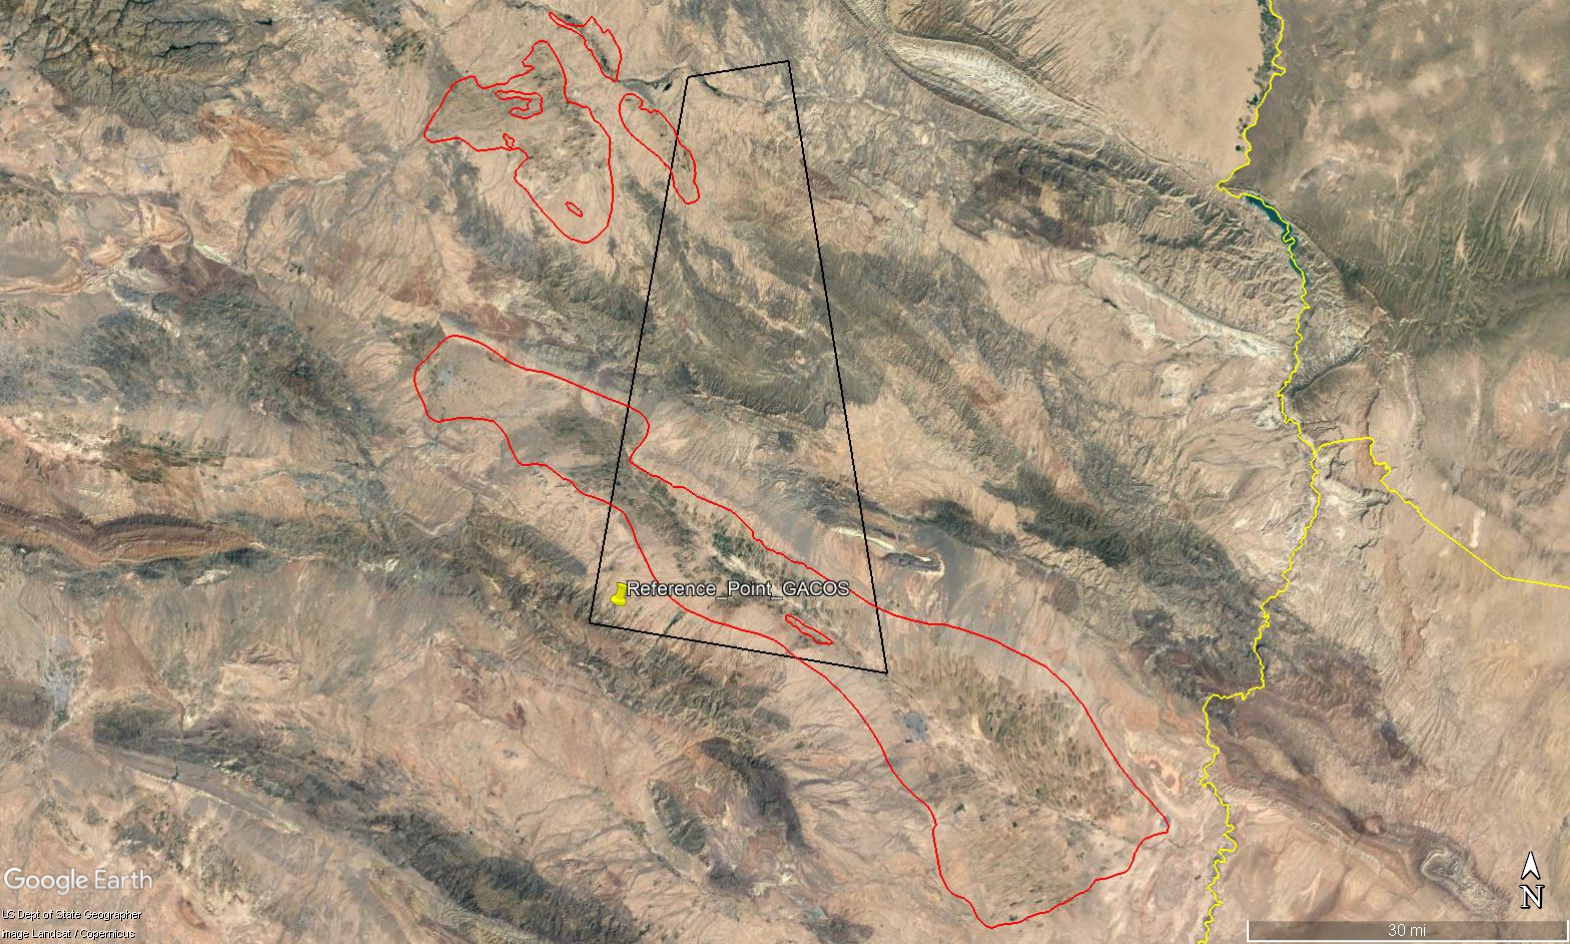
I would like to set the reference point in the GACOS program to apply the atmospheric correction. As you know, most of the lands in Iran involved with the land subsidence caused by groundwater exploitation. So, based on the figure as follow, I have two approaches to select an accurate reference point: 1) do the long term InSAR processing with Envisat and S1 in the area to find where doesn’t have any subsidence and far away the earthquake location, and 2) Choose a point out of the aquifer boundary and also near to mountain and far away the earthquake position as determined below:
Red polygons are aquifer boundaries, the rectangle shows the overlapped area between four IFGs, and that benchmark is my selection for reference point for the GACOS operation.
About the second approach, I am worried about choosing a point in terms of atmospheric effects but also the first approach is very time-consuming work.
So, based on the atmospheric correction results, I don’t know to be careful about the reference point or not. Will it be so effective in the results?