Hi,
I would like to export a .csv file relative to the standard deviation of velocities (and maybe also of the displacement).
It is easy to export just the velocity STD, but I would like to add the lat and long.
Do you know how to do it?
My script to export just the STD velocities is:
load parms.mat;
ps_plot(‘vs-do’, -1,0,0,[], 0, 0, 0,[], [10.93 10.94], [45.06 45.08]);
load ps_plot_vs-do.mat;
export_res = [ph_disp];
export_res = table(export_res);
writetable(export_res,‘SBPO_STD_S1A_VH_asc_PS.csv’)
Thanks
Cheers
ABraun
September 1, 2020, 6:36am
#2
I moved your topic to the #stamps category
1 Like
Sarto28
September 2, 2020, 2:31pm
#3
Hi,
Does anyone know how to find the coordinates of the PS velocity standard deviation?
Thanks
ABraun
September 3, 2020, 11:08am
#4
maybe you can adapt on the export code of the StaMPS-Visualizer, SNAP-StaMPS Workflow
Sarto28
September 3, 2020, 11:58am
#5
Thanks.
Maybe I have found a way to adapt that script to ps_plot (vs’).
ledi_04
November 4, 2020, 10:01pm
#6
hi @Sarto28 , would you mind telling how did you solve the problem of the exporting of vs-plot?
Sarto28
November 5, 2020, 7:54am
#7
Hi,
I have created a new script similar to that used to export v-do. But first, you must run the ps_plot (‘v’), select the area you are interested in and save three files: “lonlat”, “lon2” and “lat2”.
Then you can run the new script as follow:
load parms.mat;
ps_plot(‘vs-do’, -1,0,0,[], 0, 0, 0,[], [10.92 10.95], [45.06 45.09]);
load ps_plot_vs-do.mat;
load (‘lonlat’);
load (‘lon2’);
load (‘lat2’)
lon2_str = cellstr(num2str(lon2));
lat2_str = cellstr(num2str(lat2));
lonlat2_str = strcat(lon2_str,lat2_str);
lonlat_str = strcat(cellstr(num2str(lonlat(:,1))),cellstr(num2str(lonlat(:,2))));
lonlat_str_sec = strcat(cellstr(num2str(lonlat(:,1))),’,’,cellstr(num2str(lonlat(:,2))));
ind = ismember(lonlat_str, lonlat2_str);
vel = ph_disp(ind);
lonlat_str_aux = lonlat_str_sec (ind);
[row,col]=size(lonlat_str_aux);
for i=1:row
Auxvar = strsplit(lonlat_str_aux{i,1},’,’);
lon2exp(i,1)= str2num(char(Auxvar(1,1)));
lat2exp(i,1)= str2num(char(Auxvar(1,2)));
end
export_res = table([lon2exp lat2exp vel]);
writetable(export_res,‘file.csv’)
It worked for me.
Cheers,
Luca
1 Like
ledi_04
November 5, 2020, 8:52am
#8
Thank you Luca for your time and help. I tried to do it with my worksheet but it didn’t go well. I had this problem:
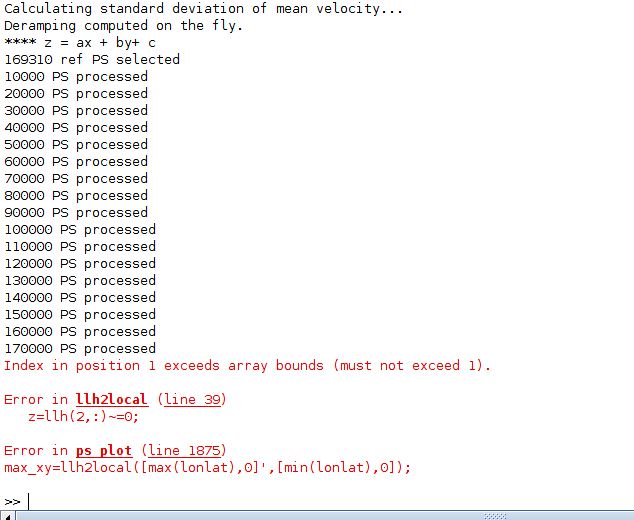
Probably becouse i made an error with the first plot. To find and save the coordintes, i used the same plot as for mean velocity deformation: ps_plot(‘v-do’, ‘ts’); and then i run you script. I tried to use ps_plot (‘v’) but it doesn’t work at all.