Hi, I’m using two different temporal images from S1A (08/01/019-20/01/19). Can I extract automatically a vector file from the zone that has a different backscatter?
For example, I create a RGB image with:
R–> intensity VV (20/01/19)
G–> intensity VV (08/01/19)
B–> intensity VV (20/01/19)
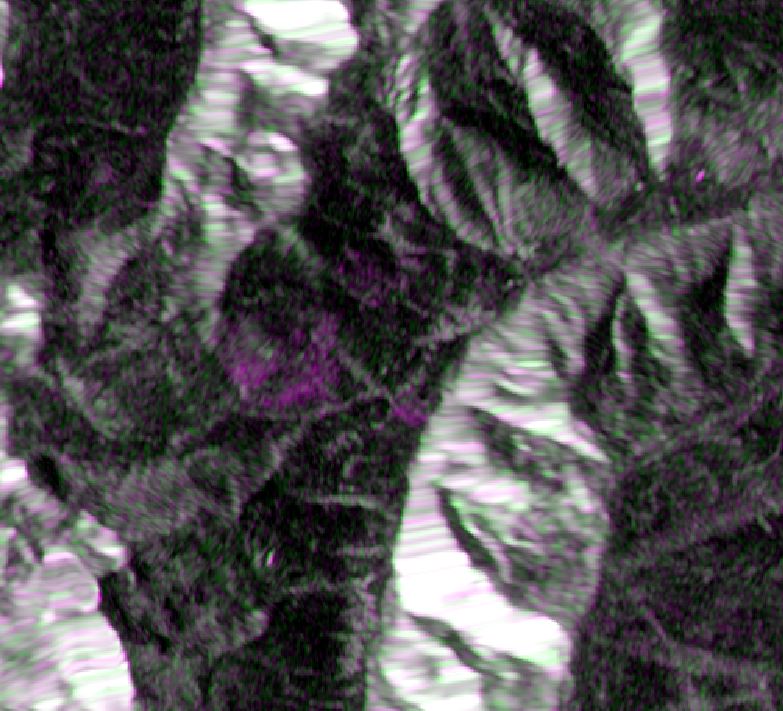
The result is the image below (avalanche detect is identify by the dark purple). From this image I would like to extract the edge (like shape file) of the purple zone.
you could place some pins inside and outside this area and compare the values to search for thresholds.
Then you use this thresholds to create a binary image in the band maths:
e.g. 20/01/19 > 0.3 AND 20/01/08 < 0.2
this gives you a raster consisting of 1 where this criterion is fulfilled, other pixels are 0.
Just a thought: It might be worth to include VH for the RGB because this gives you additional flexibility to create this threshold.
Maybe also stronger filtering could furthermore pronounce this area.
For the use of additional stronger filtering, do you have some advice? I’m new to this software and satillite images.
pre-processing of my image allows these steps:
-subset
-apply orbit file
-speckle filetring–> Gamma map (I tryed with other filter (Lee, Frost… but it seem to me that Gamma map works better in this case)
-range doppler terrain
and then I create a RGB image
the workflow is fine. As both images are from different dates, you might include calibration before the speckle filtering. About a suitable filter: You will have to try and compare which one makes the best uniform information about that purple patch, there is no general answer I’m afraid.
okay, no problem… you’ve already helped a lot! : )
i will try with pins, for the calibration, I didn’t use before because the both images are from the same orbit (only 12 days after) and i thought it was not necessary.
Calibration won’t make a large difference but you can at least go sure that both images show the same information.
You can also use the profile plot and draw a line across this area to see the backscatter values along a profile. Similar to what is shown here: Profile Plot with correlative data