Hello,
I want to test some InSAR methodologies but unfortunately it is very difficult for me to find free ground validation data. Does anyone know if there are such datasets available?
Thanks.
Hello,
I want to test some InSAR methodologies but unfortunately it is very difficult for me to find free ground validation data. Does anyone know if there are such datasets available?
Thanks.
You could download GPS data from Nevada Geodetic Laboratory and GPSCOPE, but the availability depends on your area of interest.
You need to download env file
You need to download mb file and merge it to ENU or what you want.
Wow, I wasn’t expecting so much freely available data! Thank you so much @Simonst7.
Just a clarification regarding the GPS data from the MAGNET tenv3 files if anyone is familiar with it.
Is the vertical (m) column relative change in station height? So in the example below the station vertical changed by 0.35637 meters relative to the previous recorded data?
Sample data and column descriptions:
1.  COVE      station name
2.  10JUL28   date
3.  2010.5708 decimal year
4.  55405     modified Julian day
5.  1594      GPS week
6.  4         day of GPS week
7.  -112.8    longitude (degrees) of reference meridian
8.  -3815     eastings (m), integer portion (from ref. meridian)
9.  -0.41548  eastings (m), fractional portion
10.  4276712  northings (m), integer portion (from equator)
11.  0.86481  northings (m), fractional portion
12.  1687     vertical (m), integer portion
13.  0.35637  vertical (m), integer portion
14. 0.1800    antenna height (m) assumed from Rinex header
15. 0.00065   east sigma (m)
16. 0.00067   north sigma (m)
17. 0.00328   vertical sigma (m)
18.  0.05829  east-north correlation coefficient
19. -0.56488  east-vertical correlation coefficient
20.  0.04405  north-vertical correlation coefficient
Hi @panjibrotoisworo ,
The east/north or vertical columns are the cumulative displacement regarding to the one date (the initial date or whatever you want). You can select one date and put in here the 0 meters (sometimes used when you want to compare datasets GPS, InSAR, or other time series in the same point).
For example:
#Date        Up(meters)
10JUL27   0.34000
10JUL28   0.35637
10JUL29   0.35640
This small amount of data have a difference between 28 JUL and 27 JUL of 0.01637 meters, so the GPS has a small change in the vertical component (uplift in this case) followed by another very small upliftment movement on 29th July.
In the same way you can set 10JUL27 like a reference date and change all displacements regarding to this:
#Date     Up(meters)
10JUL27   0
10JUL28   0.01637
10JUL29   0.01640
Hope this can help you.
Yes, this is perfect. Thank you so much!
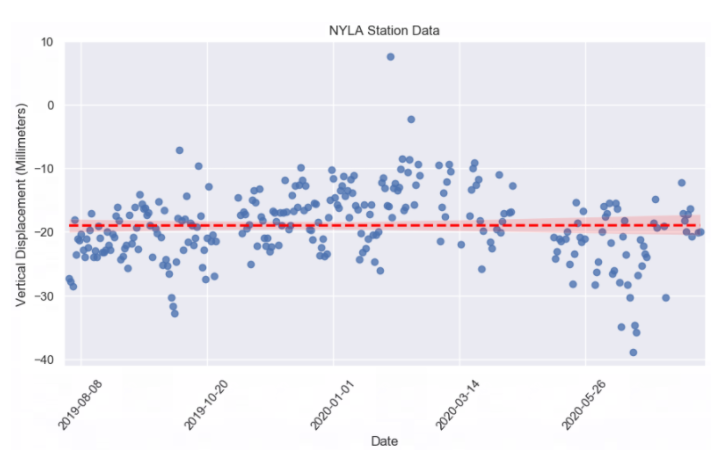
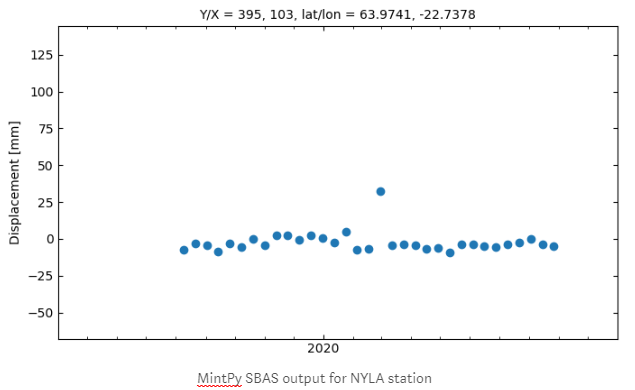
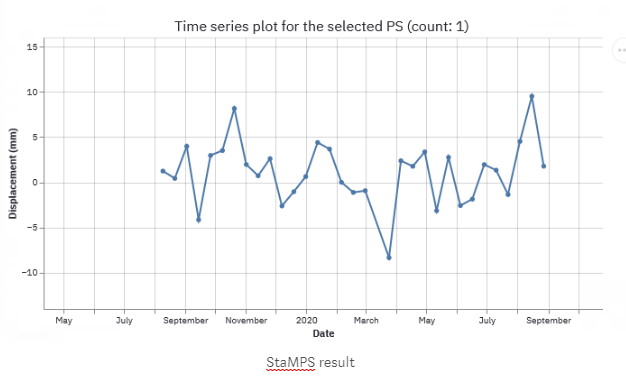
Just sharing my results. I was able to parse NYLA station in Iceland using dates Aug 2019 - Aug 2020 and test some quick InSAR methods (used default settings for StaMPS and MintPy).
Some quick results based on linear velocity:
GPS: -0.034 mm per year with a standard error of ±0.001 mm
MintPy: -0.79 mm per year ±3.99 mm
StaMPS: -0.002 mm per year ±1.967 mm
Hi, I have finished my INSAR project using SNAP and StaMPS …
Now it is necessary to validate the results. I have already reviewed the Nevada Geodetic Laborator site and in my study area there are two sites where I can find information.
But I don’t know how to carry out that process …
I just have to adjust the speed provided by the Nevada Geodetic in the same place of my investigation or is there a geoprocess that does it? …
I hope you can help me
Very nice explanation. Thank you Simonst7
GPS is vertical velocity and PS-InSAR is LOS right. Is there any possibility to transfer LOS to vertical (Direct comparison purpose) or vise versa?
Hi @HugoLuVi ,
What do you mean by “adjust the speed”?. You can simply compare the dataset from GPS in the same time-interval that you InSAR TS results by taking a reference date as 0 deformation.
If you want the GPS velocity over this time interval, you could just do linear regression and see the velocity in mm/year for example.
Hi @suribabu , yes you’re right, if you have just one geometry, you have LOS deformation. To make a vertical deformation you need both results: ascending and descending LOS. In this way, you can get the vertical and horizontal deformation (East-West), the N-S deformation is more complicated and there you need more information like MAI measurements (azimuth tracking)
To compare GPS to a single geometry, it is necessary to convert the GPS measurements to LOS. You should follow the following matrix relationship:
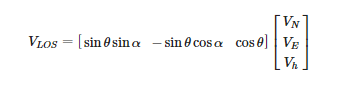
The Vn,Ve,Vn are the ENU components from GPS station, θ is the incidence angle of satellite that you want to compare (just try with a constant reference angle, ex. Sentinel 1 = 37°, It depend on when is your point to be compared), and α is the heading angle (azimuth, ex. Sentinel 1 = 11°, depending of the geometry: ascending or descending orbit, because the measurement is from north to the direction of flight.
Hope this helps.
Hello @Simonst7 , thank you very much for answering.
Okay, I thought there was some post-processing to do. In my case the speeds coincide with the deformations of the GPS.
When obtaining the sinking values where the speed is negative (-) I also obtain positive values (+), how could I interpret that?
Is there a process to eliminate these zones of positive values?
The values (+) are in rocky areas, other studies show that there is no deformation in that area.
As extra data all my images are ascending type, could this influence something?
HI @HugoLuVi
Yes, having a unique geometry could show a different pattern than the actual vertical deformation. It depends on whether the deformation in the area is in the radar look (range). It influences the slope and constant small changes that don’t reach the satellite pixel. Also if you have rocky areas with a different height than the sinking area, there could be atmospheric decompensations, so you have to correct them (maybe with phase elevation correction, ramp phase correction, etc), otherwise, you have to review your unwrapping images and remove the incorrect unwrapping results and re-run the time series process (PS or SBAS).
I used only image in one direction due to the location of the study area.
How could I execute those kinds of corrections? (phase lift correction, ramp phase correction, etc.)
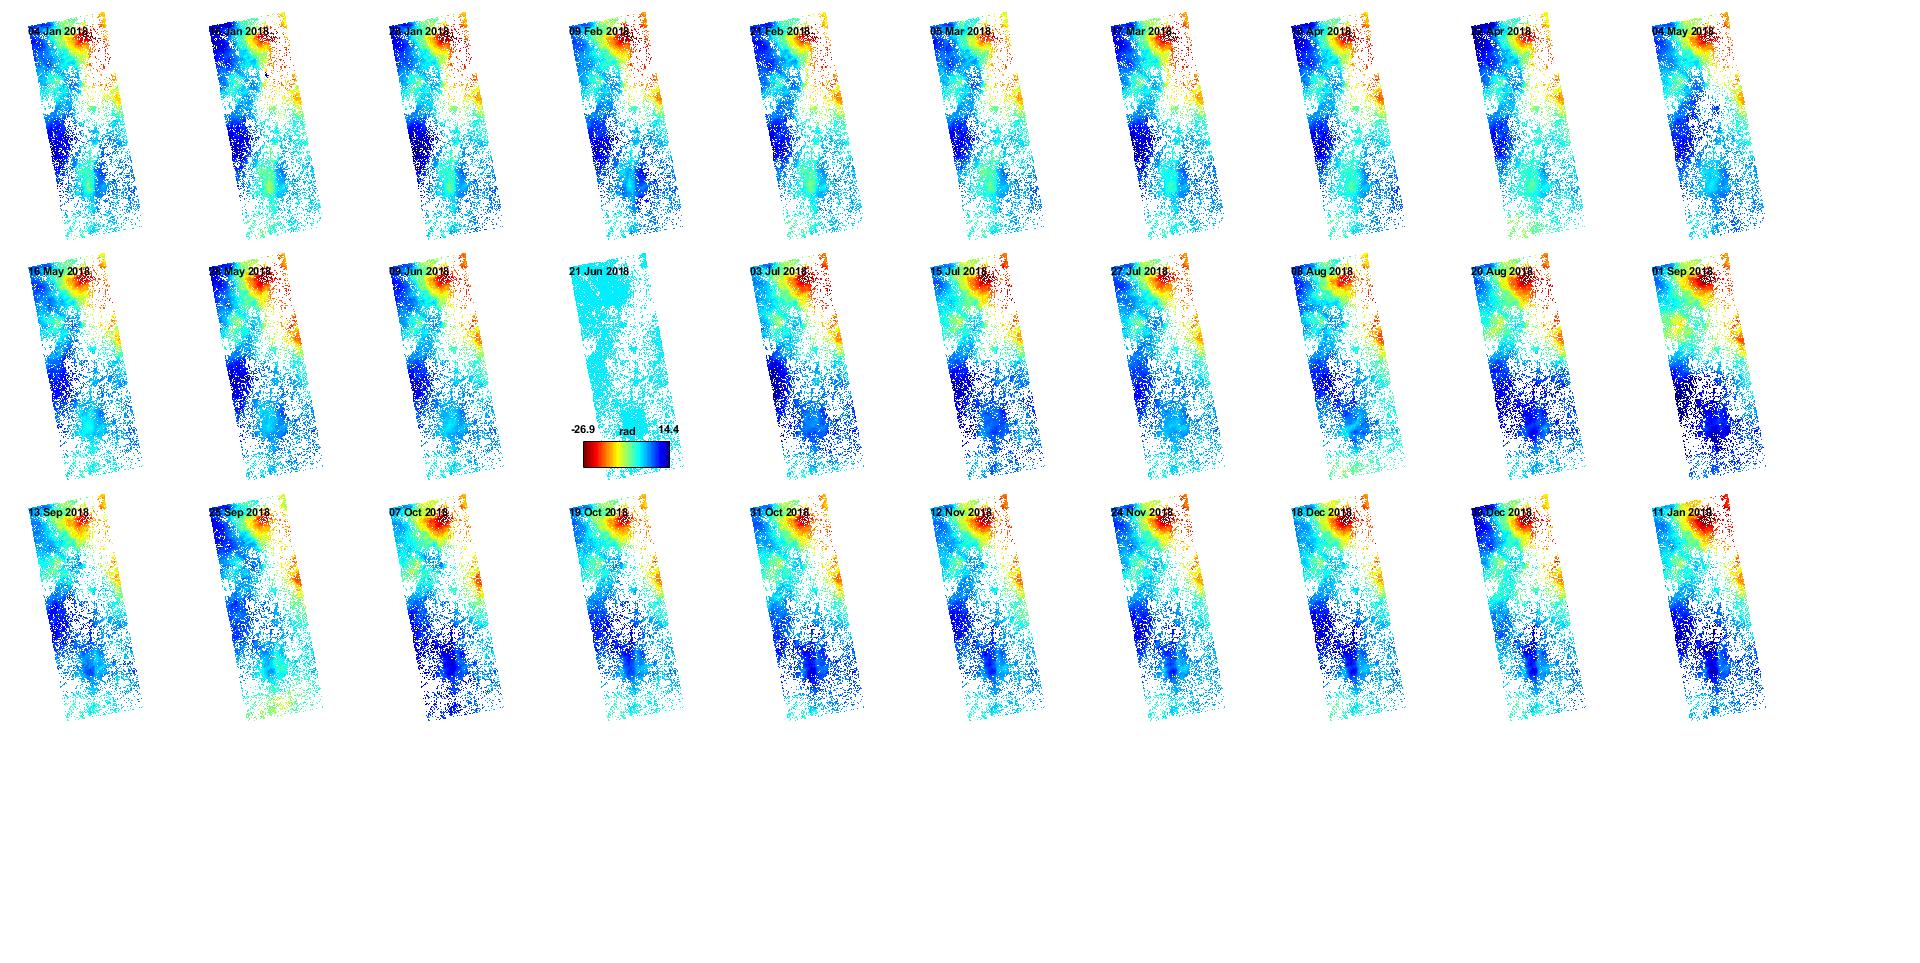
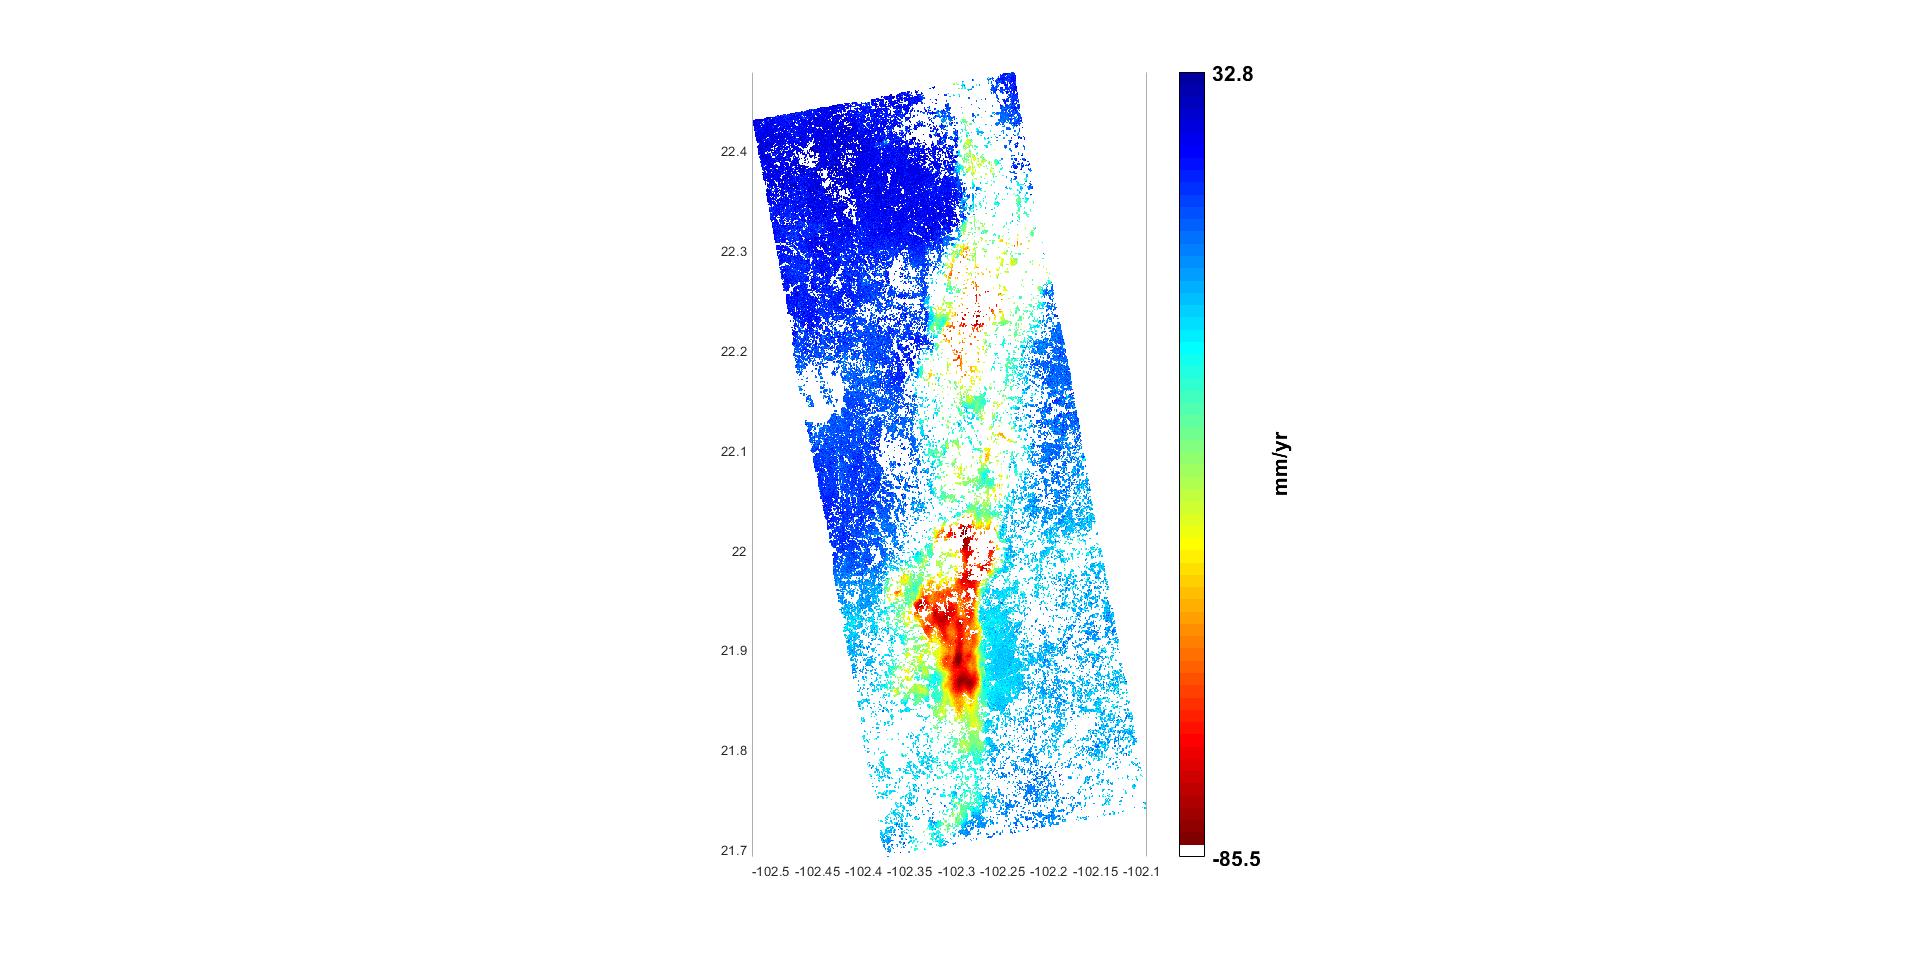
How can I know which images to remove? Attached image of the speed and the unwrapped slaves.
Can you please forward the reference paper?
Please check it once,
(Huang et al., 2019)
I tried both in matlab,
#yours’s provided formula, for GPS vertical to LOS.
t1=[sind(35)*sind(110) -sind(35)cosd(110) cosd(35)];
t2=[0.31; -0.48; -10.24];
LOS=t1t2
Answer:
LOS =
-8.3152
#above provided publication,
% Degrees (If you want in radians no need to add ‘d’ in ‘sin’)
t1=[cosd(110)*sind(35) sind(110)sind(35) -cosd(35)];
t2=[-0.48; 0.31; -10.24];
LOS=t1t2
Answer:
LOS =
8.6494
I’m getting a different result, please clarify once (In both cases I’m using the same parameters like Incidence angle =35 and heading angle =110).
Dear @Simonst7 @EJFielding @panjibrotoisworo @ABraun
For converting LOS to vertical can we use this formula (only descending orbit data is available)?
Zhou et al., 2020
It is one of many ways to do this, but it is not very precise.
That equation for estimating vertical displacement from a single LOS measurement is assuming that there are no horizontal displacements. You need to have other information to decide whether the zero horizontal displacements is a good approximation or not.
Thanks Fielding,
If we consider the horizontal displacements also, then which equation is better to calculate the Vertical displacement from LOS (only single LOS available)