I need to do an unsupervised classification with a sentinel1 time series (6 images grd). I have read that the textures coming from GCLM provide good information. I have tried and realized that the output file contains 20 bands (10 for sigma0vh and 10 for sigma0vv). So I was wondering if there are some bands which are more useful that the other ones?, I know they all represent different information. but I am interested on reducing the amount of bands a little (no more than 10)
Hello
I am using a SAR(S1/10.10.2017) and a optical image(S2/10.10.17) together for image classification. I have Stacked 6 layers of S2 data and 16 GLCM layers of SAR data. Now, i want to perform a RF classification. I have few doubts related to which:
Adding the vectors file(Forest,water etc) in the stacked image, I am confused between train on raster and train on vector.
Same number of bands appear(as of stacked file) on the Feature selection menu, should i select all bands or should go with the master band with VH and VV.
3)Why is the default value for number of tress is 10??
Kindly Help!!
Thanks in advance.
You have already 6 features of SENTINEL2 and another 16 from GLCM. In order for the classification to perform well, the more features we have, the better the classification results. IN your case, you have included way too many features. This will probably overfit your data and your accuracy will drop. It is recommended not to include more than 7-8 features when performing classification. What you can do is to perform a Principal Component Analysis (PCA) on your GLCM results so that to reduce the dimensions down to 2 or 3.
In terms of your first question, you do not have to create training data for both SAR and optical image. Use either the optical or SAR to create training data and use train on vectors because your training data will be in a vector format.
In terms of your second question, all the bands of the SAR and optical data will appear in this box. It depends on you what bands you want to select.
In terms of your third question, the more trees we have, the better the algorithm can capture the complexity of the data achieving higher classification accuracy. On the other hand, the algorithm gets slower the more trees we add
Thanks a lot Sir.
PCA operator takes way more time, once i tried with 24 layers it took around two day and still the process was 25% complete. Any suggestion??
If you want you can select only the GLCM parameters of HH polarization and perform a PCA. The results of GLCM in HH polarization is much better and the information in the image is kept compared to HV polarization. In order to achieve comparable results in HV polarization , we need to set the quantization level should be very high (128) which is not very efficient.
So, you can try selecting only the GLCM features in HH polarization and perform PCA on that. Then, perform classification and see if your classification accuracy is increased
When i did the PCA analysis, how can i get the main components?
in another word,can you show me how i can get the main components?
i dont know how to analysis the PCA results.
thank you all.
Intending to use GLCM, in supervised classification for mostly AOI is urban area, should those parameters be changed? Or keep as default, any suggestions,
the parameters of the GLCM texture analysis can be tweaked according to your application.
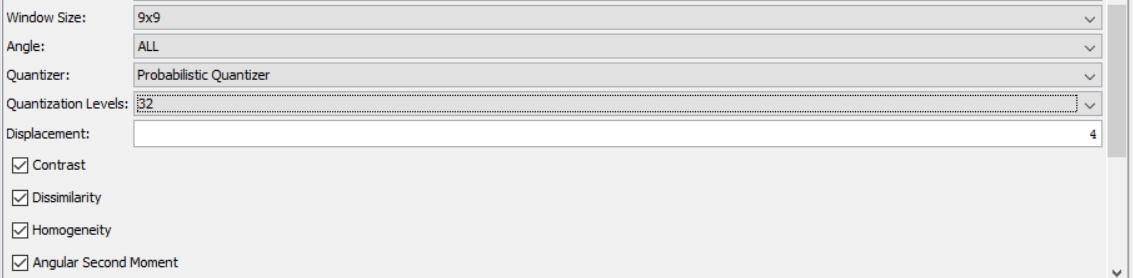
window size: If your application has to do with identifying linear objects (rivers, building edges e.t.c) then you would need a small window size (3x3) otherwise it will blur your results. With a large window size, better results achieved for deriving the texture of large objects (such as deriving the texture of buildings).
Quantization level: the value 32 is acceptable. The higher the value the better, but its going to be more computationally expensive and your resulting image might not be manageable (very large).
Most cover of my AOI is urban area, basically I’d like to find the change during four years, one image per year, during specific month, study area has also river, farmlands, and bare-soil, so which window do you suggest?, for now, I’m doing test of VH, and VV, for all windows according to our colleague @ABraun suggestions,
As ABraun stated, you can do some experiments with different window sizes and see which one works best. For your application, i would not choose a window size larger than 7x7.
the results you provided, choosing a window size 5x5 look very well.
Ideally, you should have a raster with all of your dimensions (GLCM bands and the bands from your SAR data). when you have many features in your dataset, not all those features contribute the same to the final classification results (some contribute more some others might contribute much less). Hence, in order to improve the results, we need to discard those features that do not contribute to out model generalization.
This is where PCA comes into play. Using PCA, we eliminate features that are correlated to each other that can potentially lead to lower classification performance or model overfitting. You can verify that by plotting each GLCM feature with another one and see the amount of correlation. If two GLCM features have high correlation, there is no point of including both in your classification. That’s why we can use PCA analysis to give us only those features that contribute the most
Python library has a nice module to calculate PCA and it gives you the number of features that contribute teh most, So, these are the features you need to include .
Use all of the features produced by GLCM into your classifier
Check the results both visually and its accuracy as well
Case 2
Perform GLCM analysis on your SAR data (VV +VH)
Perform PCA on the results produced by GLCM
Use the results from PCA into your classifier
Check the results both visually and its accuracy as well
If the classification results produced from GLCM (including all features) is worse (both visually and in terms of its accuracy) than the results from PCA, then this means that your classifier does not perform very well when many features included.
I cannot give you a fixed number of features to be included in your classifier. This can vary from classifier to classifier. You need to do some experiments and see which features best work for the classier you are using.
Usually, a number of features between 7-10 (considering that these features are not correlated to each other) is enough for a classifier to perform well
Thanks a lot for this very informative comments, I’ll take this off course in my consideration.
I’d use RF classifier, I read your previous comments about this matter and I did discuss concerning this issue, I’d say, I agree with you about the number of input layer,