I’m new to the sentinel toolbox application but not to remote sensing, so I apologize if this is basic - I searched the forum first to see if my question was answered.
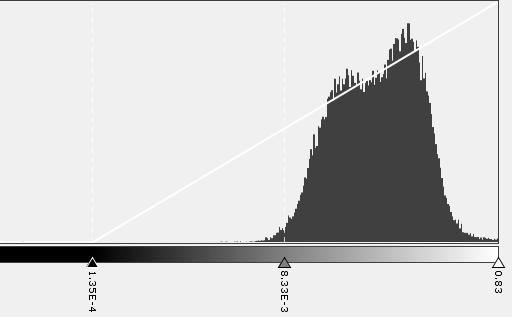
I’m trying to detect flooding with Sentinel 1, and this is my first time with radar data. I’ve been following the guide here: https://sentinel.esa.int/web/sentinel/user-guides/sentinel-1-sar/acquisition-modes/interferometric-wide-swath and have gotten good results after a few software hiccups. That said, when it comes time to threshold the image to separate water from non-water, that guide is vague. It looks like they just choose the value right at the left edge of the normal distribution in the histogram, but that’s not clear.
My own histogram (above) looks quite different from the one in that guide, and choosing the value just to the left of the main part of the distribution doesn’t give results I think are valid. I’ve experimented with other values, and have found some that seem sensible, but the process of choosing a value felt too subjective. So I have a few questions, some specific to flooding and some to radar data:
Is there an accepted, relatively objective method for the threshold that separates mostly water from mostly non-water using Sentinel 1 data?
Can I compare the data to a prior date for the same location? I see the software has a change detection function (but I haven’t read up on it yet) - would the intensity values be comparable, where I could simply compare the resulting image to a prior date’s values and see which areas dropped significantly in intensity? I’ve been uncertain since it seems like the instrument can operate in different modes and may have different angles of capture.
In general, you need to have a histogram of an area that is covered by land and water to around the same parts. So instead of calculating a histogram for the whole image digitize a rectangle that features the two parts equally.
In the histogram tool you can then select to calculate the histogram only for the digitized geometry.
to your first question: It is an accepted method to have the histogram that has two peaks in a numerical format, then make a mathematical graph/curve out of it and then search for the local minimum between the two peaks.
Differentiate the absolutes of Sigma0 VH db between non flooded and flooded. (Terrain correction and conversion to UTM is a nice thing to have done) . <---- Processing!!!
The threshold is if done correctly is somewhat bigger then other values so between 5 and then depends what you are looking for.
However, a global threshold is searched which often is insufficient in cases where land and water are not equally distributed in the image and the histogram doesn’t have a clear minimum. There are several approaches for local thresholding
I wanted to carry out a standard thresholding procedure to segment the land the water bodies.
And I did try out the Otsu’s thresholding method, adopting the python program specified in the links provided here. But however, I am not sure how these scripts takes in the Sentinel 1 image.
before you can use S1 image within python, you have to pre-process (calibrate, geocode) and export them as 8 bit integer. Then you can use it as an input as described here: skimage.io — skimage 0.23.3rc0.dev0 documentation
Afterwards you can convert it to a python array and process them as documented in the script you linked.
I found the threshold by following this method. My question is – can the threshold found from a small portion of the image (containing nearly equal portions of land and water) also be used for the whole image?
My second question is – What are the factors on which this threshold depends? I mean, if I find the threshold for one image for a particular area of interest, can the same threshold be used for other images and seasons also? Or should I calculate the threshold afresh for every image?
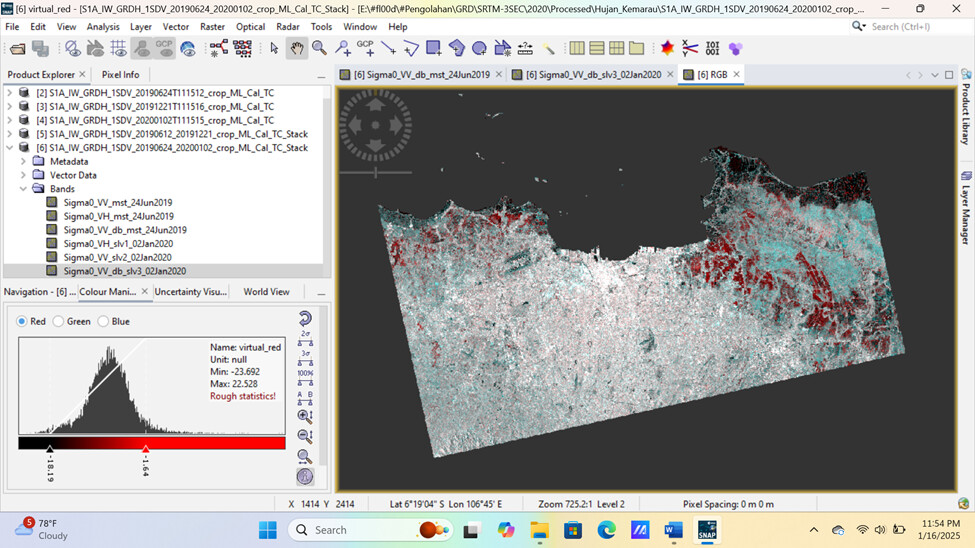
I have processed sentinel-1a grd imagery with rapid flood mapping to detect flood puddles in dki jakarta using the following references:
[https://www.youtube.com/watch?v=derOXkPCH80](https://ESA Echoes in Space - Hazard: Flood mapping with Sentinel-1)
then I did an RGB composite. but my questions are:
why is vegetation detected as red (water)?
how to set the histogram value so that the RGB composite only detects puddles?