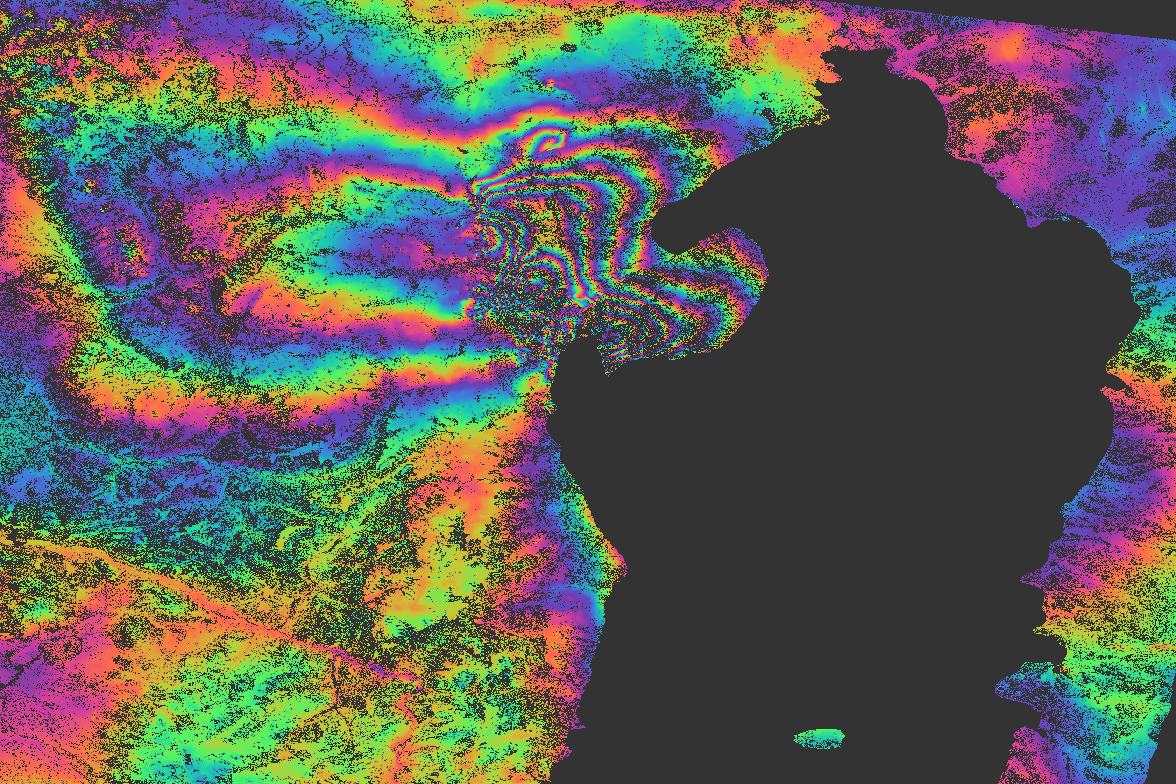
Can you please post screenshots of the interferogram? Some artefacts can be tackled by adjusting parameters or settings, but in case of low coherence, there’s little you can do on the processing side.
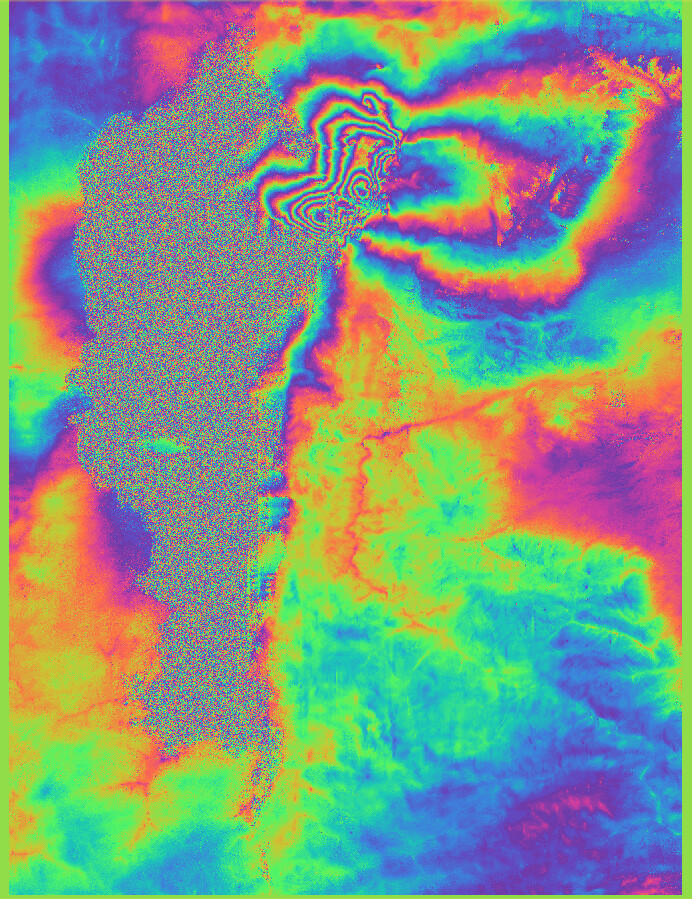
the quality of the interferogram seems good in general.
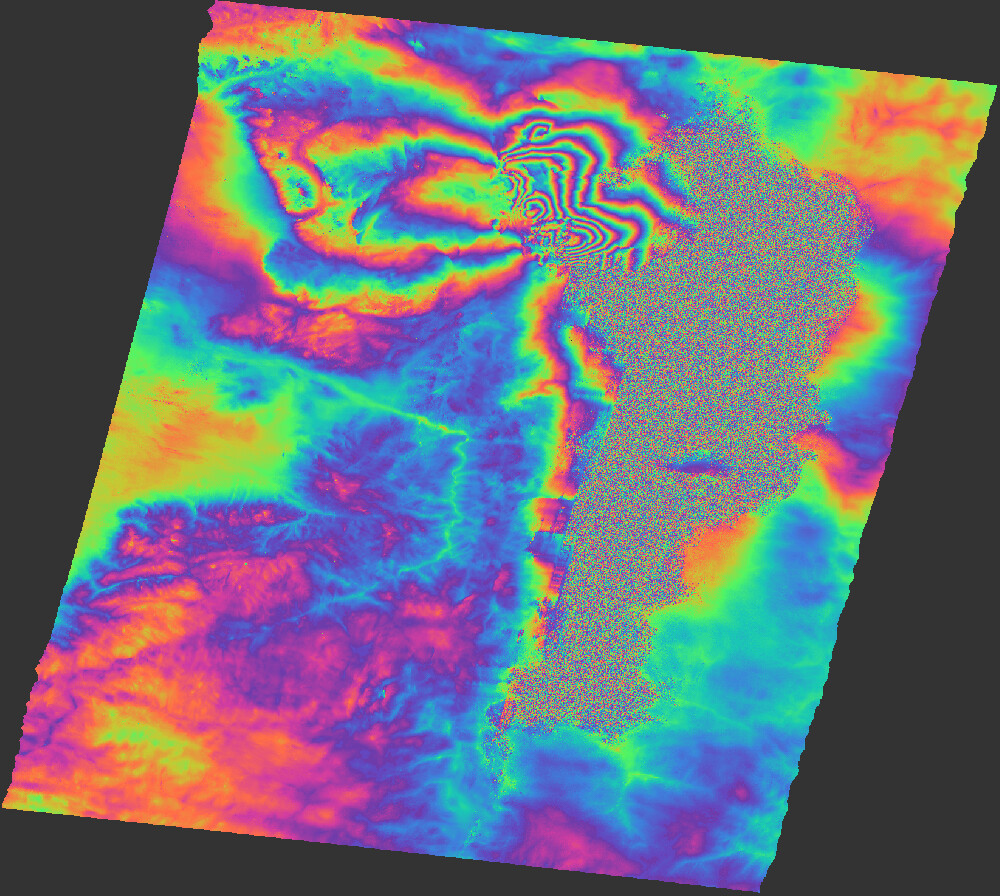
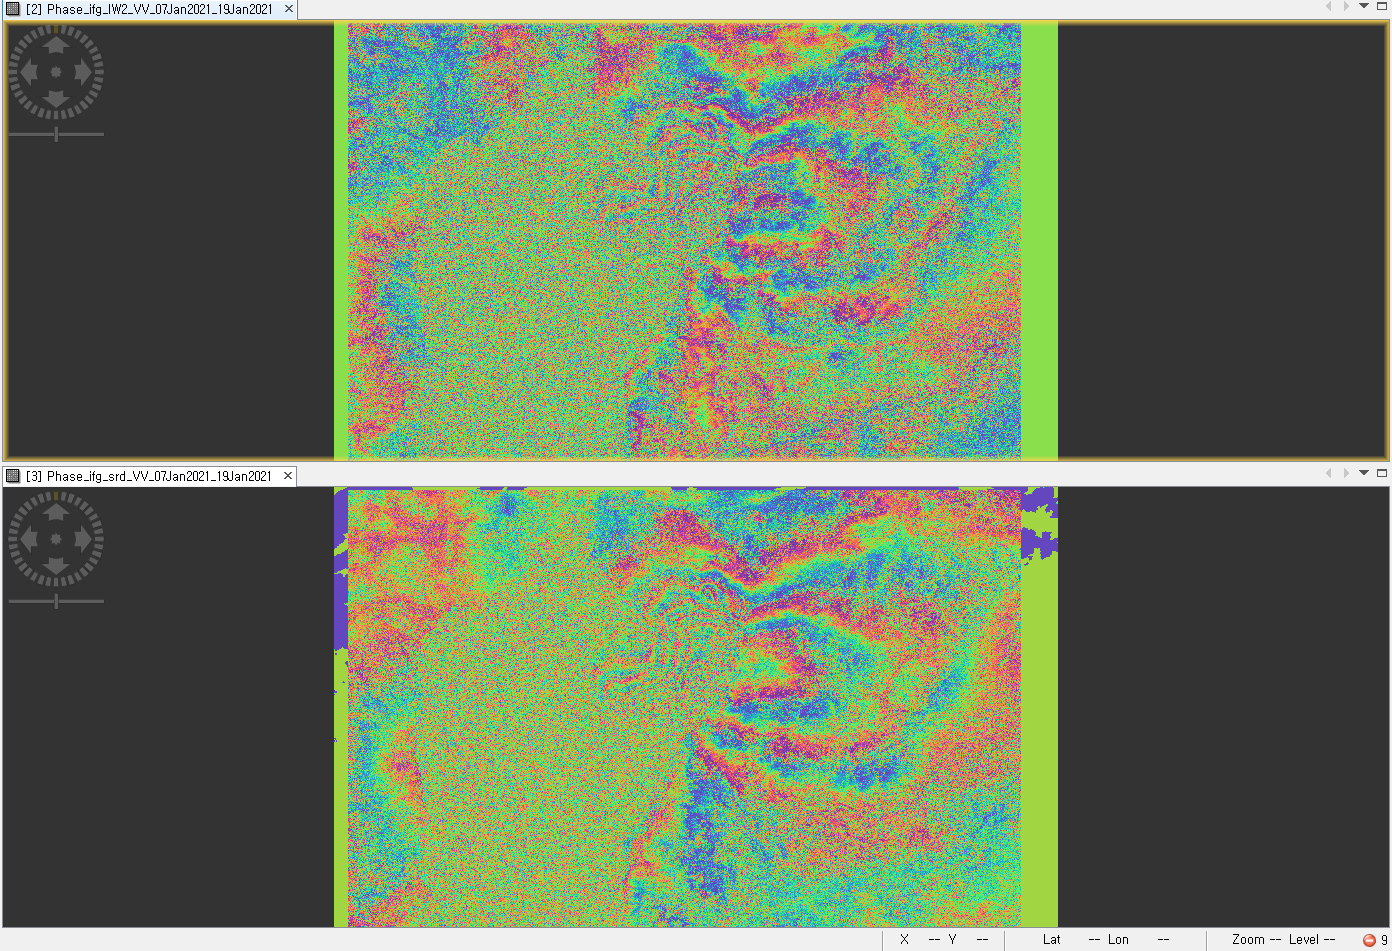
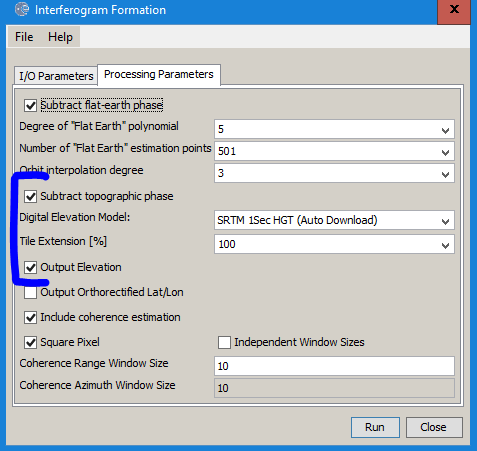
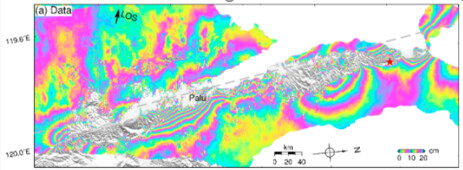
I wonder a bit why the valley in the center is still so present after topographic phase removal. The interferogram seems to contain much topographic contributions. The interferogram formation includes topographic phase removal if you activate it, can you please run it twice: one time with and one time without topographic phase removal and compare the results side by side? I recommend using SRTM 1Sec (AutoDownload)
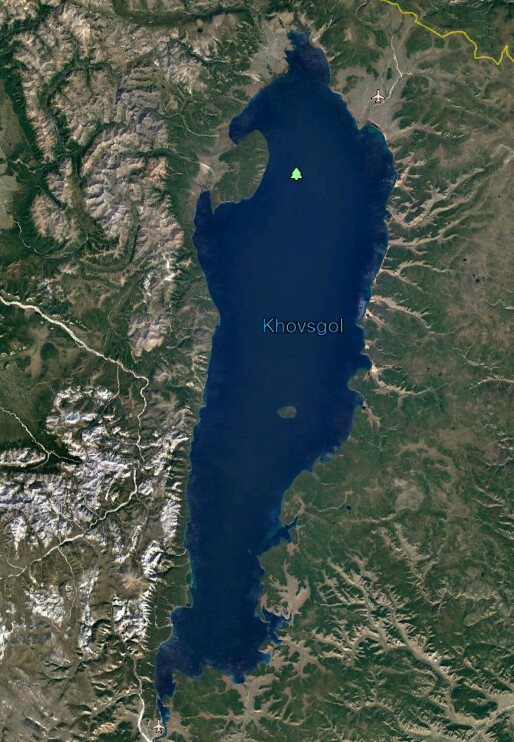
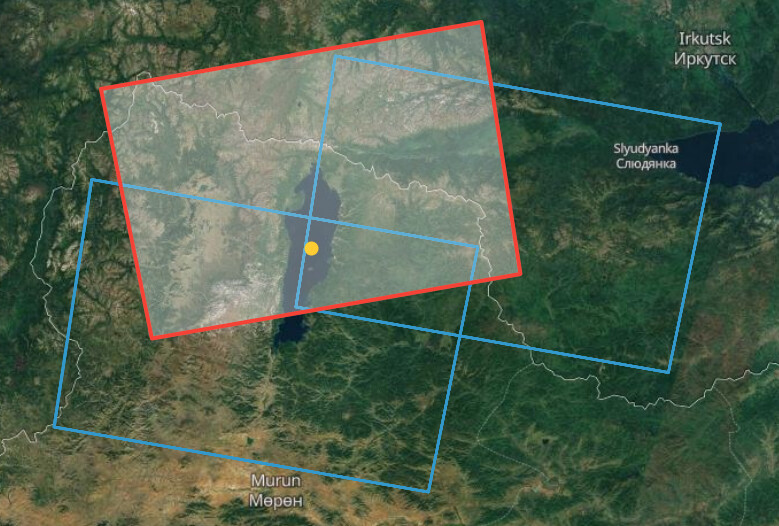
The artefacts at the western border of the lake can probably be tackled by reducing Sigma to 0.6 during the Goldstein filtering.
The rest depends on how the modeling program deals with low cohernce areas. As you say, coherence will remain low over the lake no matter how you preprocess the data. Maybe the modeling software itself allows masking of such areas?
Even though I applied that method, it still doesn’t work.
The lake area could be masked using 1600<elevation<1605 by entering the following into bandmath:
if elevation>1600 and elevation<1605 then 0 else elevation
Since the modeling program does not perform masking on its own, the modeling program must be processed after masking.
I was wondering about these patterns which strongly look like topographically induced
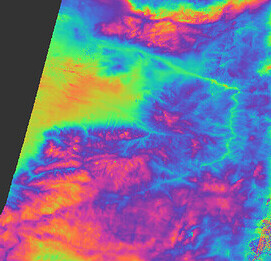
But the two images you showed are a bit different,s o the topographic phase was reduced. Which DEM was used? Can you please show a screenshot of the topographic phase as well?
These areas are actually covered by SRTM.
Which have you selected so far? Please make sure that you have installed the latest update and also select SRTM 1Sec HGT (AutoDownload) during the topographic phase removal in the interferogram formation.
When you select “Output Elevation” you can check the quality of the downloaded DEM afterwards.
At least the topographic phase removal works according to your screenshots. Maybe the phase changes too quickly over these areas?
You can try if a data pair from another looking detection has less artefacts here.
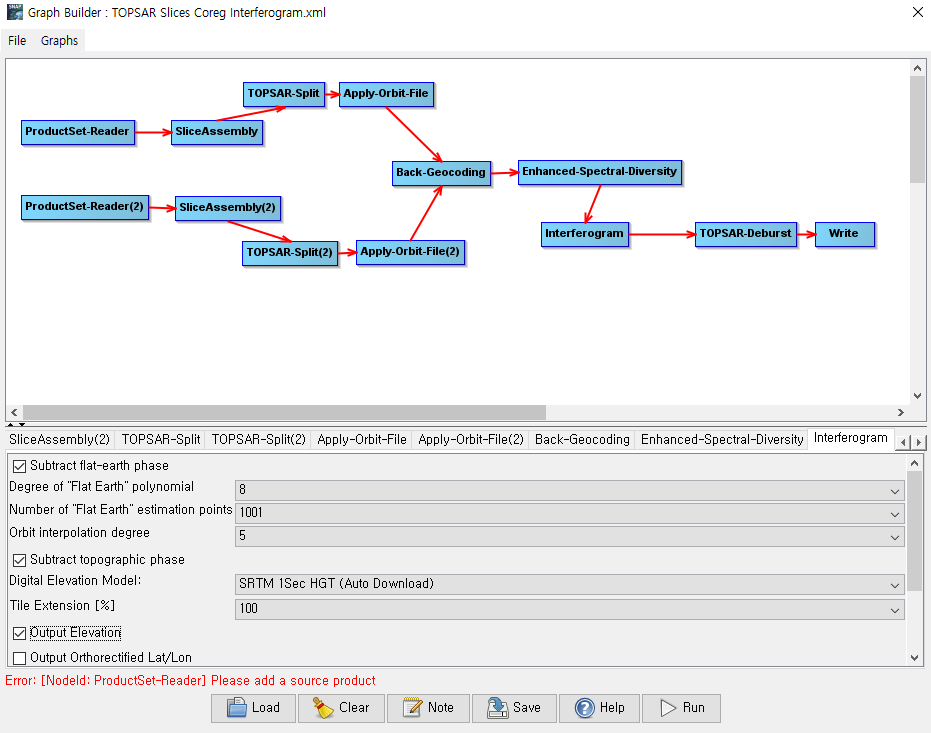
I don’t recommend graphs, they often take longer than processing the steps iindividually and do not allow to check for errors along the processing chain.
The rupture causes a phase-incontinuity of course, since the ground can move multiple wavelenghts and even meters compared to the other side of the rupture.
Hi dears,
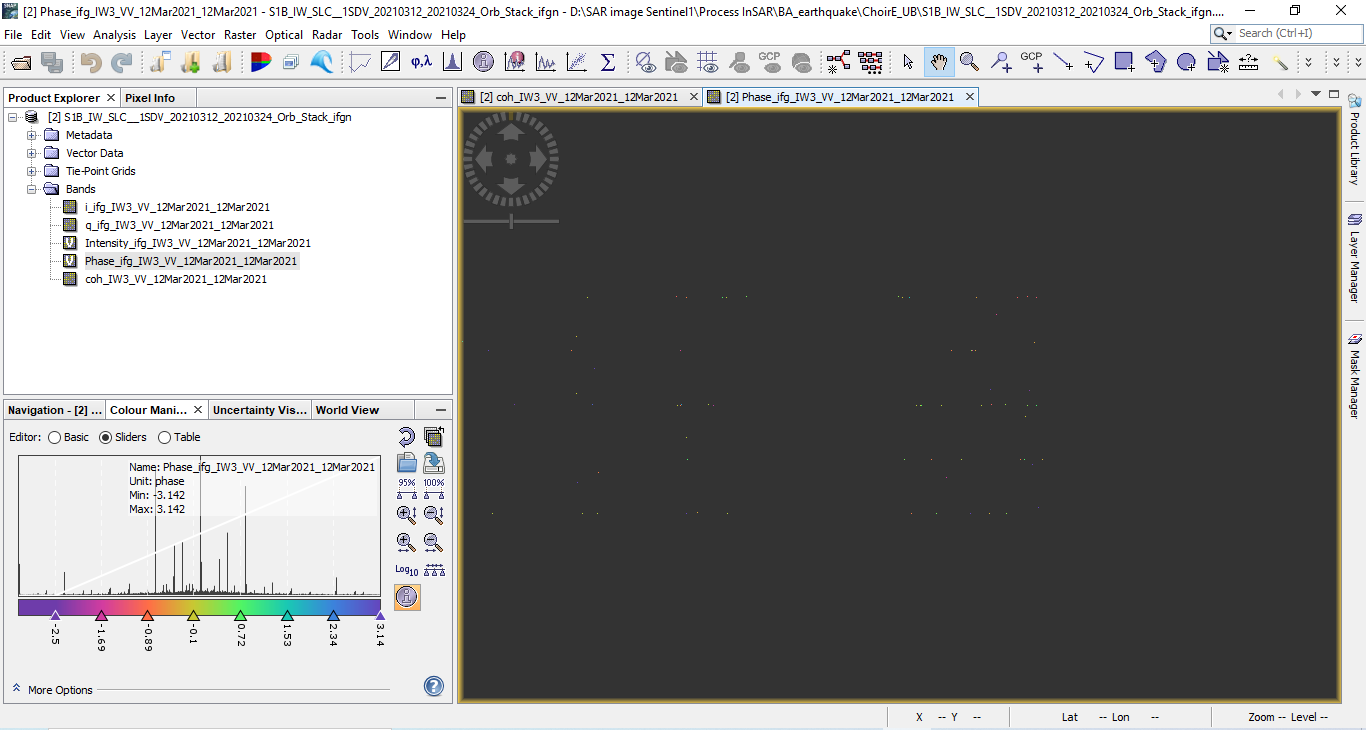
After do interferogram “phase_ifg_IW3_VV_…” file of bands when open image window to be almost full dark scene and somewhere can see just few colorful pixel on display.
Someone please explain to me what is wrong did?
could it be that the coregistration failed?
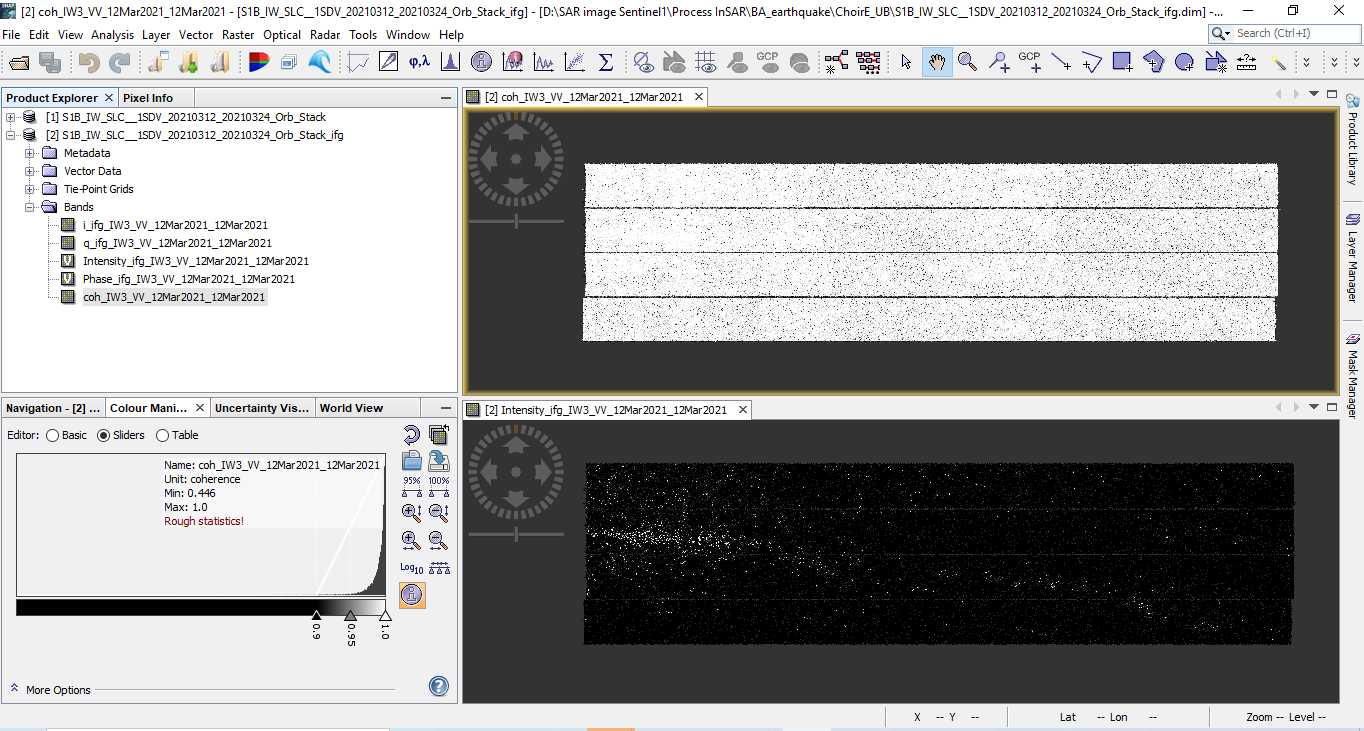
For Sentinel-1, you first apply BackGeocoding, visually check its quality, then proceed with Enhanced Spectral Diversity. Only if these two have produced a proper result, you can proceed with interferogram generation. Does the coherence look the same?
Yes Sir, I did first master and slave images apply S1 TOPS Coregistration with ESD then next proceed to interferogram generation. Please see coh& intensity of bands