Dear all,
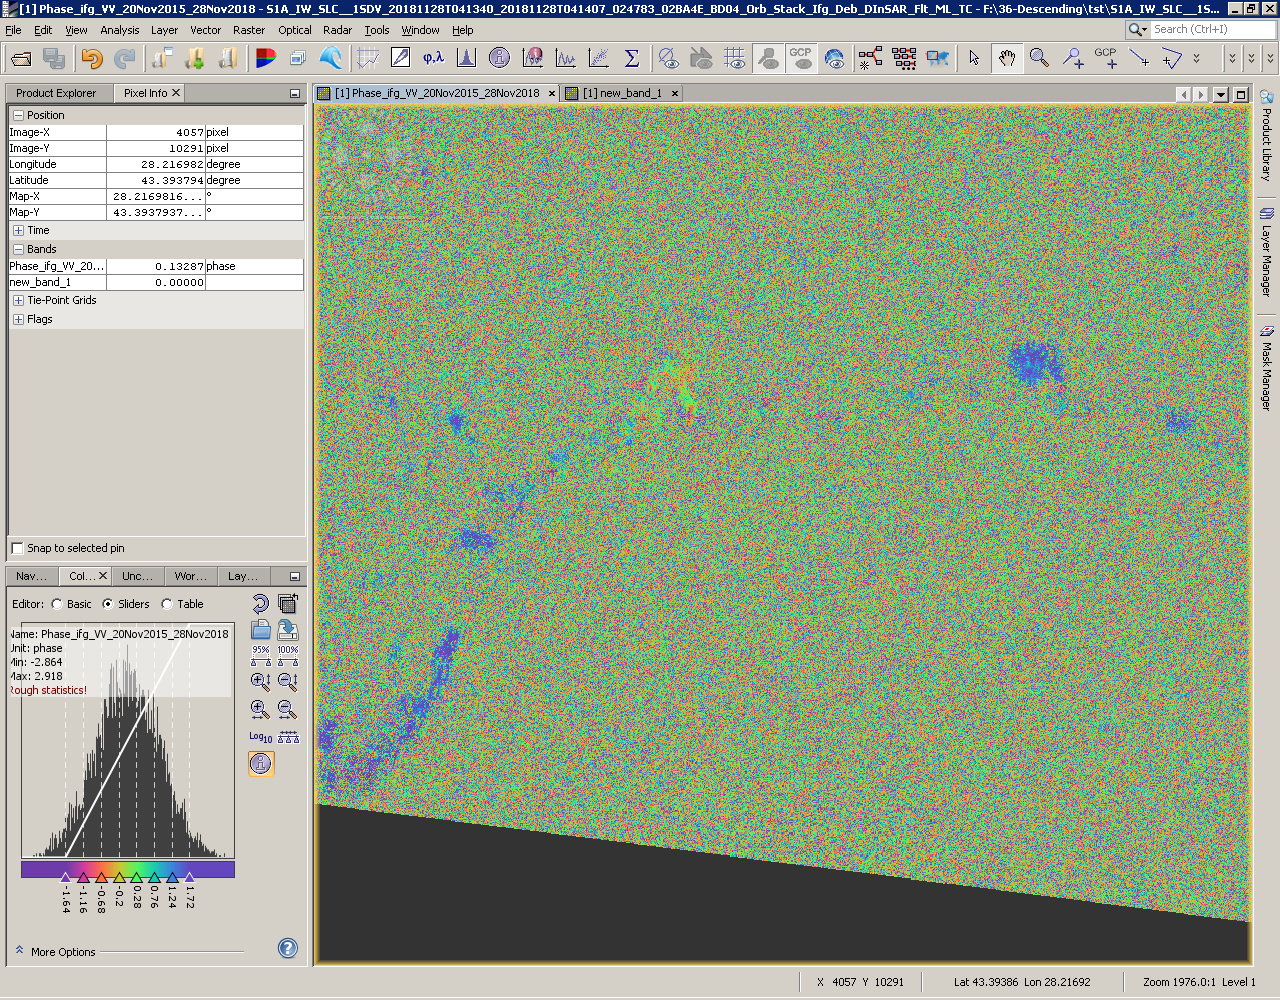
I wanted to produce interferometric image for coastal area concerning large period of time 2015-1018. I expected to have reasonable results since landslides activation has been reported in media.
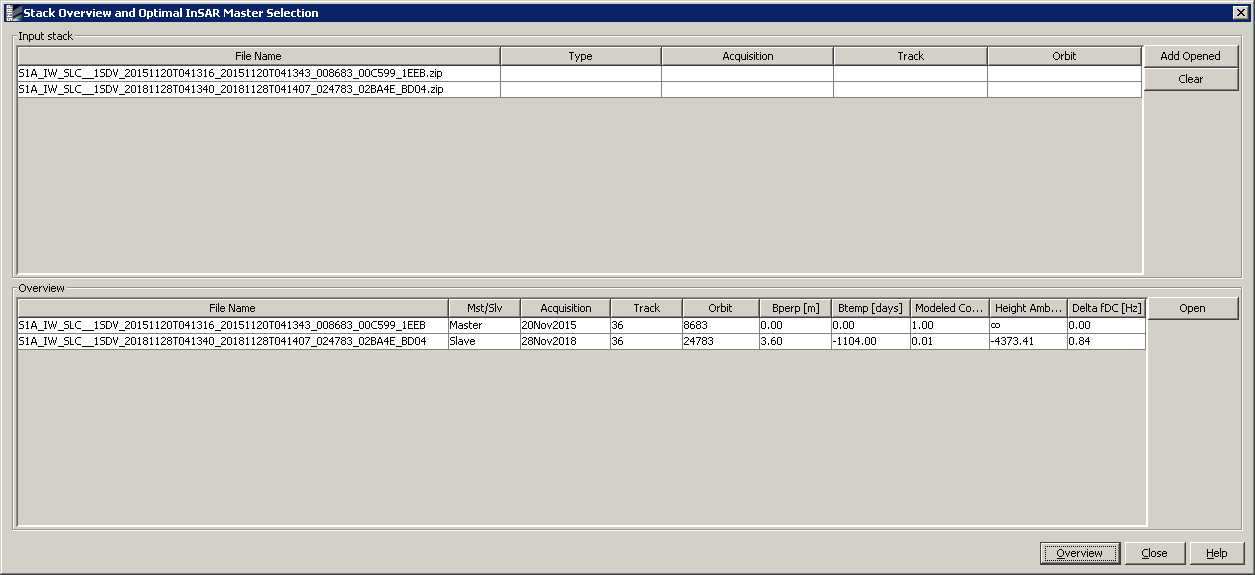
The SAR data was selected to be from almost same dates and same sensor.
Phase unwrapping with Snaphu will not give useful results when only a very small portion of the scene is coherent, as with your 3-year Sentinel-1 interferogram. You will probably need to form interferograms over shorter time intervals to get adequate coherence and then use some type of time-series analysis to combine the shorter intervals into long-term measurements.
@thho Thank you for being kind to provide me your thesis. With regard to StaMPS I can not use it since lack of Matlab license. I hope soon in SNAP this approach will be implemented as they did for SNAPHU.
I have found this to be exactly the case also. I have tested it by comparing results from a long time interval and shorter time intervals within the original long time interval. The long time interval shows nothing is happening, but shorter time frames can show a very reasonable time series. The only way a longer time interval may work is if a different sensor is used (change the wavelength).
Yes, I did not mention the possibility of using a different sensor. L-band will be much more coherent over longer time intervals than the C-band Sentinel-1 data. Depending on the area, there could be ALOS-1 SAR data available from ESA or the NASA Alaska Satellite Facility (ASF). Since I am a member of the NISAR Science Team, I will also mention that NISAR will be acquiring L-band SAR over all land every 12 days starting in 2022.
Yes there’s some other data available through ASF other than Sentinel. Franz is doing a great job up there making data more available. I use that site a lot and highly recommend it to anyone. ASF also has so many good resources to help new folks get started with InSAR processing and concepts.
2022?!? It was 2020, then 2021…
I try to follow what’s going on with NISAR since I attended the 2015 applications workshop, I’m super excited about it.
The NISAR launch date was expected in December 2021 since around 2016, due to availability of funds from NASA. They had to move it to January 2022 recently when we changed the satellite from right-looking (northward) to left-looking (southward).
First I’d like to thank all the colleagues spending some time to provide their insight on this topic.
I also appreciate the job guys are doing in ASF. I’ve found Vertex to be more friendly than SciHub (personal view). Also the baseline option is really nice and could save some time in downloading only the
images one need (task dependent).
With regard to L-band the reason I can not use it is that ALOS data I have are from ESA archive ALOS-1 mission. For the project I’m currently working on I need data from 2015 onward.
@dsmilo Could share your time series both short and long intervals
@tleyvap Actually there are several landslides almost overlapping . i have no data about the depth, but I guess is about 30m or so. Unfortunately there is a lot of vegetation - this is the reason to work with winter and autumn scenes. As far as I know all the areas I’d like to study are active.
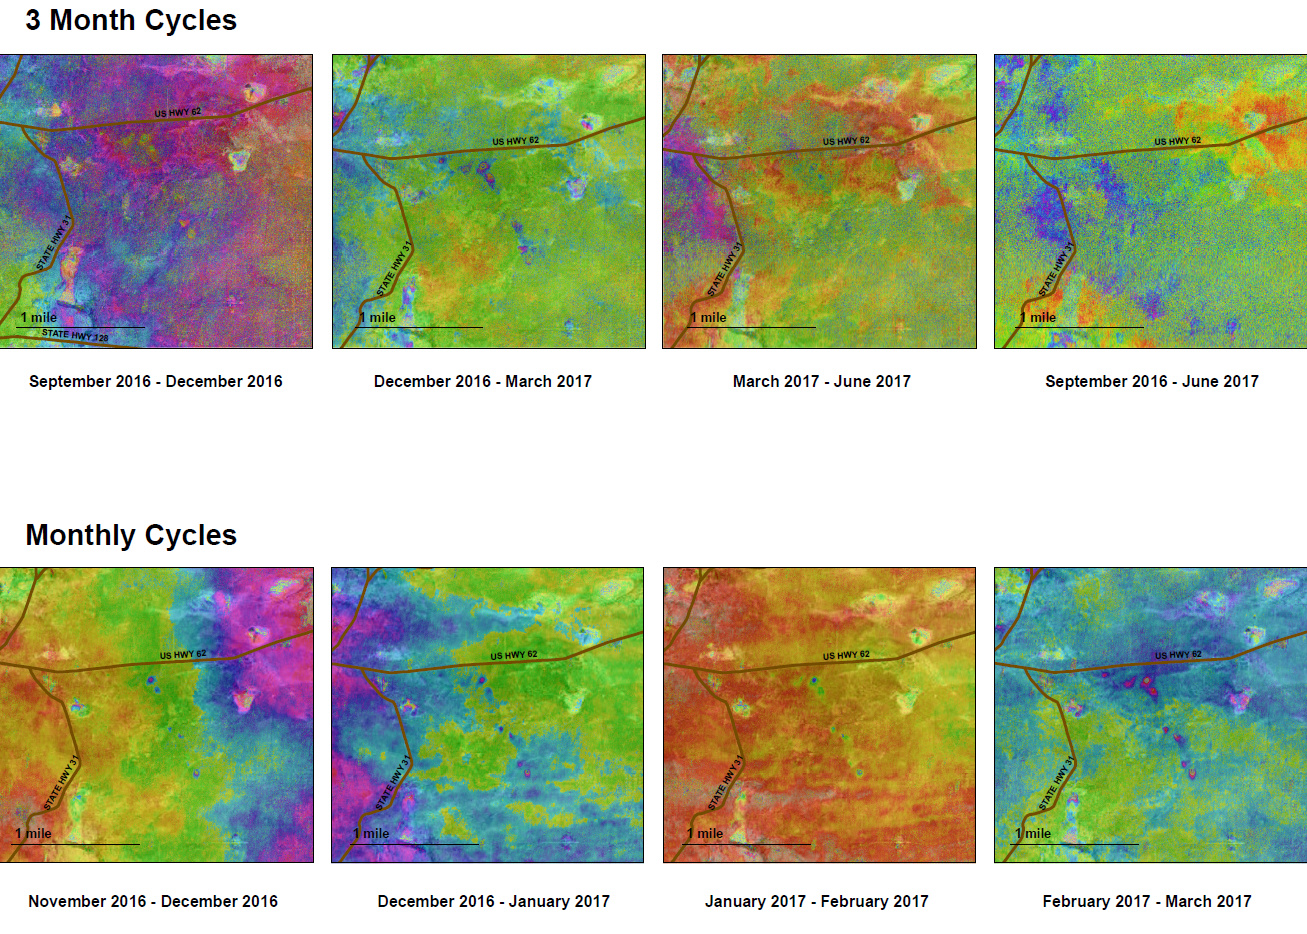
sure. First Image: You can see the September 2016 to June 2017 interferogram showing nothing happening in the center of the image. But if you break up that 9 month period into 3 month intervals you start to see features. The ground may be moving faster than the sensor can capture, so I broke up the 3 month intervals into monthly intervals to see the difference. This is all using Sentinel data.
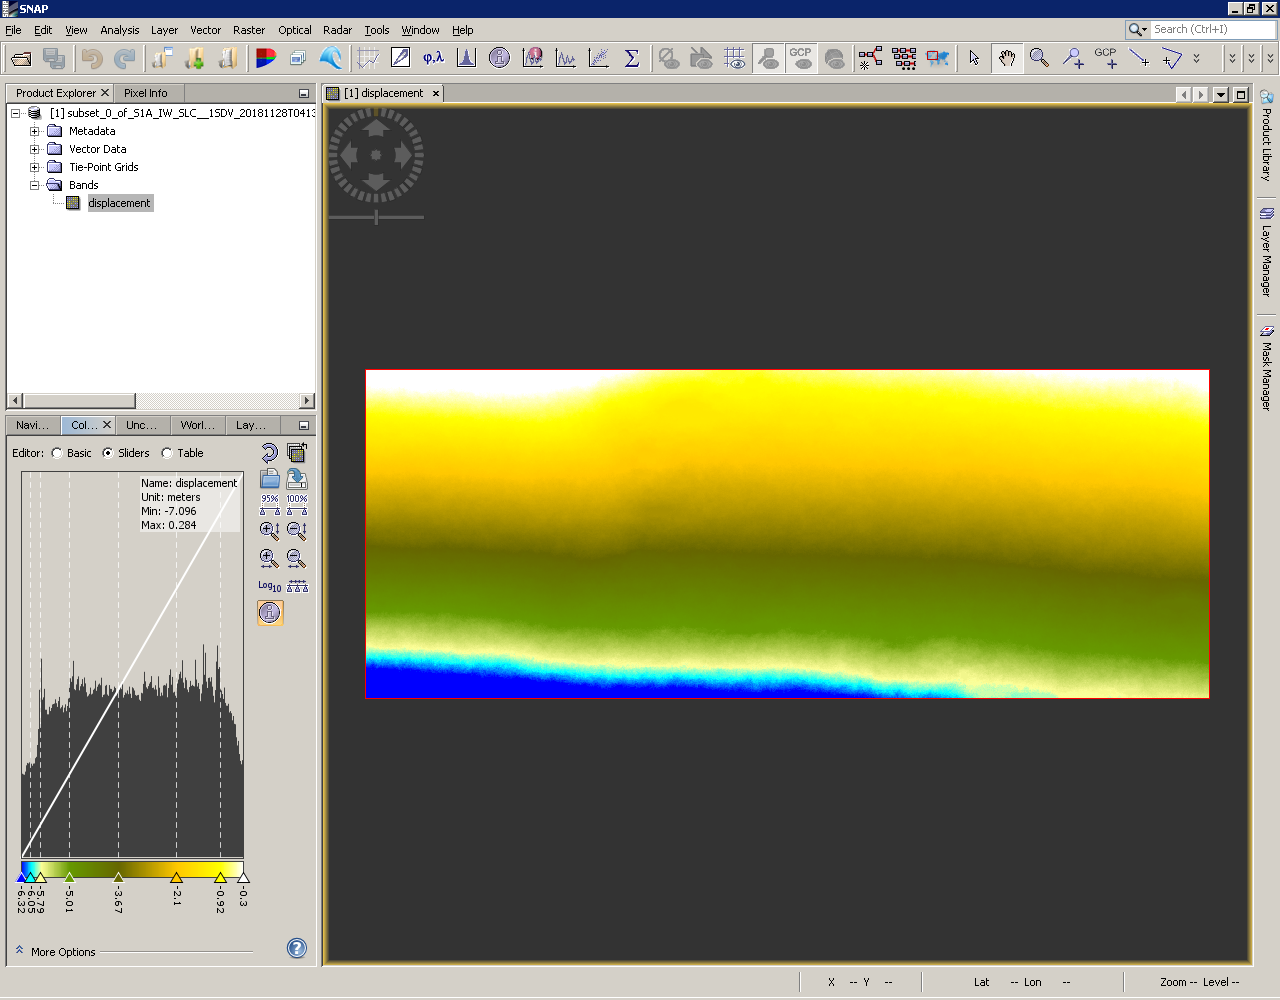
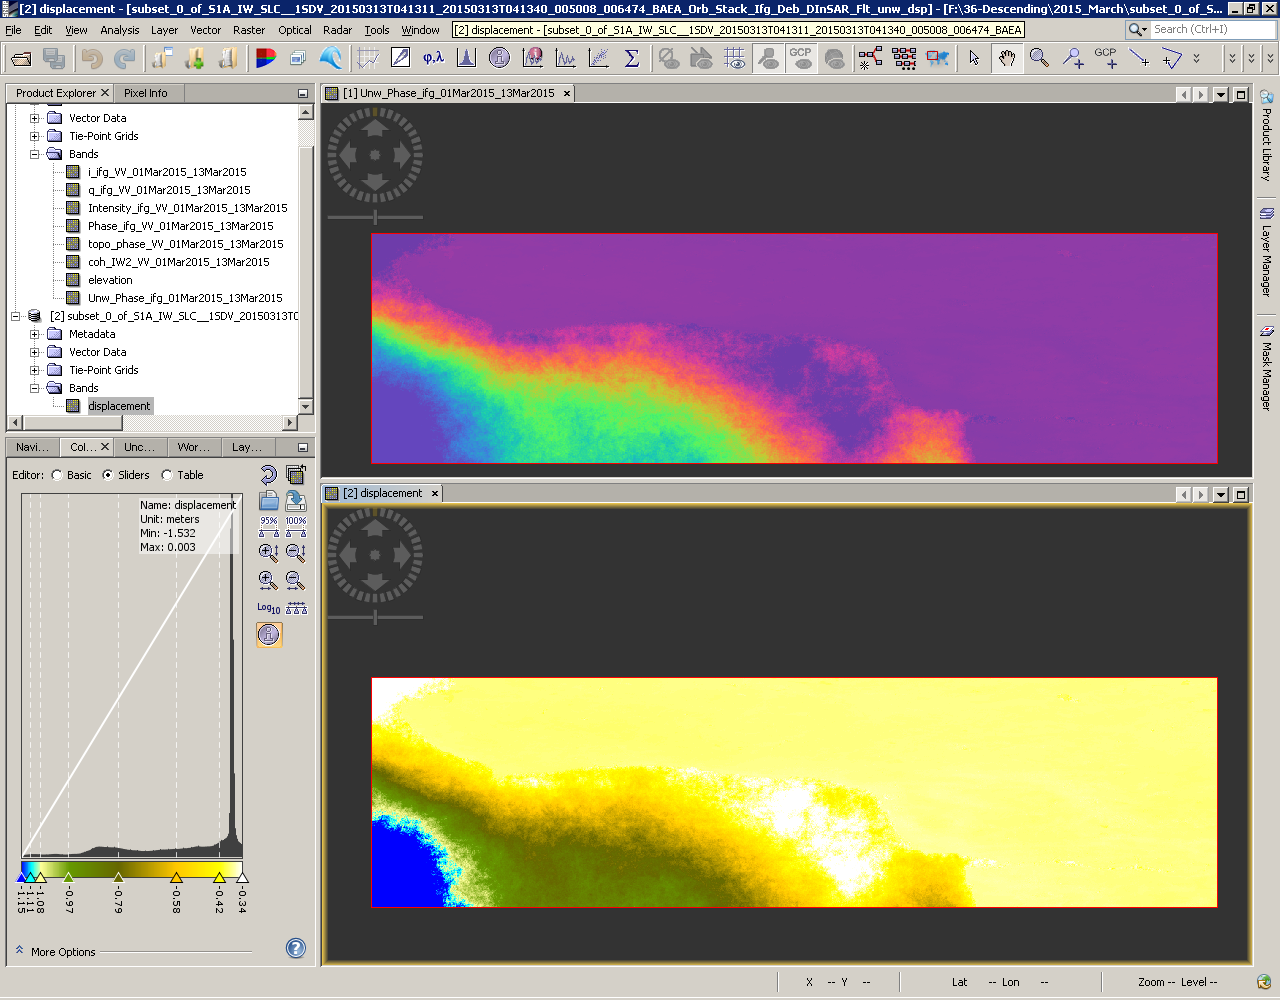
Second Image: I did a similar study but more to identify when a failure occured and model the behavior of the failure. This was also using Sentinel data.
I wish I could share more about the studies, but I can’t. I did a lot more with the data to develop profiles, contours, and deformation time series models, ect.
@dsmilo Thank you for giving your expert view on the subject. I will try to take advantage of it.
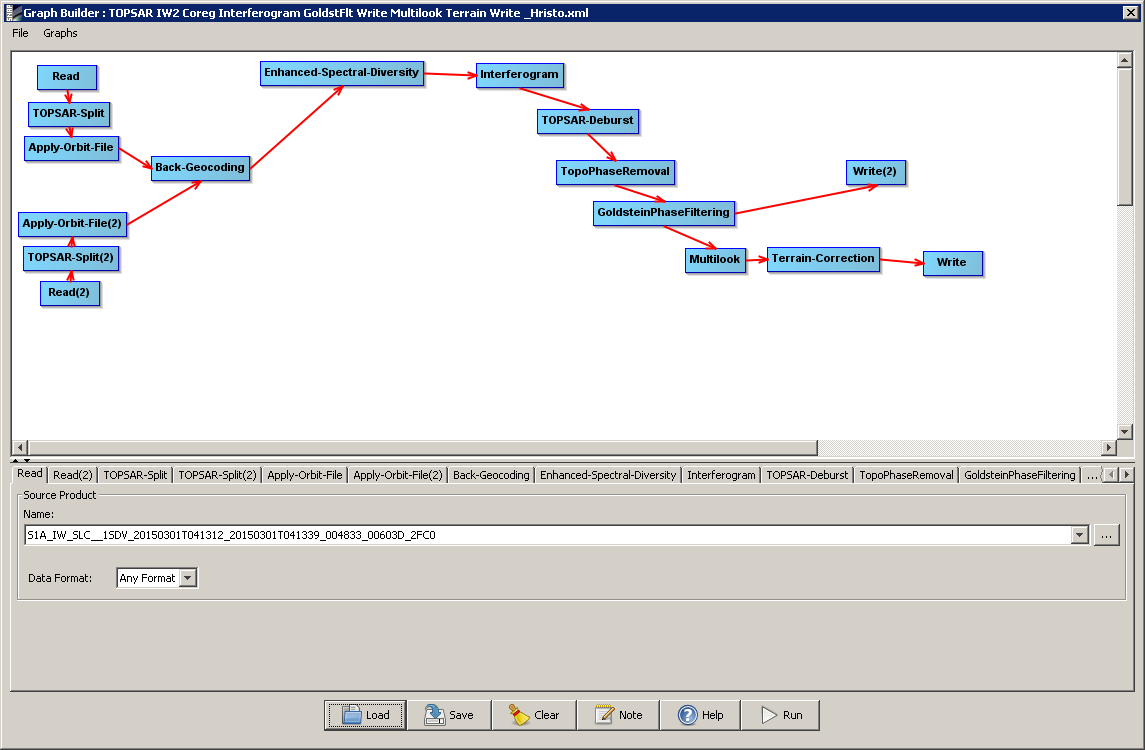
Could you check the graph I’ve used, please. Is it OK?
I don’t think there is anything wrong with the process you are following, however, I would definitely use shorter time periods. It would also be good to subset your data to remove areas you don’t care about for this study. Have an extent that covers your area and allow a buffer area so you can have some context as to where areas are moving and aren’t moving. As you are analyzing, it would be good to get some survey data or some kind of geologic data showing that the area is behaving like a landslide. It’s good to have a few datasets telling the same story; data backing up data is always a good rule of thumb and a good gut check that you have reasonable data that makes sense.
@dsmilo Thank you for your suggestions. The data I download are from different frames this why I have process the whole IW 2. After that I make a subset. The area I investigate has several drawbacks - vegetation, steep slopes (almost vertical), being at the sea shore so high water vapor which is distorting the radar signal. With regard to the geological and geodetic data I could say that I have some information from colleagues and local media since the landslide areas activate periodically. I cannot be explicit since this is project I work on at this moment.
what exactly is telling you this is in fact an unsuccessful product? Have you applied terrain correction and looked at the result in a GIS? Do you have some expectation of where change should be detected given the time period you picked?
Right after you ran the coregistration (the first step), did you check the coherence statistics? Was that number closer to 100 or 0?