Thank you Iveci,
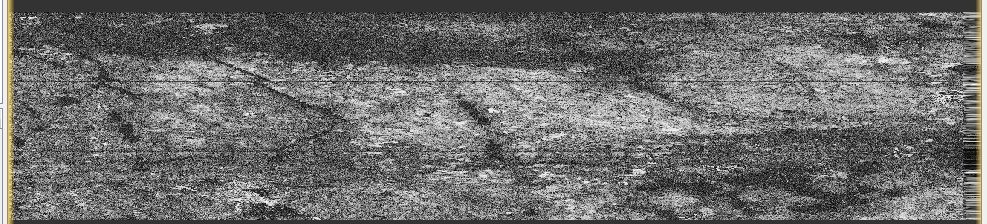
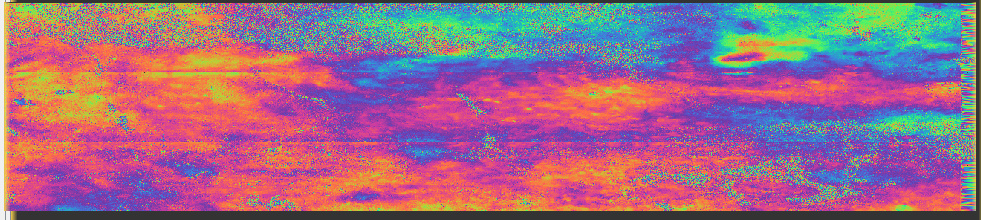
I tried with numerous InSAR pairs. The best result is obtained from theses days:
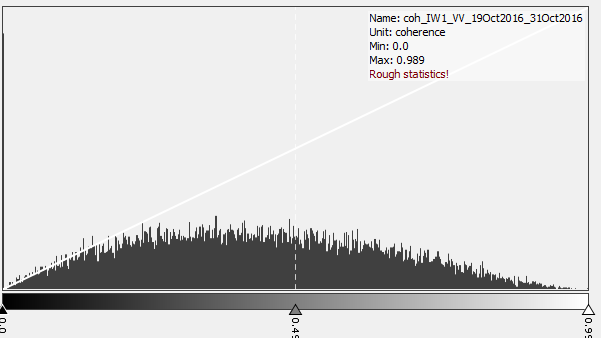
I still have a noise on the phase image. There is a way to improve the result? Or I have to hide (mask) it?
Tha
Thank you Iveci,
I tried with numerous InSAR pairs. The best result is obtained from theses days:
I still have a noise on the phase image. There is a way to improve the result? Or I have to hide (mask) it?
Tha
Hello,
I am not sure if you are following the tutorial for interferometry with TOPSAR, I think you can doGoldstein phase filtering and this will work.
But I am aslo novice. Can you tell me about your experience. Have you been able to assess your co-registration? which parameter did you used?
Hello Sir,
Yes, I followed the tutorial. First, I i did a co-registration with the default parameter. Then, I applied a range/azimuth filtering.
Then, I generated the interferogram / coherence. Finally, I applied the Goldstein phase filtering.
The study site is a bit complex (forest).
Please see my last discussion (a bit higher)
Thank you
Hello,
Any insights on the results mentioned aboved???
Kind Regards.
Hello,
there is a coherence threshold commonly used in order to mask the InSAR product?
No, that is very application-dependent. In land-cover classification for example low coherence is “signal” so one should not mask it out, while in applications where phase-unwrapping is needed, masking low coherence values out makes sense.
How about Gamma0? If I use SAR for forest monitoring, I should use Gamma0 or Sigma0?
If you have strong radiometric distortions from topographic features, you can also correct for Terrain Flattened Gamma0 in SNAP.
Have a look here:
Hi, DanielaPL!
I came across this post to learn about how to work with intensity and intensity correlation using SNAP with Sentinel-1 SLC products.
With regards to these kind of analyses, I am quite novice. Been doing for almost a year InSAR-based analysis specifically deformation estimation.
I just want to ask if you have a good tutorial material(s) on how to do these intensity and intensity correlation analyses?
I wonder how do I get intensity in the first place? I’ve been reading and following through this thread but I couldn’t figure out exactly an appropriate processing chain to do it.
I hope you can share what you have learned, your best practices.
Thank you in advance for your time.
Hi, @lveci!
I came across this thread to know the best practices for intensity (amplitude-based) analysis. I am interested about this kind of analysis for landslide mapping.
I am working with Sentinel-1 SLC data through SNAP.
I just want to know if the processing chain I came up with (after following some discussions here and there) is correct or needs modification. I wanted to get the intensity ratio (I_ratio) which is 10.log 10 [(E{I_pre-event}/E{I_post-event})]. The processing chain is like this.
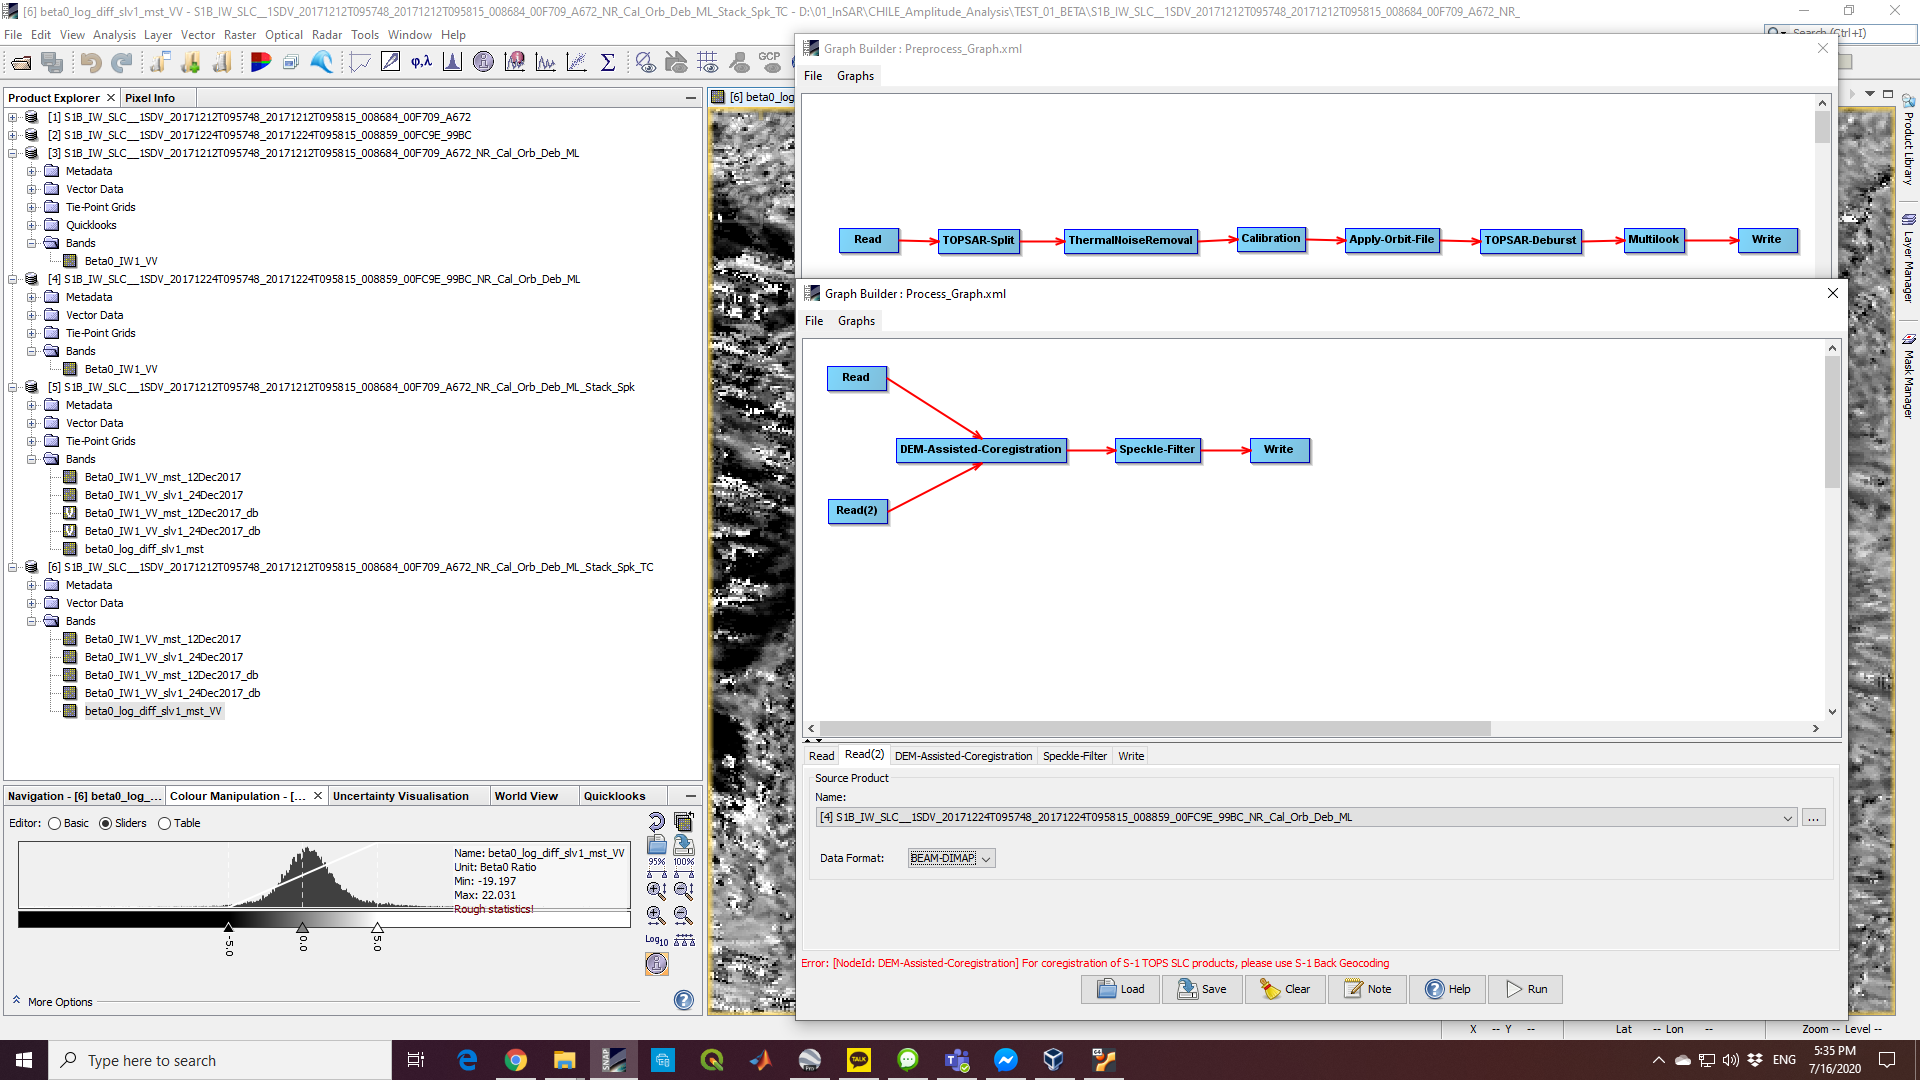
Through the GraphBuilder tool:
Read–>TOPSAR-Split–>Apply-Orbit-File–>Calibration–>TOPSAR-Deburst–>Speckle-Filter–>Multilook–>Write (Save)
Then I applied this processing chain to my 2 S1 products through the Batch Processing tool.
The returned products contained the Sigma0 band whose value ranges from almost zero (0.001) to more than 10.
I then co-registered the two Sigma0 bands using a DEM-Assisted Coregistration (the Sigma0 bands were affixed by suffixes _mst and _slv1 whose values still ranges from almost zero to more than 10), and finally applied Terrain Correction. For the terrain corrected products, I noticed that the upper range of the Sigma0 bands went below 10. I just wander if this is a normal thing. But still I proceeded. By this I mean viewing the Sigma0 bands in decibel scaling. The range now in dB is between -25 and +10. And for my last step, I applied Band Maths to get the ratio of the 2 Sigma0 bands expressed in dB.
I applied subset just to focus on my target AOI. Unfortunately, I didn’t get a good result. But the reason is I just tested the flowchart I have built out of the discussions here and there on intensity analysis.
I hope you can comment about it if I did it correctly or if something is wrong with my processing flow.
Thank you in advance for you time.
Hi, @ABraun!
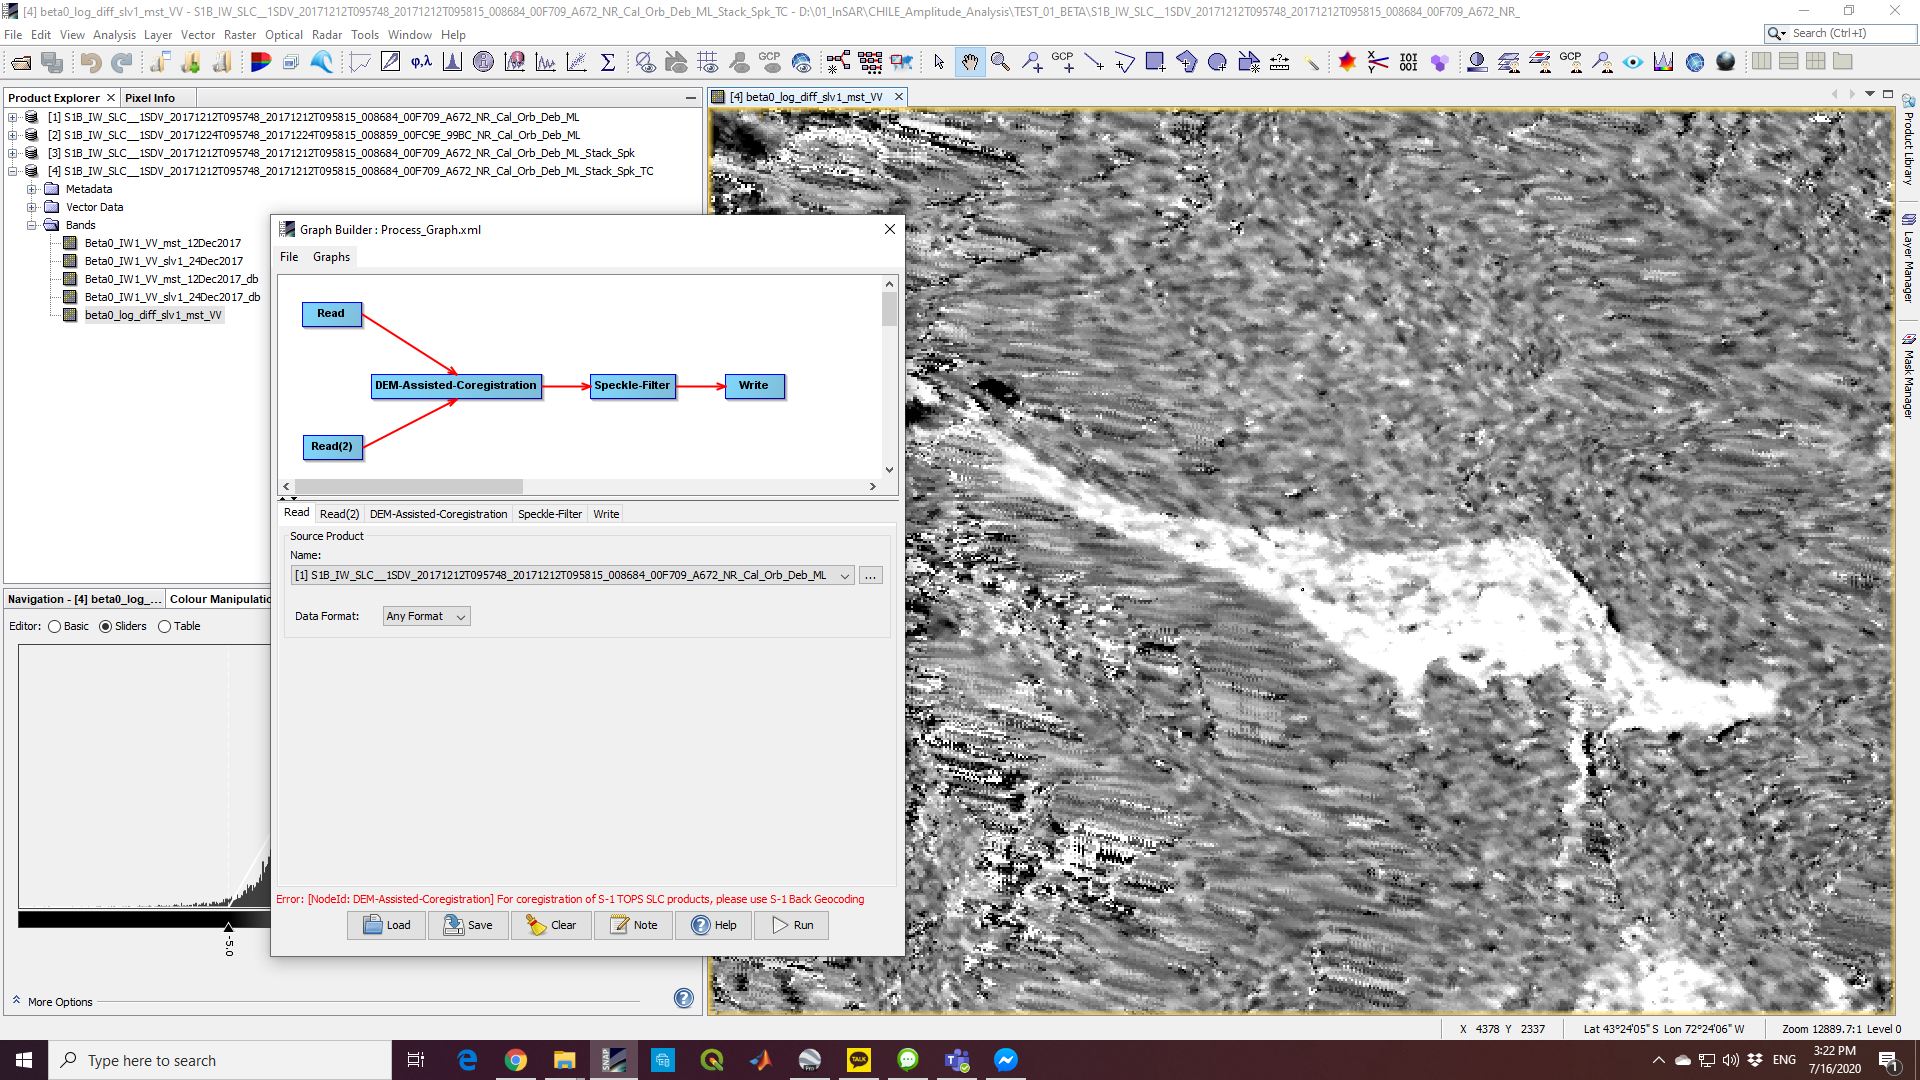
Just a quick question. I did amplitude analysis before (few months ago) for some sites presented in the paper of Mondini et al. 2019 (Sentinel-1 SAR Amplitude Imagery for Rapid Landslide Detection). One site I was able to reproduce the result was the Villa Santa Lucia landslide in Chile. Please see screenshot.
I wanted to apply the analysis method for a specific test site today that is why I recalled the process of how I did it for Chile few months ago. After loading the dataset I’ve used for Chile and the graph, I was surprised that it returned an error.
Do you know what is the cause of this error and how can I resolve it? I am sure I was successful with the amplitude analysis few months ago while exploring it. I had reproduced also the results for the Maoxian landslide and one in Iceland also from the same paper.
Thank you.
Maybe you used Back Geocoding for the coregistration?
I’ve checked all the Preprocess_Graphs I’ve created using the GraphBuilder tool for the 3 sites I’ve mentioned here and I used the DEM-Assisted-Coregistration. I’ve tried to replace it with the Cross-Correlation coregistration, unfortunately it does not give me a stack.
I am aware that after the error it suggested to use back-geocoding instead. I did it but I got another error.
Error: [NodeId: Back-Geocoding] Input should be a single look complex SLC product.
I find it weird because I exactly followed the processing steps from the paper of Mondini et al. 2019.
In the name of your pre-processed images, there is NR - what does it mean?
ThermalNoiseRemoval. NR was automatically added as a suffix after my (batch) pre-processing step.
I see. I don’t get why it shouldn’t be taken as a SAR product. Have you selected BEAM DIMAP as output format?
Did you have a look at the image after preprocessing? Does it look alright?
Yes. I always select this one as the output format.
Yes. I always check the output of the pre-processing step (i.e., products 3 and 4. Products 1 and 2 are the *.SAFE files).
It’s really weird to me.
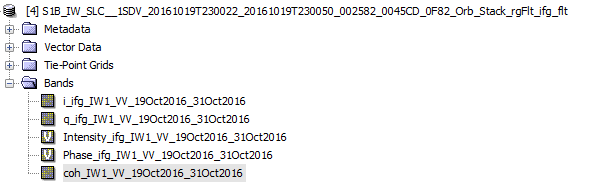
Has multi looking always been a part? Does the preprocessed product still contain i and q or only intensity?
It’s hard to search for errors without knowing the details.
For the 3 sites I’ve tested few months ago, ML is always part of the pre-processing. The preprocessed products do not contain the i and q data. They only contains the Beta0_IW1_VV data. Please see screenshot.
I’ve also included my preprocessing chain.
It is really weird! I am doing it in SNAP now installed in my Ubuntu (via VM). The error does not appear and it is processing now.