I don’t know. Let me test it myself.
Only the yellow phase is retrieved, however the blue line not
Just to go sure I’m not missing a point: You have to apply the equation twice, once for 04/16Jul and once for 16/28Jul.
This is what I did:
- Download 5 Sentinel-1 SLC products from South Africa between October and November 2018
- Coregister four pairs of images with a temporal baseline of 12 days (TOPS coregistration, IW3, burst 6-8)
- Create Interferograms of the four pairs
- Multi-Look the four interferograms
- Coregister the four products using DEM assisted coregistration (13.10.18 as master)
- Recomputation and averaging of the interferograms (writing it to “phase_average.img”)
I tried the Snaphu export of the interferogram with 13.10.18 as master from step 3 and replaced the exported phase by the average phase (renaming it) but snaphu doesn’t like it because the products have different dimensions and pixels.
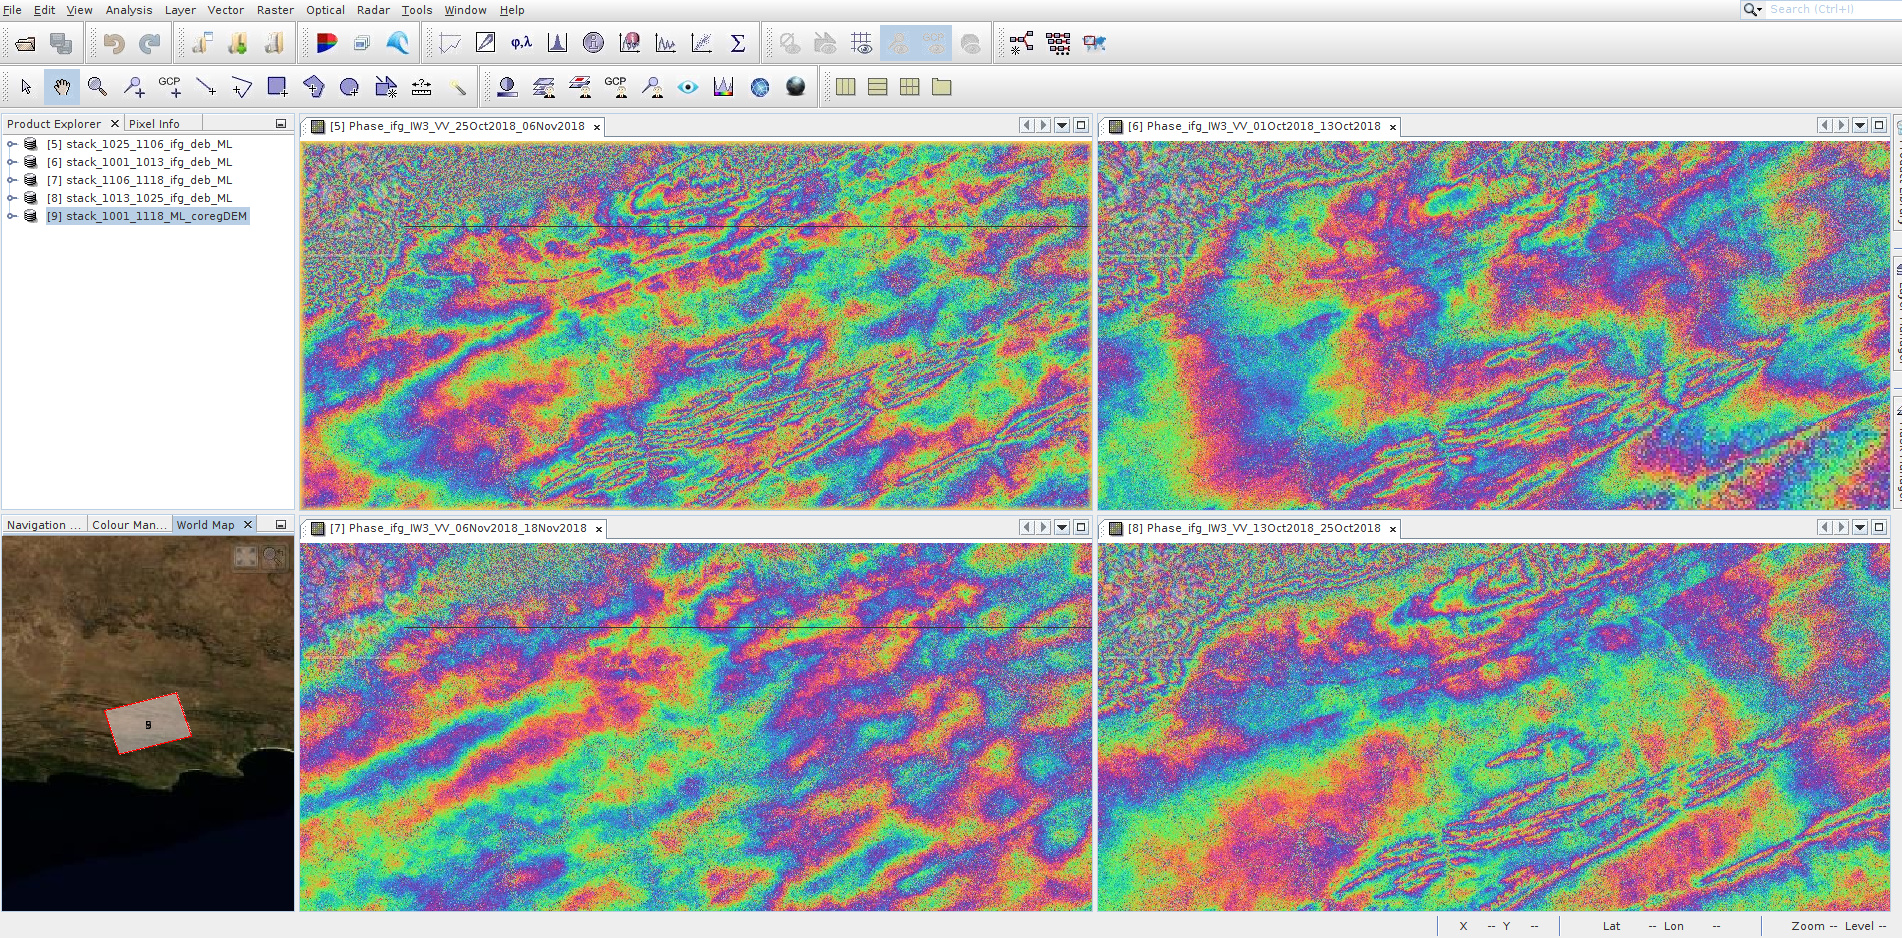
These are the four interferograms:
(step 3)
RGB of three coherence rasters shows that they are uniformly low at some areas but the colours indicate that quality could be complementary:
(step 5)
After the coregistration, phase bands were lost, so i re-computed them using the band maths: phase(i,q) Creating phase1, phase2, phase3, phase4:
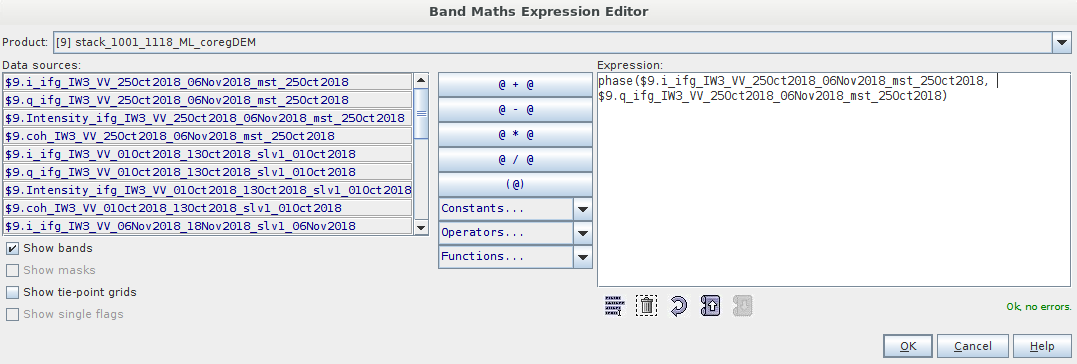
(step 6)
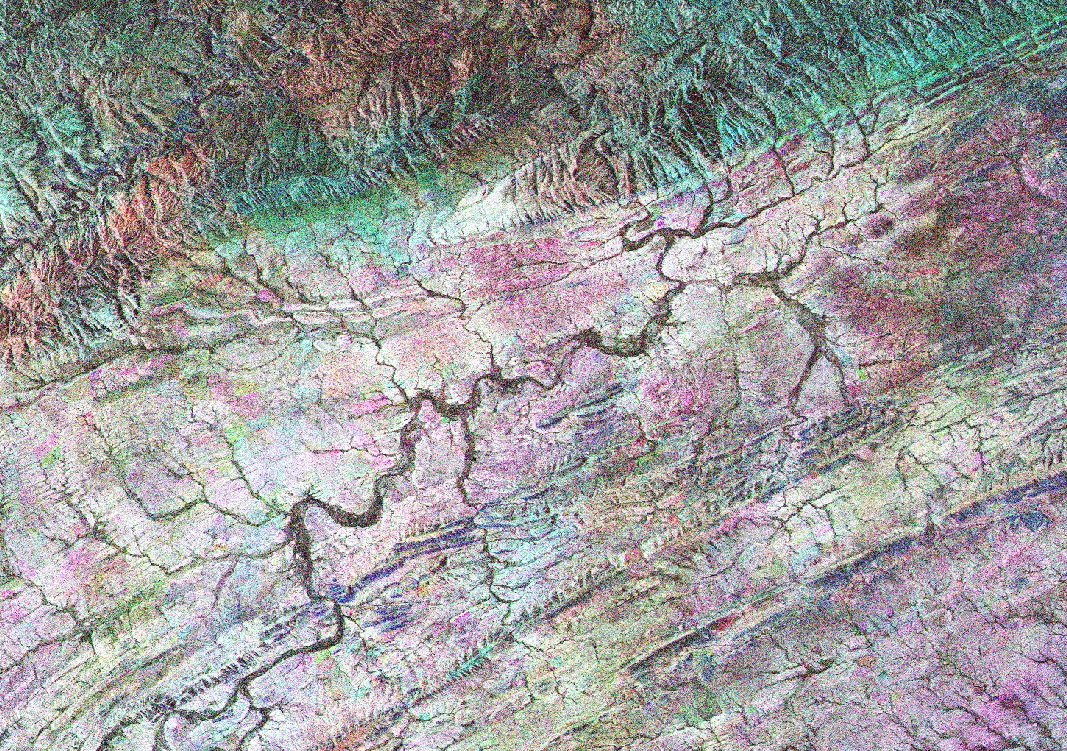
Averaging these interferograms:
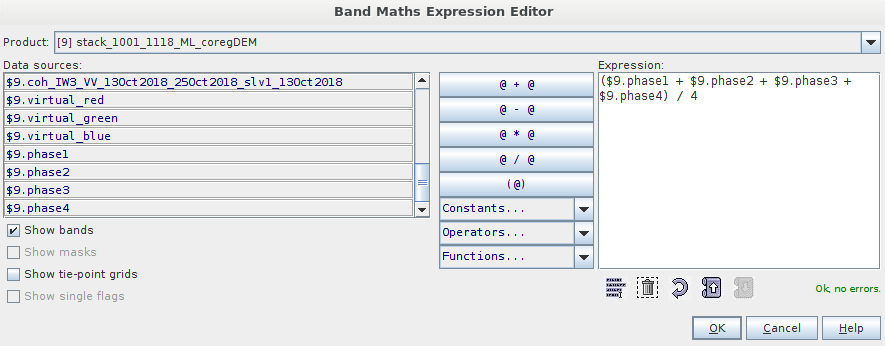
(step 6)
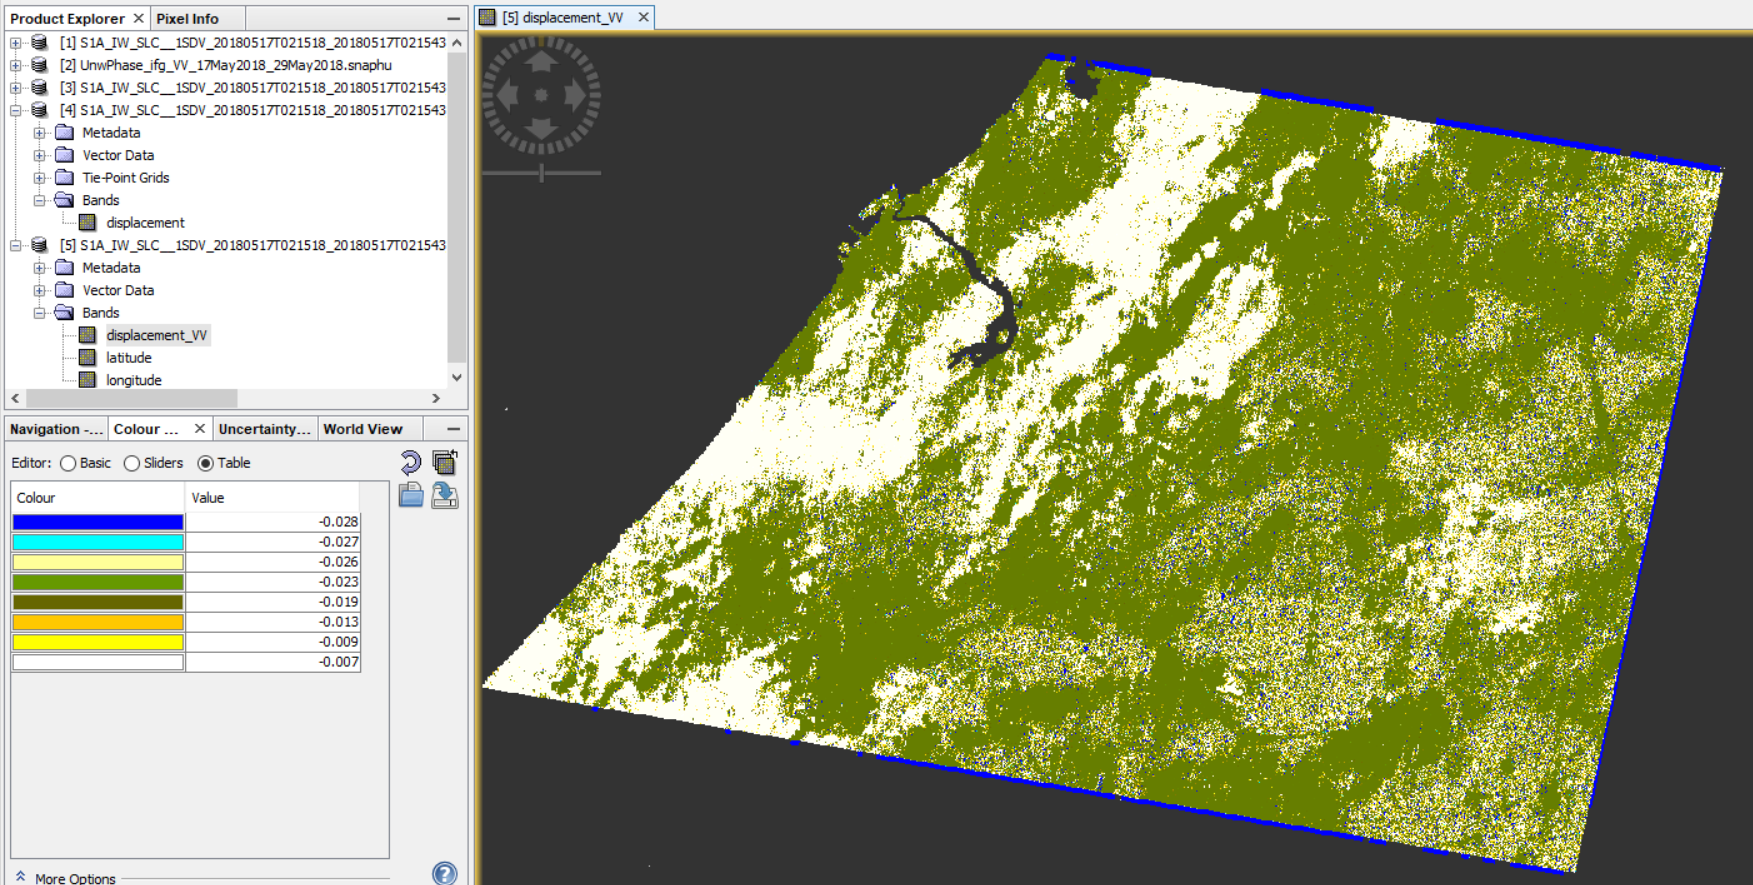
This is the result: Although the values are within a reasonable range, all fringes are lost.
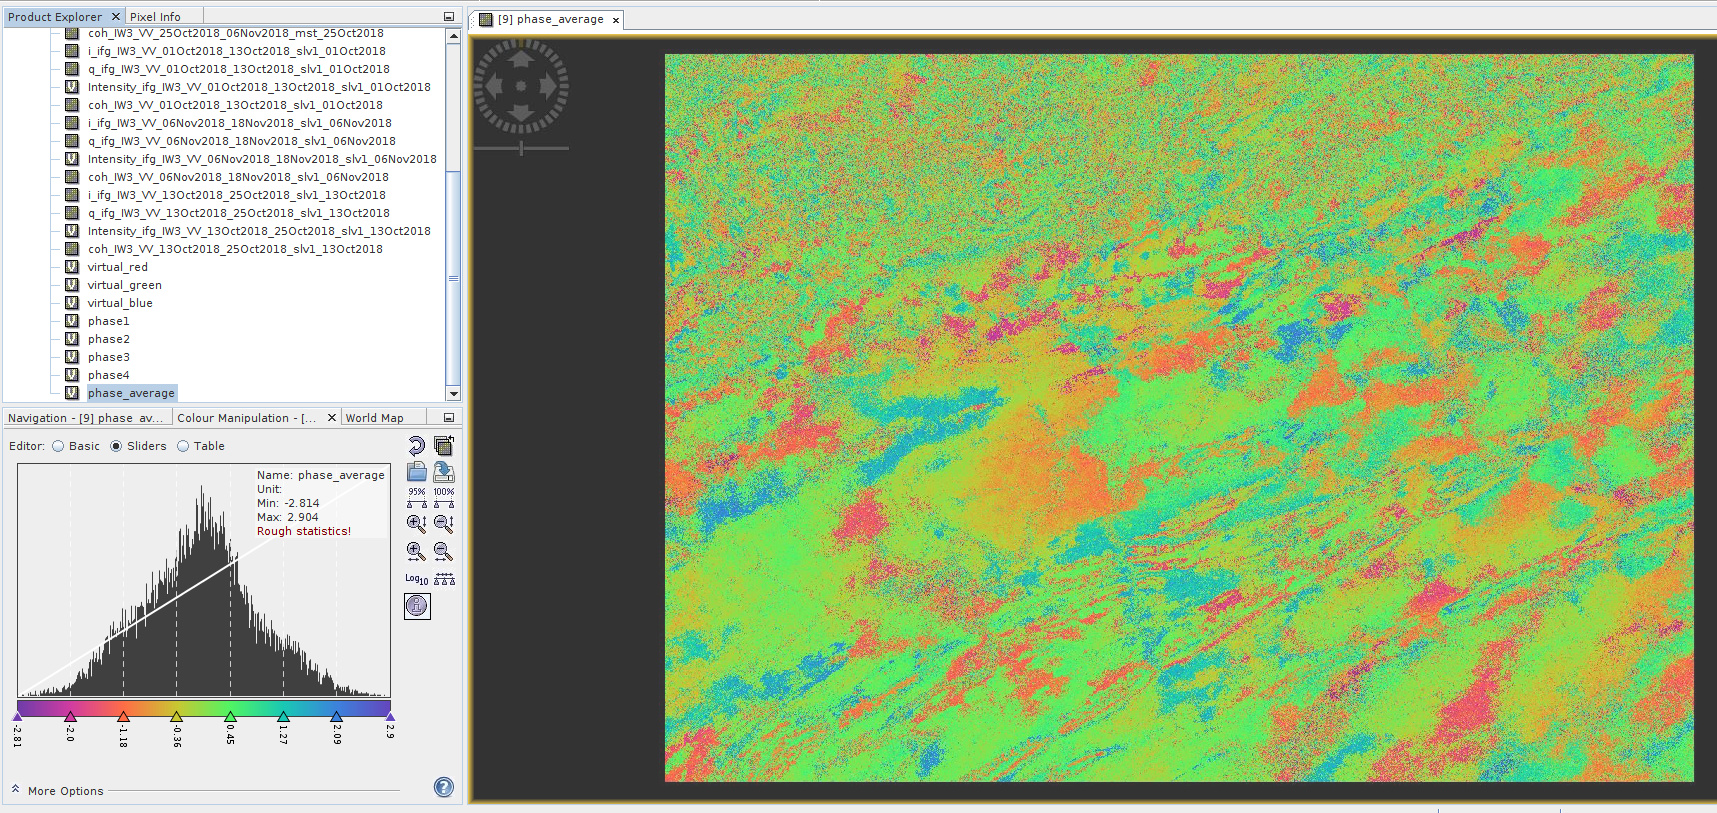
(step 6)
In the end it’s not very suprising because all interferograms were generated under different acquisition geometries, baselines ect.
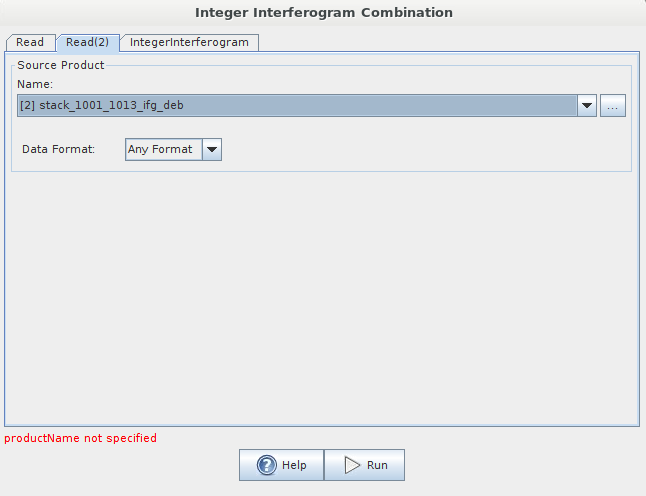
This is where the Integer interferogram module could help. Unfortunately, I didn’t manage to get it to run - it says: Two interferogram products are expected. If I enter the same interferogram twice, no error occurs but that makes no sense.
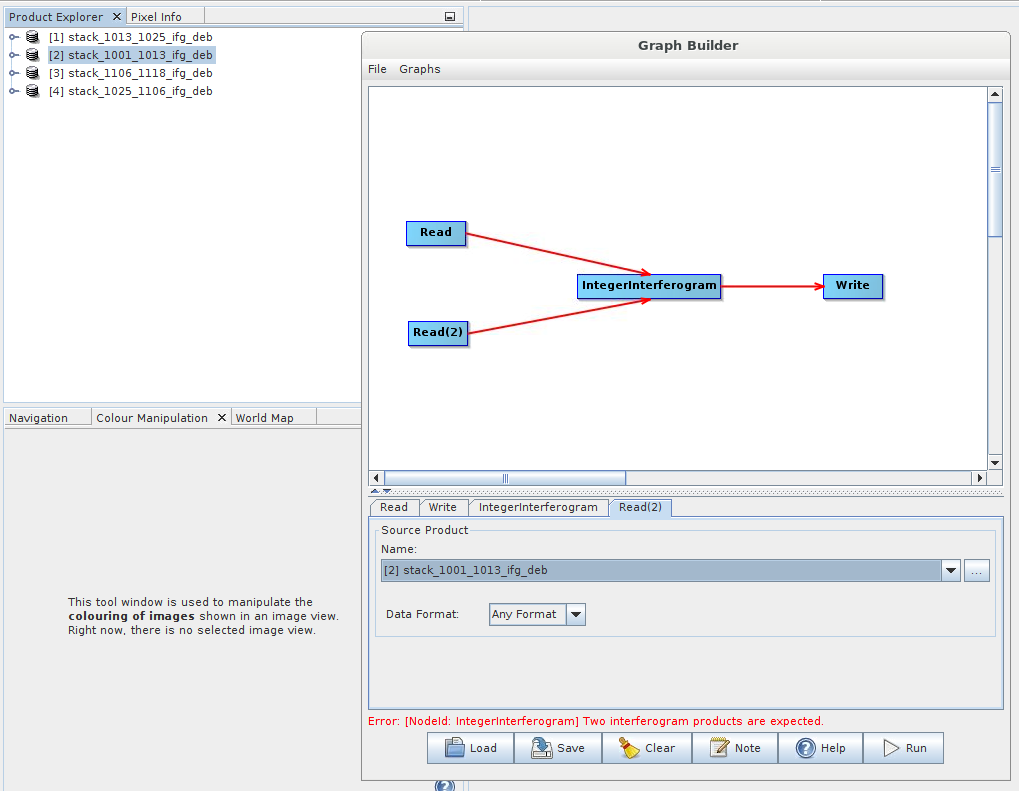
The GUI also throws an error:
2 Likes
I’ll give a try, have a very nice weekend.
I confused in this point, I created the “phase_average.img”, but it doesn’t appear in the folder, so how to copy it and replace in the exported phase?
results from band math are virtual in the first place. Use Right-click > Convert and save your product again to make it permanent.
Thanks a lot. But I did a modification to your processing by calculating the coherence average as well, and then I added the the average phase and the average coherence to the inFgrm 05MAY-17MAY, and exported to snaphu, the snaphu has run softly without any problem, might be the average of coherence was the reason according to the relation between the coherence and the unwrapping. I could say that the result is acceptable, the noise are available though, this might be come back to the one infgm with long Bper 90 m. I could say the result of the deformation is accepted in this area.
AGAIN best thanks to you ANDY
My example represents to three infgm the period between 05MAY-04July, no need to implement integer infgm,
I could recommend this procedure to calculate the average stacking of multi infgm, taking in account the Bper, and Btem, to avoid the noises.
very interesting, thank you.
How can you be sure that the averages were used by snaphu and not the phase between 05th and 17th of may?
I renaming and replacing all in the infgm 17.May
I see. So you first included both averages in the ifg product, then deleted the original bands, and then renamed the copied averages accordingly?
Exactly that what I did.
1 Like
thank you - I’ll try that on my data tomorrow 
sorry, I have another question: Did you replace them
a) in SNAP or
b) in the file system?
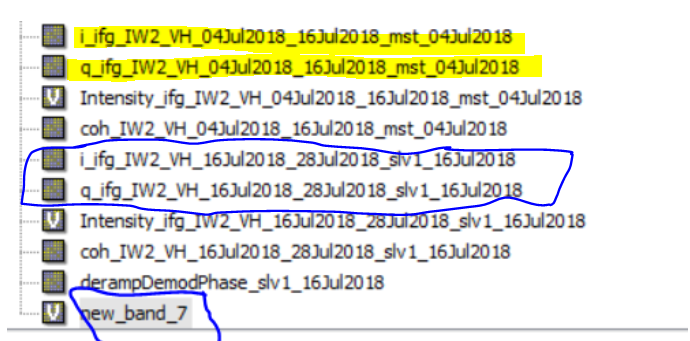
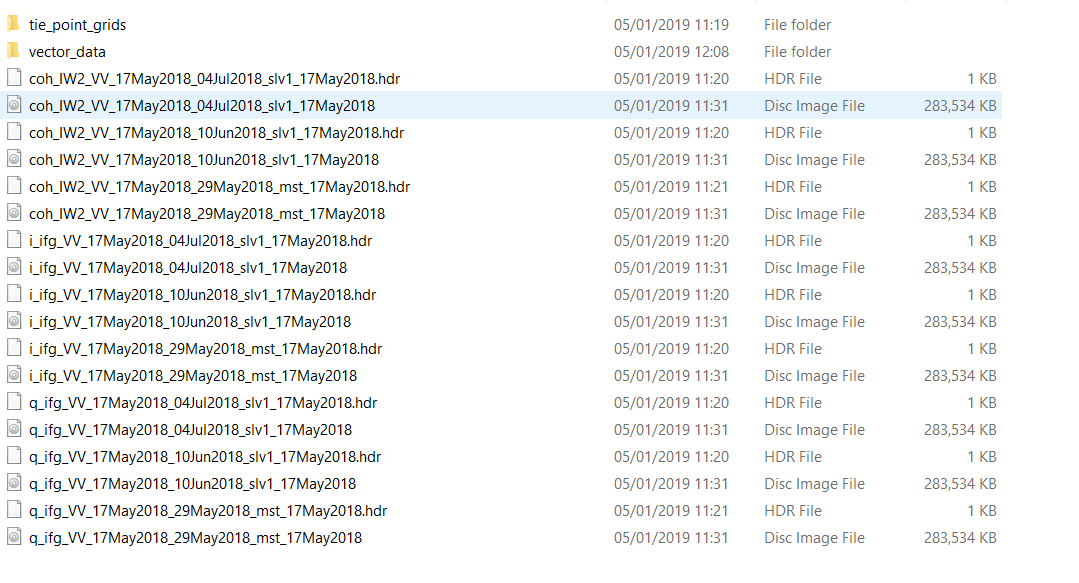
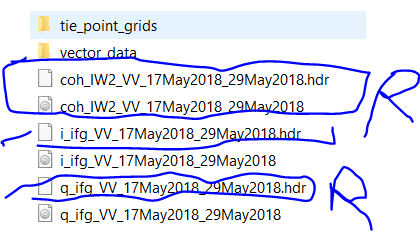
If b is the case: How can you replace the phase by the phase average inthe file system when there are only i and q bands?7
coherence_average.img > rename to > coh_IW2_VV17May2018_29May2018.img
coherence_average.hdr > rename to > coh_IW2_VV17May2018_29May2018.hdr
phase_average.img > rename to > ?
phase_average.hdr > rename to > ?
![]()
![]()
How does that make sense? The header file of i with the raster data of q
The phase average is a raster cosisting of values between -3.14 and +3.14 (at least in my case) while i and q are complex numbers.
Thank you for the illustration.
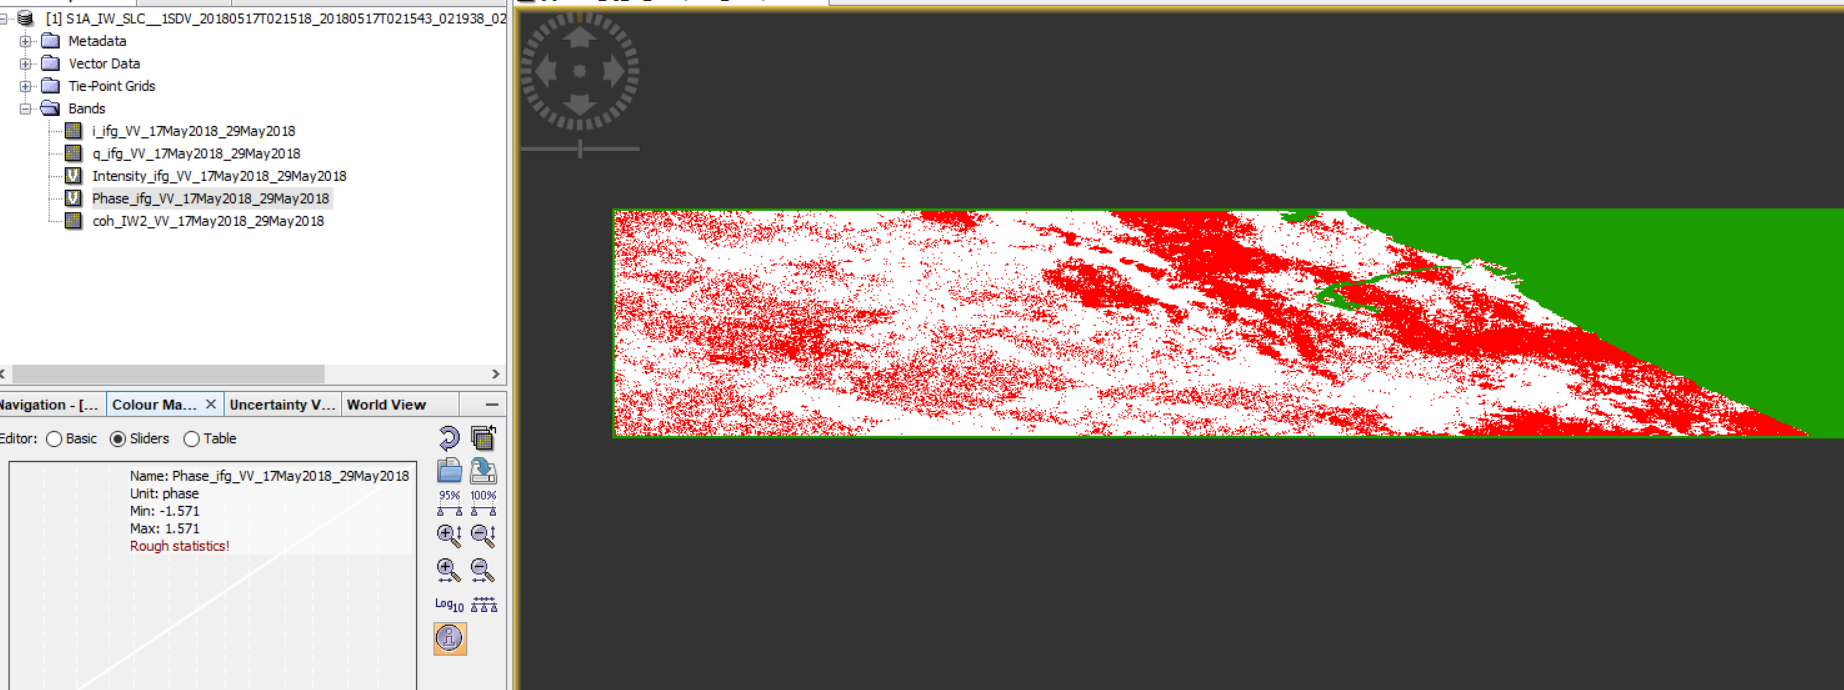
I thought i and q together form the interferogram. How can replacing i by the average produce a valid raster?
If you open this product in SNAP again, is the average interferogram shown correctly?
What are the right steps, of replacing the files?