Yes! This now looks like classic ionospheric waves. These short spatial-scale waves are difficult to correct in ALOS data, especially the low bandwidth FBD data that we have for this pair.
I will try the ISCE processing a little later today.
Yes! This now looks like classic ionospheric waves. These short spatial-scale waves are difficult to correct in ALOS data, especially the low bandwidth FBD data that we have for this pair.
I will try the ISCE processing a little later today.
Thank you for your response, @ABraun. I understand that I:
Further, I looked into the link you sent in this post:
and have understood the problem.
Dear @ABraun, @mdelgado, and @EJFielding , thank you for taking out time to analyse the problem I have been facing and helping me out in such an in depth manner. I shall forever be indebted to you all. I understand that this has been a strenuous process but I am glad that you have found an answer to the problem and made my job easier!
But here I would like to ask a few questions. At first @ABraun, could you please tell me about DIAPSON processing? Secondly, @mdelgado what was the polynomial degree and the number of GCPS that you chose while working with the images?
I look forward for your response.
I ran the interferogram with the ISCE application stripmapApp, and the coherence looks very good everywhere except in the corner where there seems to be some agriculture. Here is the wrapped phase in radar coordinates.
Here is the wrapped phase geocoded.
The ionospheric correction estimate did not work very well due to the extensive water areas, but I think the remaining ramp of phase across the scene, about one fringe is likely ionosphere.
Thank you very much @EJFielding for sharing the results with us. Indeed the results seem similar to what I have got, apart for the vertical stripes on my coherence results. Indeed ISCE shows very nice results, thanks again for helping us with this.
Myself while trying to go ahead with the TopoPhaseRemoval, I have identified and issue with SNAP. TopoPhase and elevation bands are shifted with respect to the InSAR results. See image below. Can you @lveci or @marpet open an issue for that? I think this is very important to solve it asap. Already some people approached me saying to had found something similar, specially in flat areas (also near Milan area happens). Thank you very much.
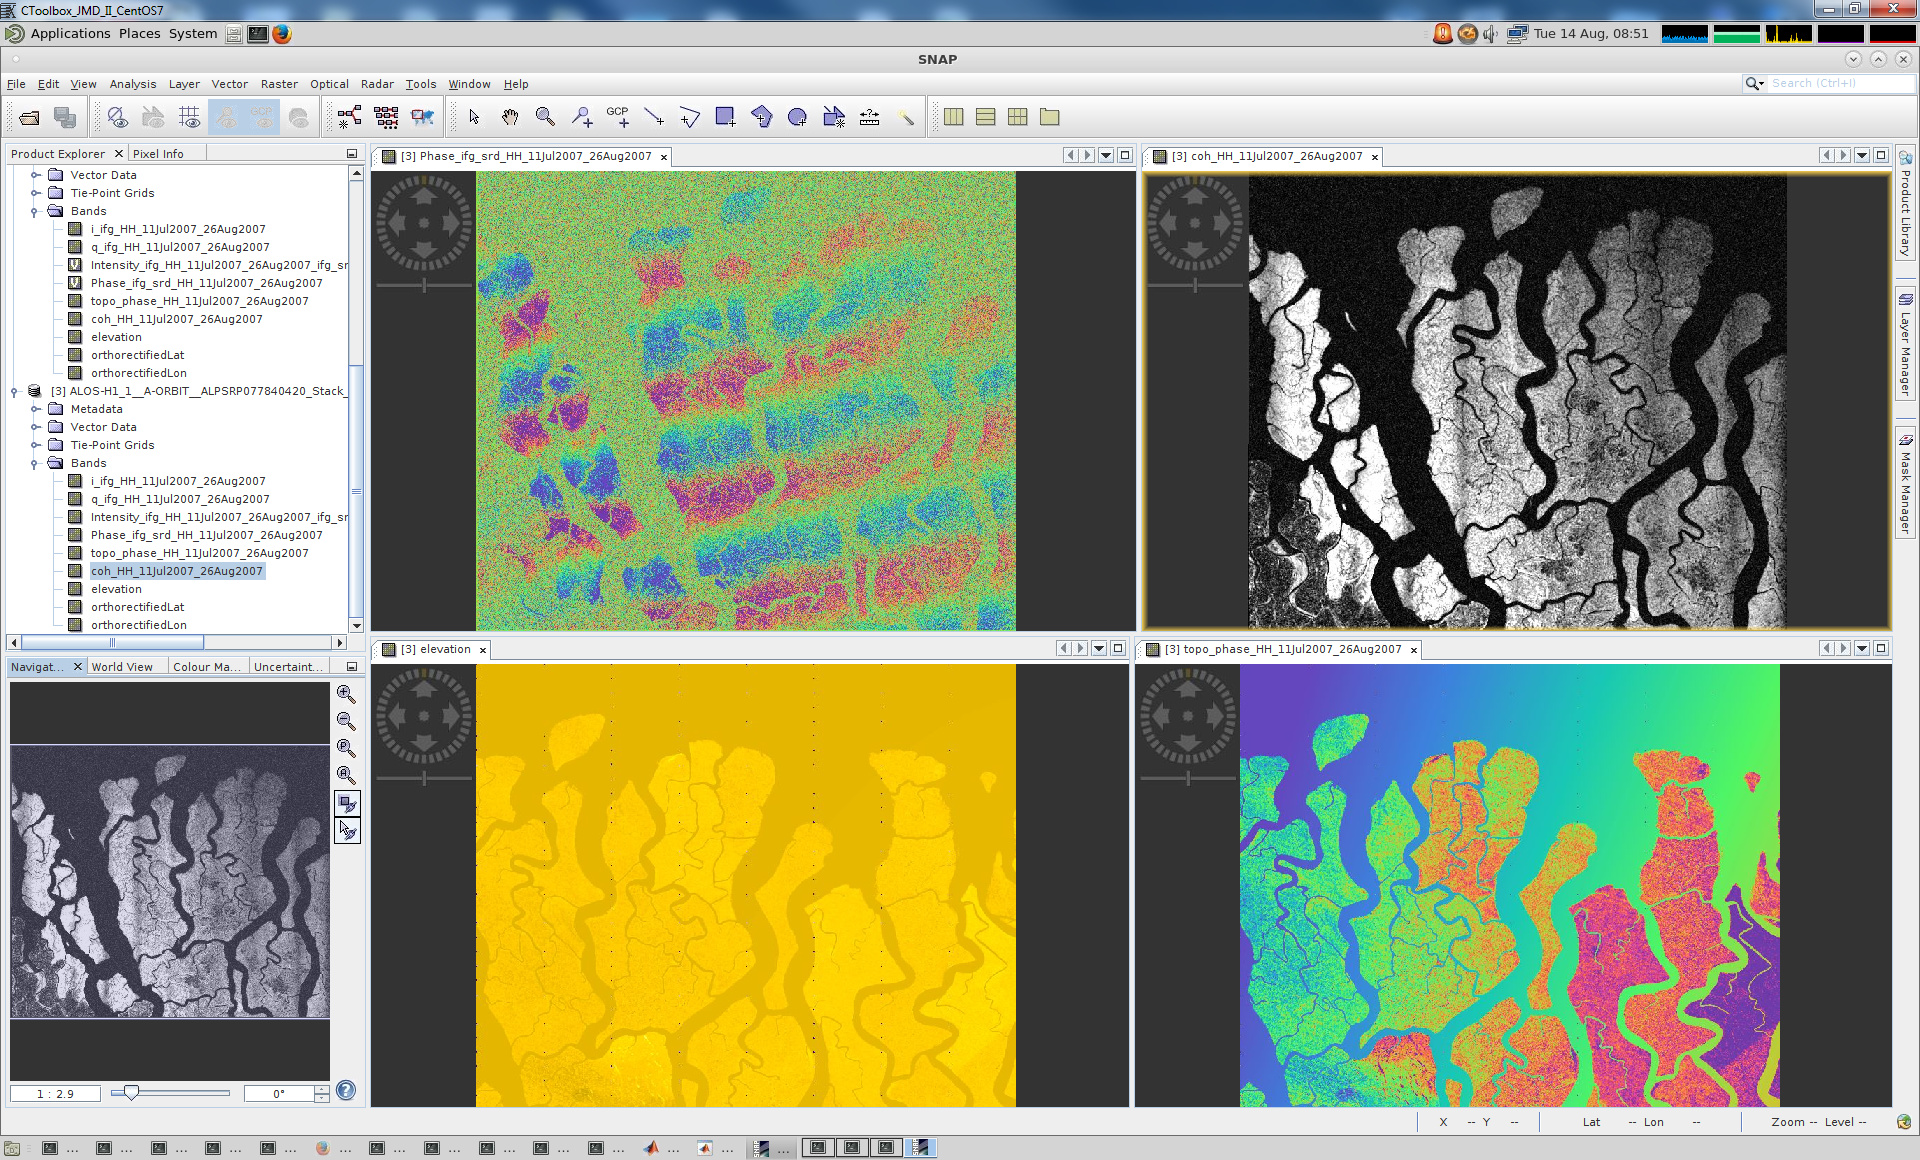
Note: I have used SRTM DEM 1 Arc second
Steps:
I guess that some parameters had been exagerated, but I wanted to verify whether with SNAP we could solved the issues due mainly to, coregistration errors (causing low coherence at first instance) and secondly wrong FlatEarth estimated and removed, keeping finally the fringes due to ionospheric effects typical from L-band SAR systems.
After my last post, please verify always if topo phase is correctly removed. Seeing one of @Abraun posts it seem that the TerrainCorrection worked fine instead.
I hope this may help you.
Thank you so much for helping me out, @mdelgado. Yes changing the parameters worked. But following the topographic phase removal, should I go for goldstein filtering, unwrapping, phase to displacement and then process it using doppler terrain correction at the end? If not, what should be the sequence now? Any of the parametric values need change?
Dear @draco, I am glad that you now manage to compute interferograms with the ALOS data. Just to mentioned that after applying TopoPhaseRemoval, please check the TopoPhase and/or elevation band (check for including them in the output) to visually verify that DEM is correctly aligned (in my example SRTMDEM 1Arc it was not the case). If TopoPhaseRemoval works just fine, the following steps are the ones you mentioned, but I would suggest to compute the plane that fits the ionospheric related phase contribution and remove it, otherwise your main contribution will not be only subsidence, but ionosphere related phase)
Another option would be to produce all the interferograms and try to proceed with PSI or SBAS techniques. Currently SNAP is compatible with StaMPS PSI but for that you need many interferograms to achieve good results (>20 interferograms are recommended).
Good luck! And let us know
Thank you so much @mdelgado. I read your message today I tried the SRTM 1 arc second in my case also. So when I opened the topo phase in the output it turned out beautifully! But once I do the displacement the resultant image is horrible!! Just similar random shades like before (post 56 below) !!
I do not understand why the displacement looks so weird! I have no clue.
And yes I wanted to process my images in this way. Could you please suggest a tutorial or a pdf where the steps are given?
Looking forward for your help.
you should compute the ramp related to the ionospheric contribution of the phase and remove it. The real deformation should be related to the remaining phase and not the one you show there.
I haven’t tested it, should be possible. But you need at least 25 images.
Thank you for the suggestion @ABraun. I am short of 5 FBD images. Can I use FBD and FBS ones in that case?
You can combine FBD and FBS as long as both have one common polarization.
well, as you already have the unwrapped phase, you could open it using any mathematical software such Matlab or python and calculate the plane that minimises (best approximate) using least squares or so. Then once you got that plane, remove it from the unwrapped phase. Note that then you could have still other contributions in the phase and not only deformation, but you will be one step closer.
If you plan to use PSI or SBAS then this probably is not needed as that kind of processing normally correct those effects.
I hope this helps
Well explained, @mdelgado
@draco: There was a discussion about ramps sone time ago. Please have a look at this post and the few following up: Subsidence map in 3d view