Now that you say it… I cannot find a working link for ROI_PAC, maybe you should ask in the WinSAR forum or so.
However GMTSAR and DORIS are available and also process ALOS PALSAR 1.1 (I used DORIS for that in the past)
Thank you, for your response. I was informed by EJFielding that GMTSAR can be used. But unless I get a linux OS it will be pretty difficult. How about DORIS? Is it easy to work with. Well, I guess I will struggle a little more with SNAP and if all is in vain, I will resort to these alternatives. Well, now I am trying S-1A IW SLC images in SNAP. Still hoping for the best! 
If you need a virtual machine to work with you can check out free services such as:
https://wiki.services.eoportal.org/tiki-custom_home.php which one of their services is CloudToolbox provisioning (customised VMs) https://wiki.services.eoportal.org/tiki-index.php?page=RSS+CloudToolbox+Service
Good luck! 
Thank you so much @mdelgado. I have a virtual machine working already but it is very slow. But anyway I’ll keep trying. If I can solve the present problem I shall surely revert.
do you have a local virtual machine or a one provided by the service I have mentioned?
Mine is a freely available and probably a local one.
Despite I appreciate your efforts, I don’t think it is a matter of software. Again, please consider the fact that your study area itself needs surfaces which coherently change over time. If these are not present, no software or technique will give you good coherence.
Not sure you understand me. There are freely services of VM provisioning both from ESA and Copernicus. Check it out if you feel like.
@ABraun In the past I have worked a bit with ALOS-1 PALSAR data, and being L band coherence remain high even through several years and long baselines (not higher than their critical baseliness) @EJFielding already mentioned several cases to have in consideration for that.
Still, I am surprised for the really low coherence of @draco[s results, so I still believe that it might be a matter of precise coregistration. But for sure it is worth trying @Abraun comments of using 6 days repeat pass of Sentinel-1 data, that could bring some light on that AOI.
Maybe I have a different understanding of a river delta. If it is a whole region, including cities and other artificial structures, there should be a way. But if it is just a alluvial fan near the ocean I see no sense in interferometry.
Maybe @draco can show us the exact location and extent of his study area.
1 Like
Thank you for your responses @ABraun and @mdelgado. @ABraun my area of investigation is primarily an urban area near the deltas of the River Ganges and occupies only around 10% of the imagery. Of course it was built up on an alluvial plain-on the banks of a river, and over the last 10 years its urban morphology along with the land cover has changed greatly. To understand what needs to be done, I read number of articles which used the technique and ALOS images to work on similar urban areas situated on alluvial plains and have found around 2m of subsidence per year from them! Such minute levels of information encouraged me to work with these images. But it was really strange to find such low levels of coherence in my study area, which should not be happening 
But maybe the problem is in the coregistration process, as @mdelgado has pointed out, and I have been trying my best to coregister the ALOS images in other ways to get a better result. I hope I will be able to overcome this problem in SNAP itself.
Further as @EJFielding has pointed out, I might be able to compare FBS and FBD in other software packages but not in SNAP. So as I need a good coherence, I am desperately running after anything which might be possible. 
@mdelgado I tried out the link which you sent and I understand now what you mean.
@ABraun, @mdelgado, @EJFielding and @mengdahl right now I am experimenting on both ALOS and S1A images according to the steps which @ABraun has provided here. If anything helps me to see the light across the tunnel I will surely inform all of you. 
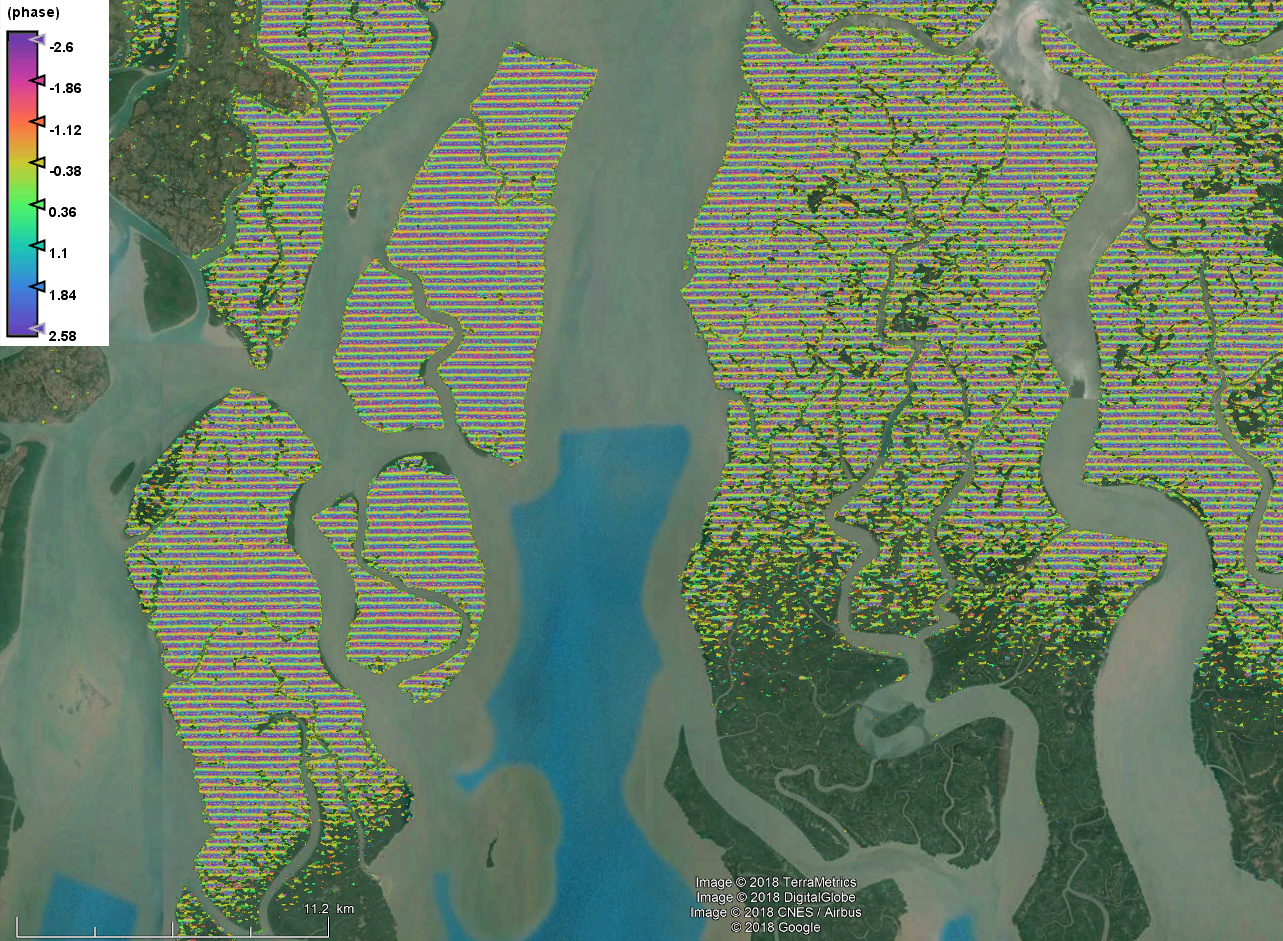
is this your image?
I found it according to your description and the dates in the screenshots above.
If yes, which part of the area is of interest to you?
Can you maybe name us some of the studies you referred to which applied InSAR in alluvial planes?
Thank you for your response. My area is towards the north west of the imagery.
I am attaching the links of the articles for your kind reference: http://iopscience.iop.org/article/10.1088/1748-9326/9/8/084010/meta
http://iopscience.iop.org/article/10.1088/1755-1315/98/1/012010/pdf
http://yyy.rsmas.miami.edu/users/famelung/Publications_files/ChaussardEtAL_Mexico_RSE_2014.pdf
thank you.
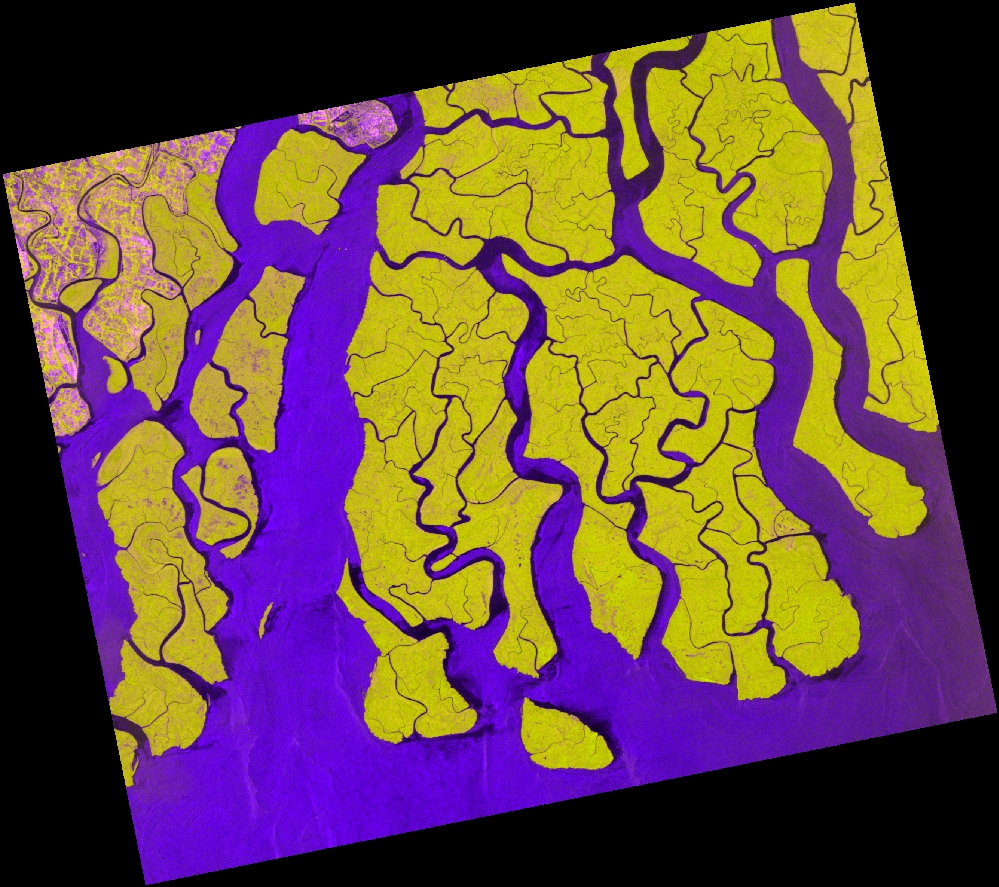
I tested it myself with the pair from 2007-07-11 and 2007-08-26. After proper coregistration, there is enough coherence, but the fringes are somehow superimposed by a strong trend which makes the data unusable:
My guess is that the orbit information present in ALOS PALSAR products is not exact enought to determine the correct InSAR acquisition geometry.
Thank you for trying it out @ABraun. So what do you suggest? should I discard it altogether? Can a Differential interferogram help? One more question when you processed this did you have to change any step?
I would give Sentinel-1 a try then. They have better Orbit information.
Yes. I was afraid you would say this! But what if I need older interferograms? And when you processed this image did you have to change any step?
I applied the same processing as you. As I said, i guess that the information on the satellites’ position is not exact enought (stored in orbit files). That means, the perpendicular baseline cannot be computed correctly. The fringes we see in my example are therefore not caused by topography or deformation but simply by false trignomic assumptions.
I might be wrong but if this is the case, changing image pairs won’t help much.
Thank you for your response. After going through your mail and the contents therein, I now presume that I have my choice to mature my thought process. Only I have a little query, can I compare ALOS interferograms with S1A interferograms? I am in a complete fix.
Can you try it with DORIS maybe? Or using maybe an older version of NEST? I am afraid that something could be mixed up …
When I did tried in the past I do not remember to do the deskewing… not sure if it was done in automatic though…
sorry, I haven’t used DORIS so far. But I am currently trying ERS and Sentinel-1 to see if there is potential.
You can compare their results (displacements) but not the interferograms themselves.