Can you try without deskewing?
Thank you for your advice. I will give it a try.

Should I do the filtering process @mdelgado ?
Thanks for trying @ABraun! Indeed coherence these last two times was much better, but still strange fringes… in the google earth picture they are horizontal!!
It seems to me more an artefact produced by who knows what (software, …)
My only suggestion now is to try with other software with the same images to see if there are differences or not. I do not have ALOS data, otherwise I would give some tries myself.
Thanks for trying to follow my advices. But more than this I cannot say. I hope you manage to solve it.
Keep me posted!
@draco, normally you should not filter for a single interferogram computation as @ABraun has done
Only in cases such as unwrapping the phase, or reduce noise
So after the interferogram I should directly go to the unwrapping and then do the filter?
No…
The steps you were following were in the right order, but for what @Abraun shows in his last plots it was not necessary (it was wrapped phase). And I think he did not applied it neither then.
Surely for the phase unwrapping, it is recommended to apply phase filtering for reducing noise, (Goldstein is one of the most used and also the only one implemented in SNAP for that purpose, but not the only filtering method that could be used or found in literature)
Actually, I did not apply any phase filtering. I just masked the low coherence areas so the fringes become more visible.
1 Like
Thank you for your response, @mdelgado. I am giving it a try.
@ABraun,
About the missing lines in the interferograms… had you checked the resampled slave image? Was it normal? Or had also that pattern too? Please check both master and coregistered slave.
If they are right, could you just do the interferogram computation without removing anything? Flat-Earth or DEM?
I am trying to see where this effect has its origin…
I am extremely thankful to both of you for all your efforts @ABraun, @mdelgado!! I am trying a new stack altogether.
the lines are not really missing, it is rather the pattern itself that looks like this.
I also checked it and the interferogram looks the same with (and without) topographic phase.
I will check later if flat-earth removal makes a difference.
1 Like
Still… missing lines or not, it is important to understand:
- if the resampled images are ok
- if the complex multiplication of master and slave (the pure interferogram) is ok
- if the Flat-Earth removal introduces the weird patterns
Thanks again for doing that! I guess that this understanding is needed to really see how to solve it or if it is any possible bug inside the software
1 Like
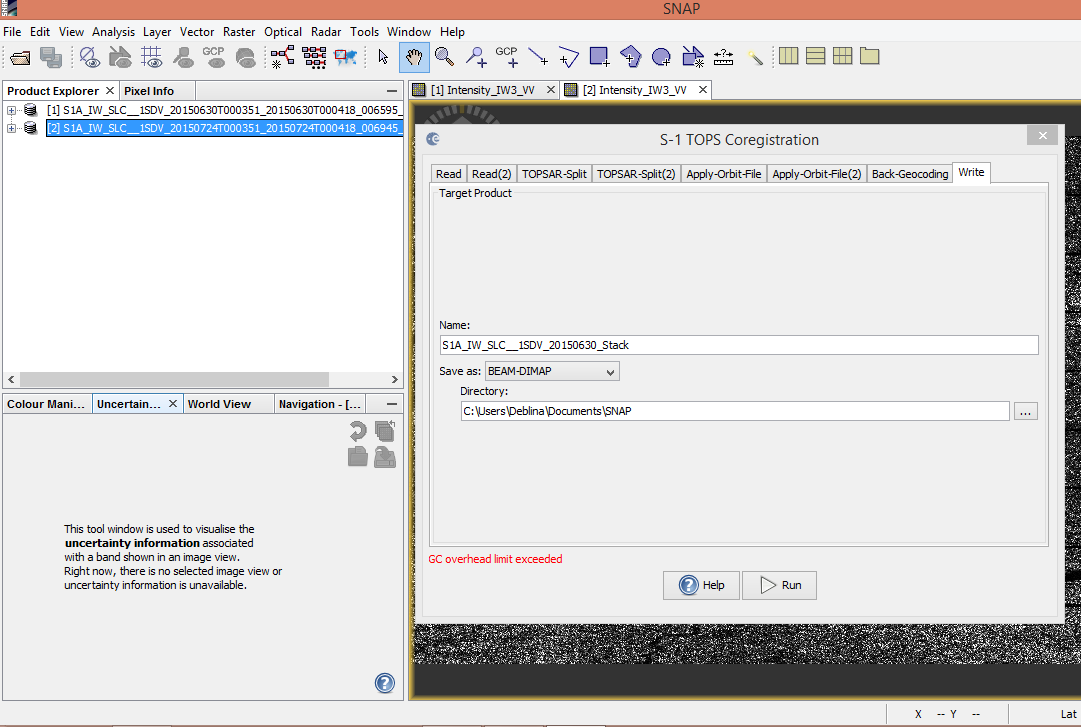
you ran out of RAM.
The strong trend in phase is more likely due to ionospheric effects, which are about 16 times stronger at L-band than C-band. The orbits for the ALOS satellite are generally good.
The latest version of the ISCE software includes an option for estimating and applying an ionospheric correction.
I could try running this processing in the ISCE software, if @ABraun can post the ALOS granule IDs.
I suspect the strong phase ramp could be due to ionospheric effects, which are stronger at low and high latitudes.
1 Like
- ALPSRP077840420
- ALPSRP084550420
Thank you for offering!
Did you find them on the ESA site or the NASA ASF site?