I have remember to had tried the highest degree for orbit interpolation together with highest points, and I agree with @mengdahl that physically should not be the right solution.
I will follow the thread as I am curious about which solution will be.
But please note that the DEM shifted issue I have mentioned was not only found in that ALOS inteferogram I posted time ago, but also reported using Sentinel-1 data (comments from people in IGARSS last summer)
I have used various combinations with highest degree for orbit interpolation together with highest points too and I totally agree with you, this should not physically be the right solution.
In a random Sentinel pair I processed the issue with the shifted DEM was not present. However, I am not sure whether I should totally ignore interferometry results when there is a shift between InSAR results and topo/elevation bands. Could this be a visualization bug?..
Do you think we should wait for baseline refinement? And until then, use another software?
Well… personally I am not changing software. I use it on my daily processing.
I like to check normally what I do, and doing so I may discard if anytime happens (with Sentinel-1 is rare, but it also happens to me, only few cases when topography variation is very low in the scene being flat areas)
I still recommend SNAP, but surely we need to understand whether the issues may be caused by orbit information, low quality DEM, etc… so lets the developers to analyse and solve when possible.
don’t get me wrong, I also fully aggree on SNAP as my first choice and I don’t want to change this. I just remembered that @EJFielding was able to correctly process ALOS interferograms (here) with ISCE and I recently read that it is now open to all users.
But obviously, there is some technical issue which cannot be solved from the user side, and since @epapadak was asking, I mentioned it.
@mdelgado and @ABraun I agree with both of you.
I do not want to change software either. It is only since last September that I started using SNAP and I really like it.
I was just wondering what someone like you, that are much more familiar with SNAP than me, would do with this issue of shifted DEM if he noticed that there is a relation between the shift and orbit degree interpolation. Would he trust the results from using the highest degree etc
As @mdelgado said “lets the developers to analyse and solve when possible”.
For investigating the bug we need access to the products in question as well as the graph(s) that can be used manifest the issue. @lveci@mfitrzyk
Regarding ISCE it is great to see that the software is Open Source, we can perhaps improve the interoperability of SNAP and ISCE in the future. It should be noted that ISCE comes with US export restrictions to embargoed and sanctioned countries. SNAP is open source and freely usable by anyone in any country and on- or off-planet…
Yes, it is true that we finally got permission to make most of the JPL InSAR Scientific Computing Environment (ISCE) v2 Open Source under an Apache license, but it still has the EAR99 export restrictions required by the US Department of Commerce.
The ISCE software is all command-line based so it is more for advanced users than the much more user-friendly SNAP software GUI. One big advantage of ISCE is the recent addition of ionospheric corrections for the processing of ALOS, ALOS2, and Sentinel-1 data. See our recent preprint of a manuscript in review on the effects of ionosphere on Sentinel-1 for a discussion of the importance of ionospheric corrections at C-band ( https://eartharxiv.org/atxr7).
Hi, mdelgado,
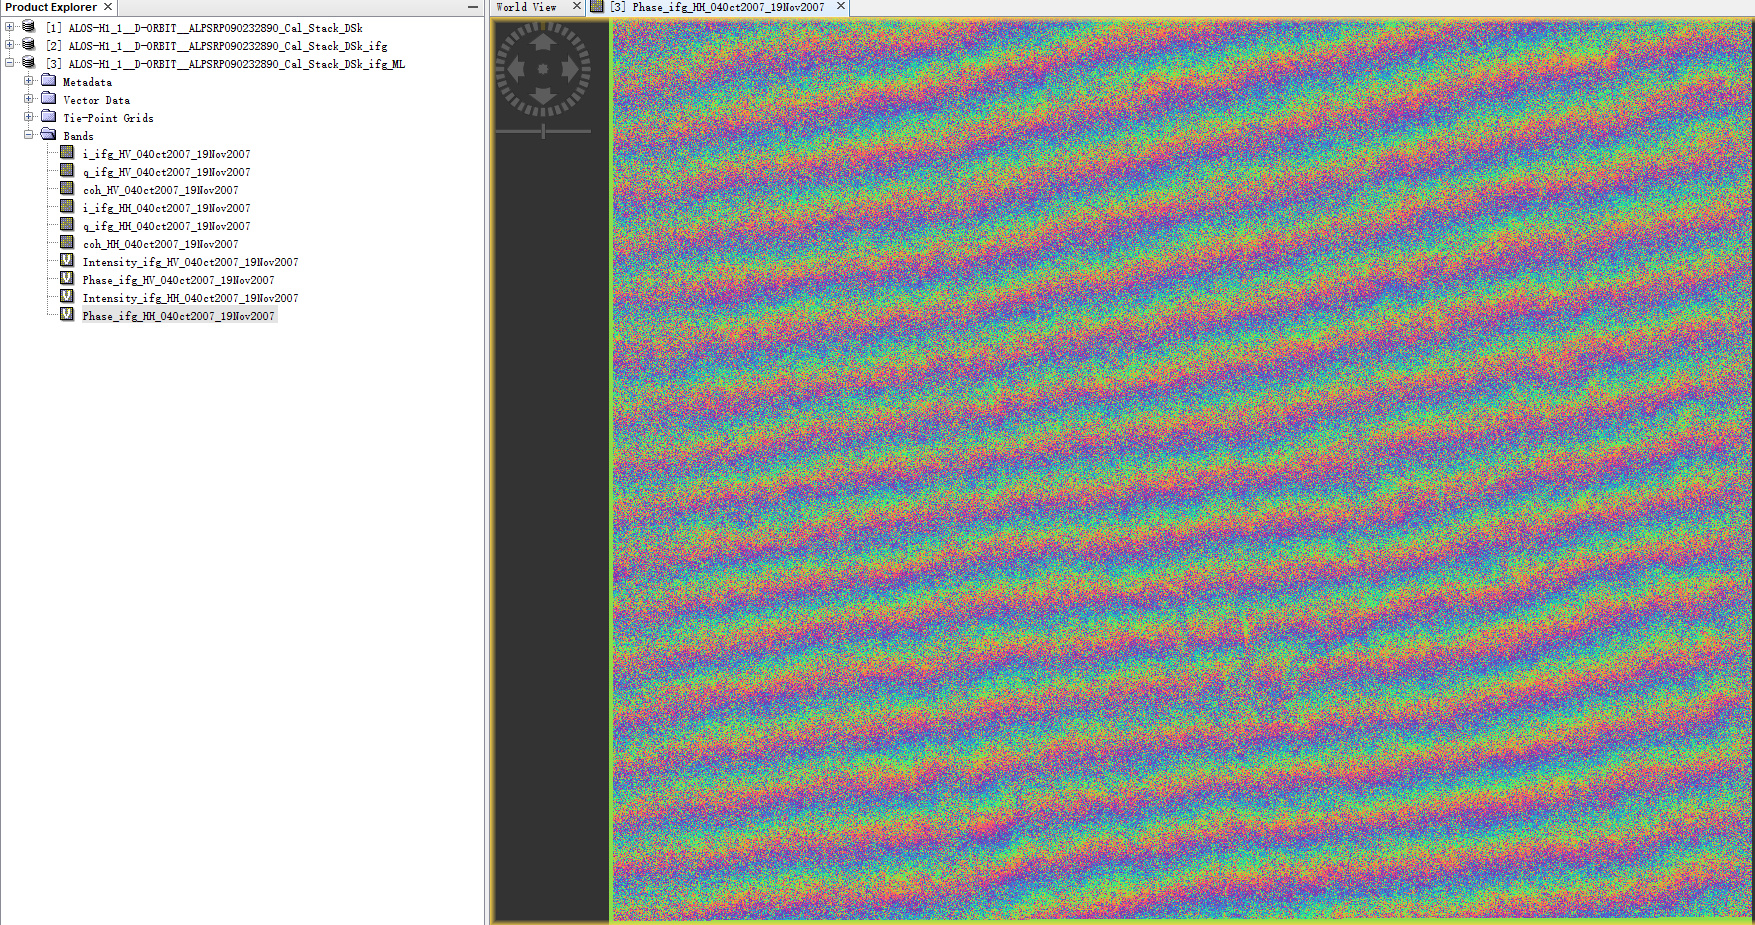
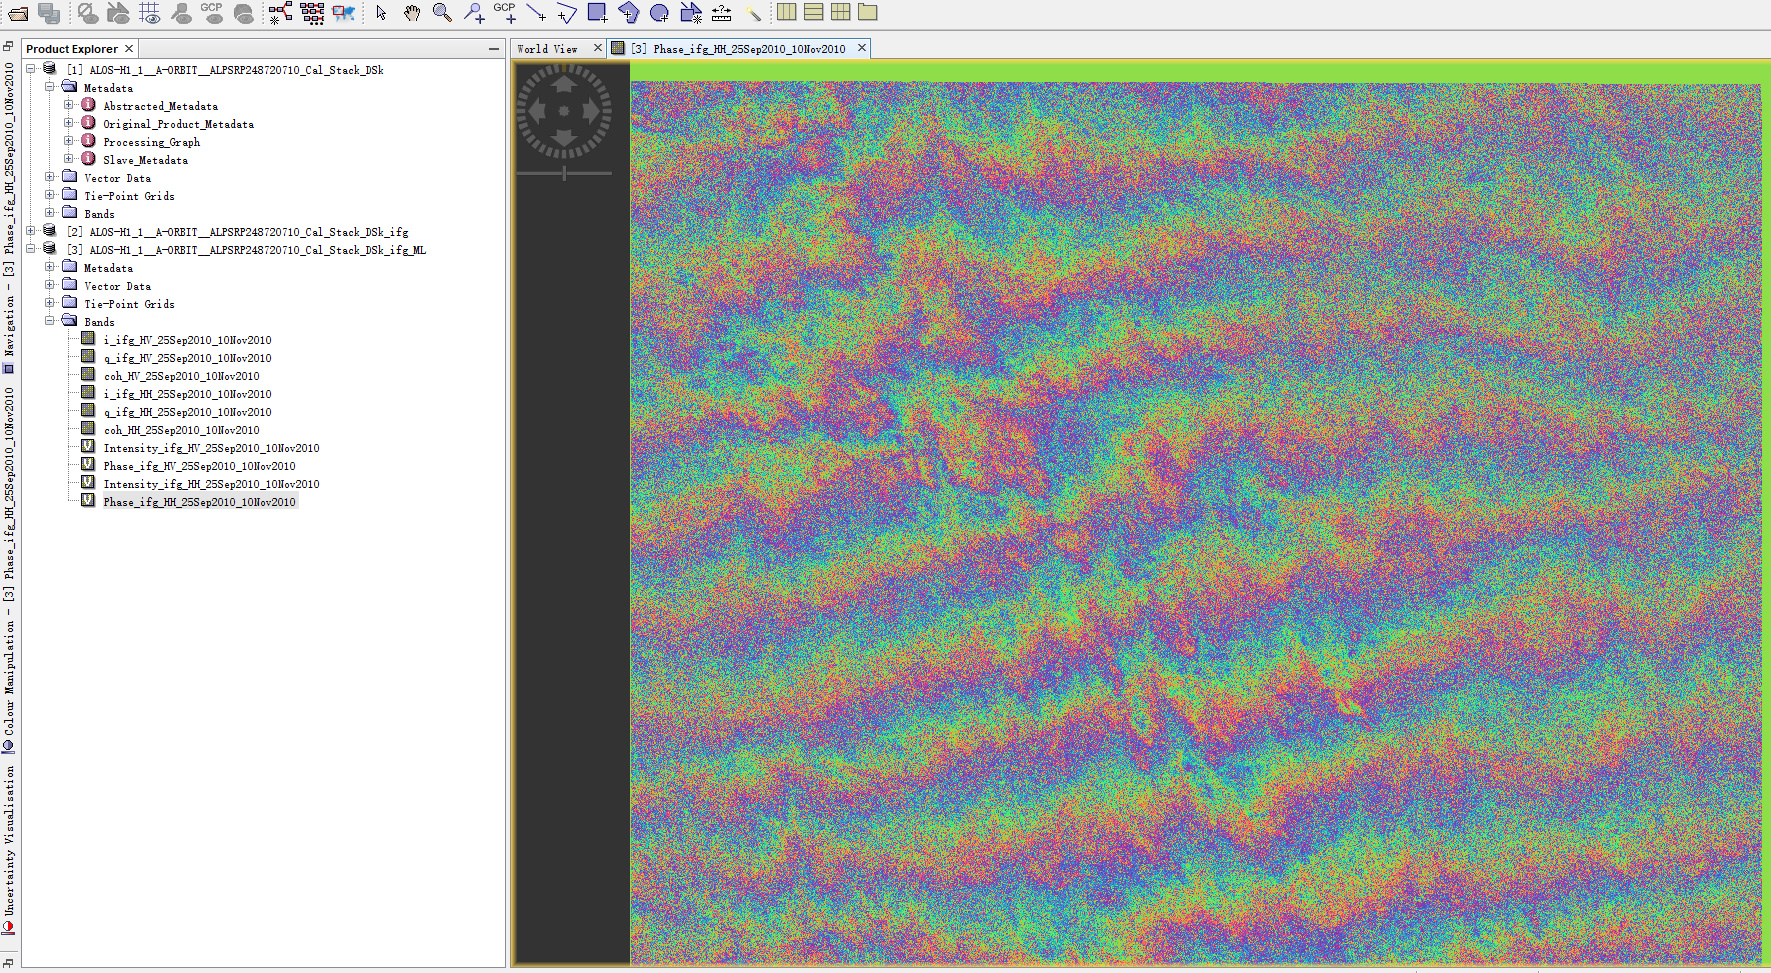
I used these parameters you proposed to process three pairs of ALOS-1 datasets, and got totally different results. I think only the results of the quad-pol datasets are acceptable.
Would you please help me to solve this problem? Thank you!
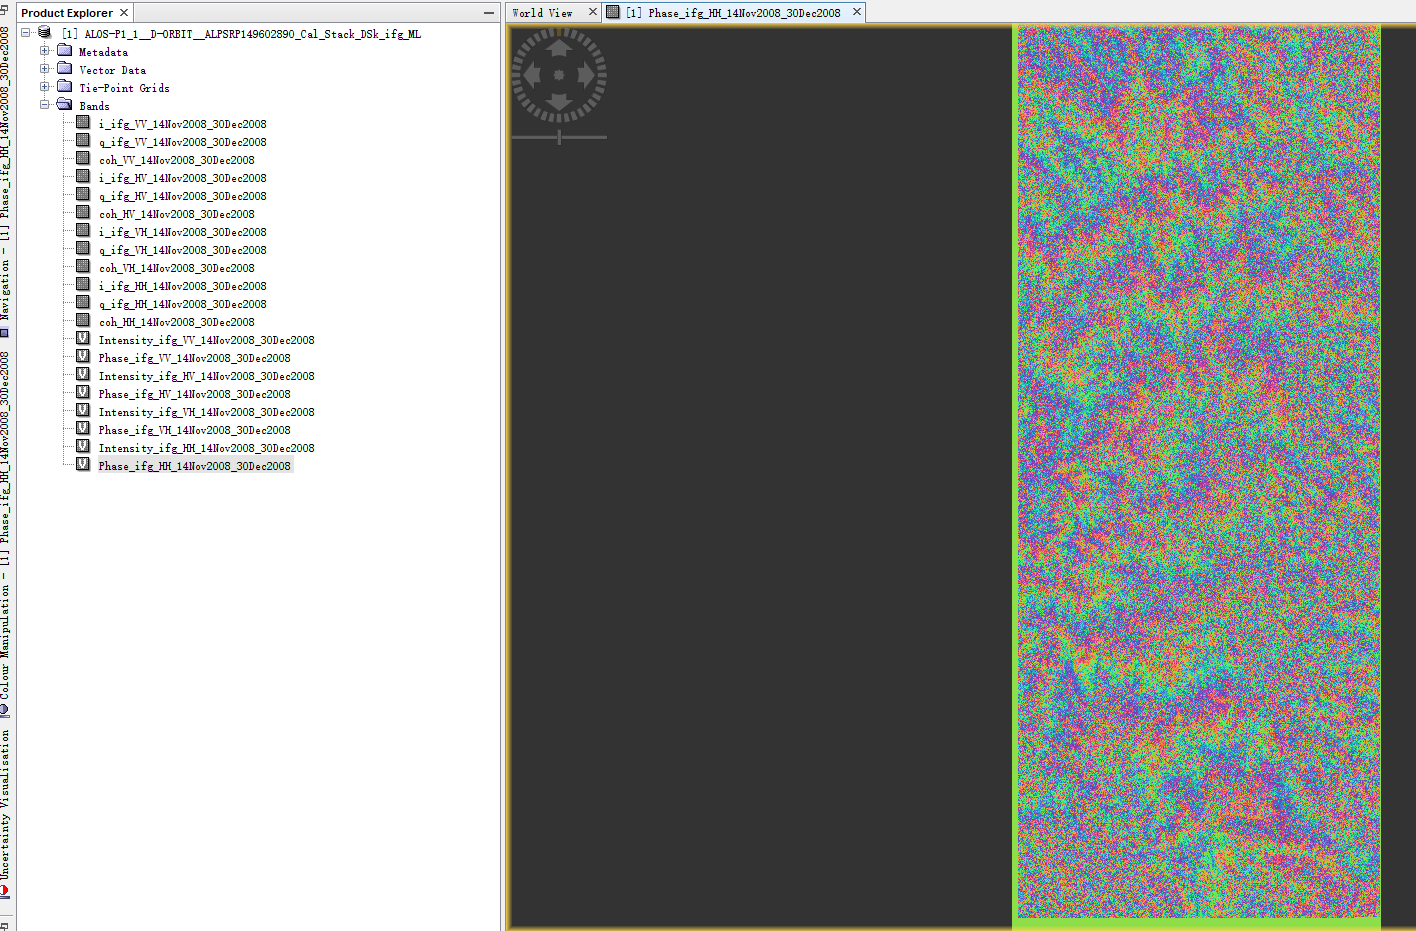
Some info about these pairs and accordingly results (multi-looked phase) are as follows: quad-pol obtained in 2008:
Perp Baseline: 1114 m
Temp Baseline: 46 days
Descending
I think it is related to the management and processing of the orbit information stored in ALOS products.
Maybe your interferogram quality increases if you adjust the settings as suggested by mdelgado here: Problems producing interferograms with ALOS
These results were obtained by using these parameters suggested by mdelgado. And I trid some other paramters, I think that the parameters in the step of flat-earth removal were too large, whcich caused these strong fringes, am I right?
yes, unsuitable parameters during the coregistration can be one reason for stripe-like patterns because a small trend superimposes the actual fringes from topography (or deformation).
Thanks!
You mean that these fringe errors caused by the unsuitable parameters in co-registration? So do I need to reduce the parameter value or increase the parameter value then?
I can’t tell exactly. If you used the parameters from mdelgado you probably already used the highest possible values (e.g. for orbit interpolation degree).
Somehow, the coregistration was not exact enough.
You can try nearest neighbor interpolation for the resampling of the slave during the coregistration. This was at least reported to solve parts of this issue some time ago (I can’t find the topic at the moment).
It is worth comparing different configurations of the coregistration (resampling, more GCPs, different polynomials) and their resulting interferograms. Only change one parameter at a time and check if it has an effect on the stripes.