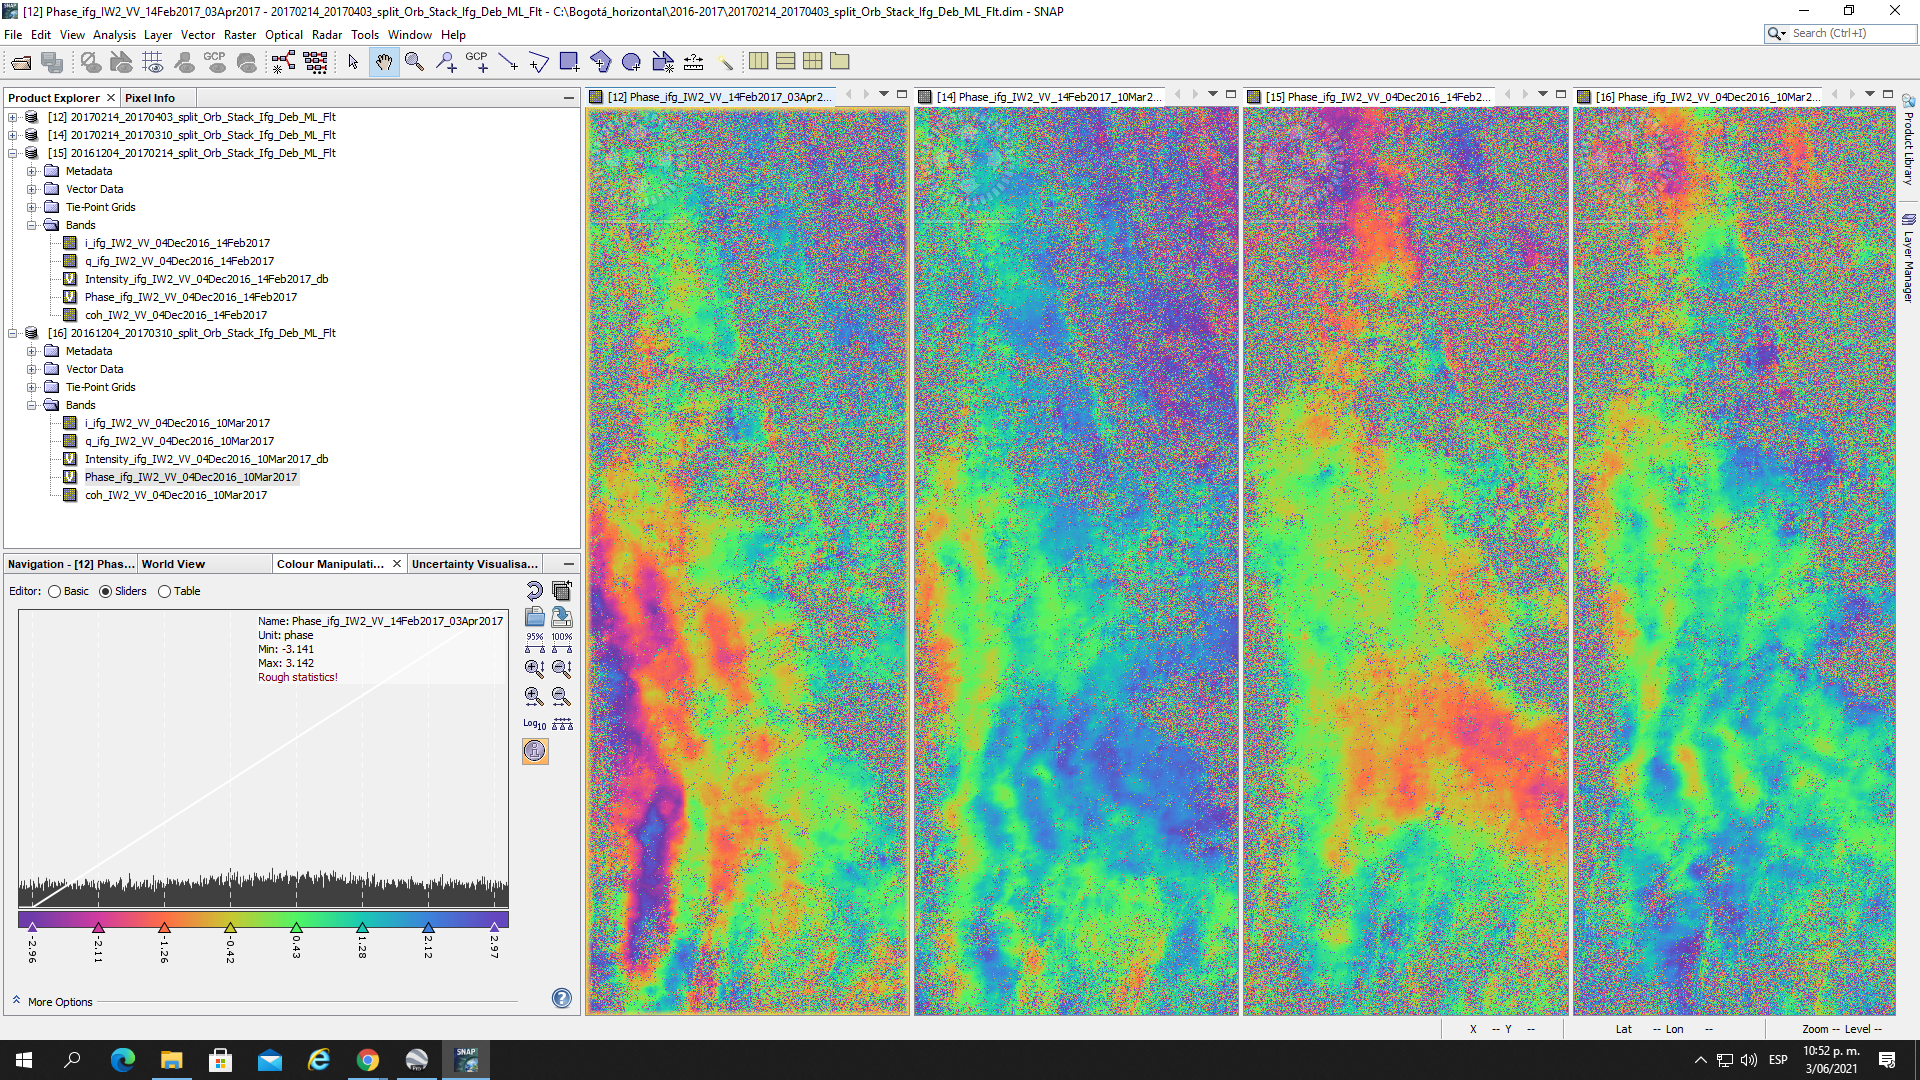
Hi everyone, I have been using SNAP ESA since the year began. I would like to know if my results are ok or at leats look good before unwrapping. The study area is from Bogotá, Colomba. I used a DEM 12*12 meters. I am also going to use the land/sea mask for reducing de areas with low coherence for a better unwrapping process.
If I use two images with two or three months betwen them, Will the results be ok if the area is urban?
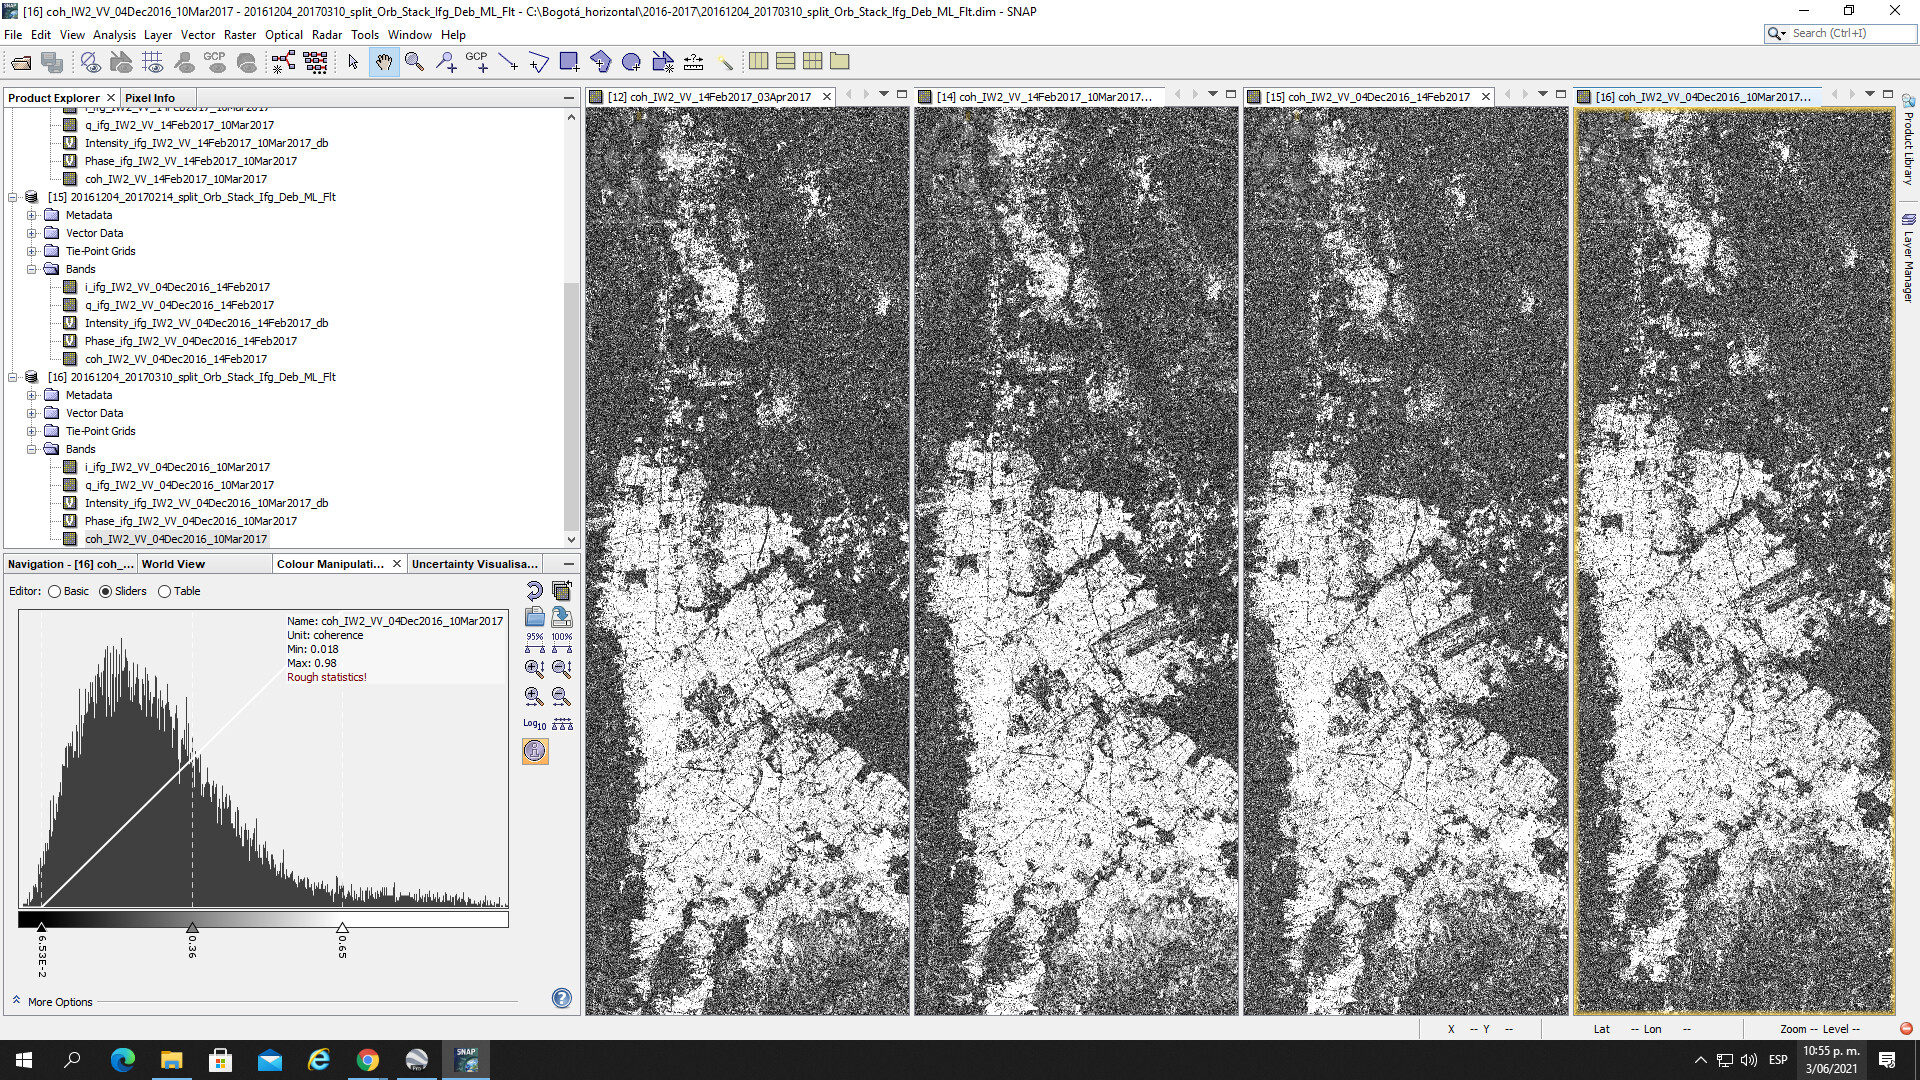
If I change the pixel expression of an Interferrogram phase, and only choose those which the coherence is higher than 0.6, Will the unwrapping process and the results be better?
Do you thnink that the SRTM 1SEC could give good results for my study area? I really apreciate some help.
The coherence looks good over the study area but the interferograms have weird patterns, maybe related to ionospheric phase.
What’s the aim of your study?
Thanks for your answer Mr. I major in Geology and for my thesis I want to measure land subsidence in Bogotá City, Colombia. (A tropical country)
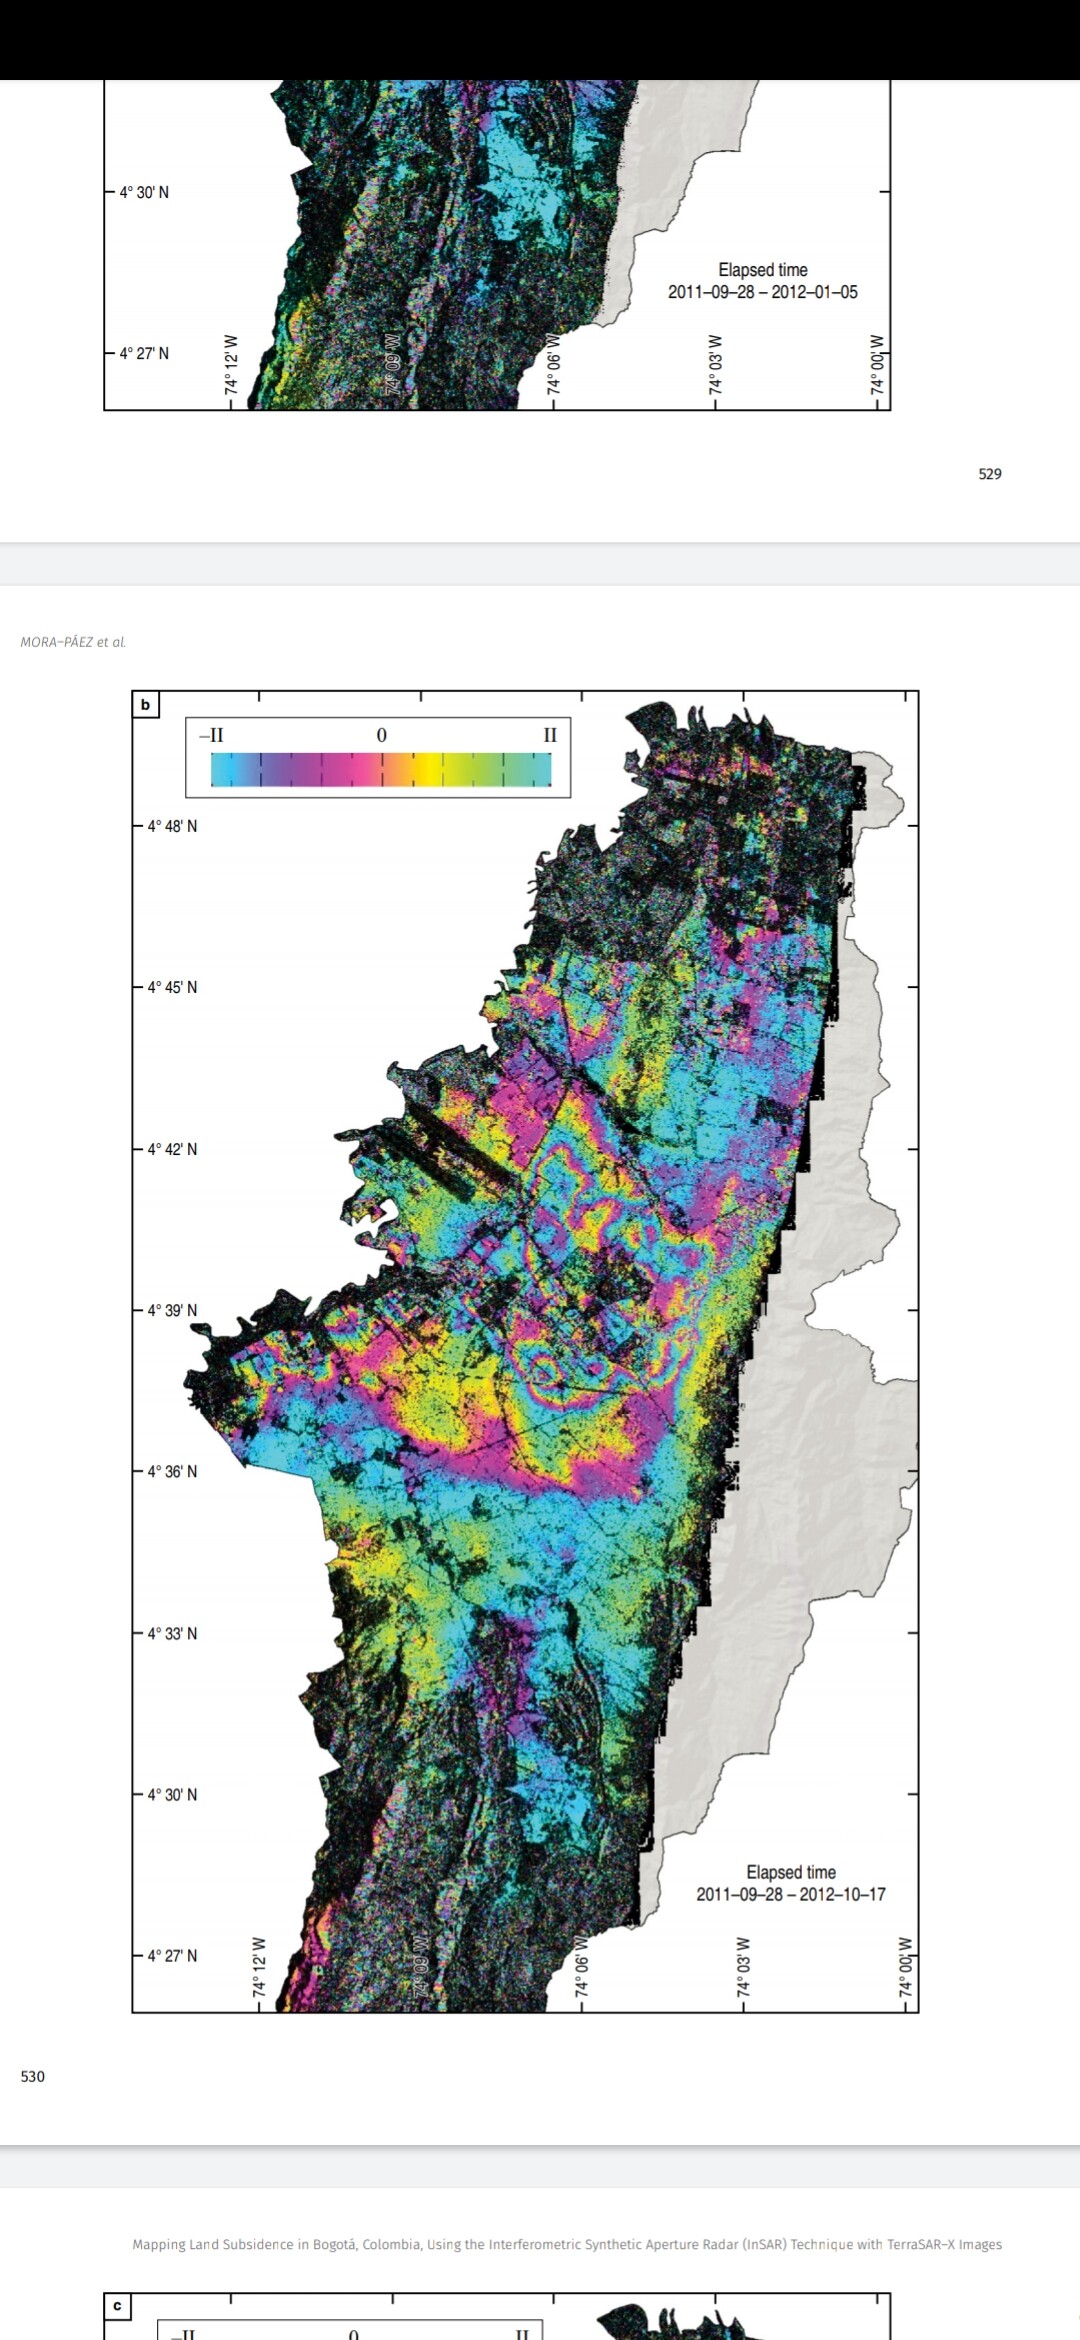
I have read other studies in the same area and they show subsidence specially in the center part of the city, but they have used another software and different data (like terrasar-x or ENVIASAT)for getting their results.
In my case, it’s my first time using SNAP and I would like to do the same using Sentinel-1 products.
Much depends on the selection of suitable image pairs (short temporal baseline, small perpendicular baseline, no rainfall during both acquisitions, low vegetation cover…)
Also, it is good to compute several products and compare the results. Masking low coherence could help in your area as you can only determine inner urban variations.
I’m also planning to do this study from 2016 to 2020. But I’m trying first with these years (2016-2017).
This is one example below. It was made with TerraSar-x data and with other software different to SNAP. This interferogram was made by the Geological Service of my country.
Masking is most effective if there are low coherence areas in between high coherence areas. Masking causes that random phase in these areas will not add up to strange patterns.But as you are only interested in the inside of the cities, the effect of masking is smaller, but it’s probably still helpful.
You already cropped the image product to the smallest extent possible so the impact of low coherence are is already minimized. Additional masking (with a polygon) will probably have no effect.
Be aware that the “ALOS PALSAR DEM” was derived from open-source, existing DEMs and is not generated from ALOS PALSAR imagery and is not 12.5m resolution.
Information on the source DEMs and how they were used in creating the ALOS PALSAR radiometrically terrain corrected (RTC) products can be viewed on the Alaska Satellite Facility website:
Hi Mr Braun. I have been using your recommendations and I am still trying to solve the problems with the interfwerograms. Also, thank you all who have helped me.
Mr I have a question related to COMET-LiCS Sentinel-1 InSAR portal, What means “max network length” and “Epochs processed” in the main page?
these describe the overall duration which can be covered by the processed interferograms, because their processing is still ongoing. Depending on where you are on Earth, you might have time series of 2, 4 or even 6 years.
Mr sorry for my questions, however I have one last question. I have explored the COMET-LICs data. I already downloaded some of the data of my interest area. The data have information of the coherence, wrapped phase and unwrapped phase, and all of them are in .tiff as well. May I process those data using SNAP in that format?
Unfortunately, SNAP can read them, but they don’t have the necessary metadata for further processing in SNAP. The scripts of LiCSBAS can handle this format, but you have to follow the instructions of the manual.
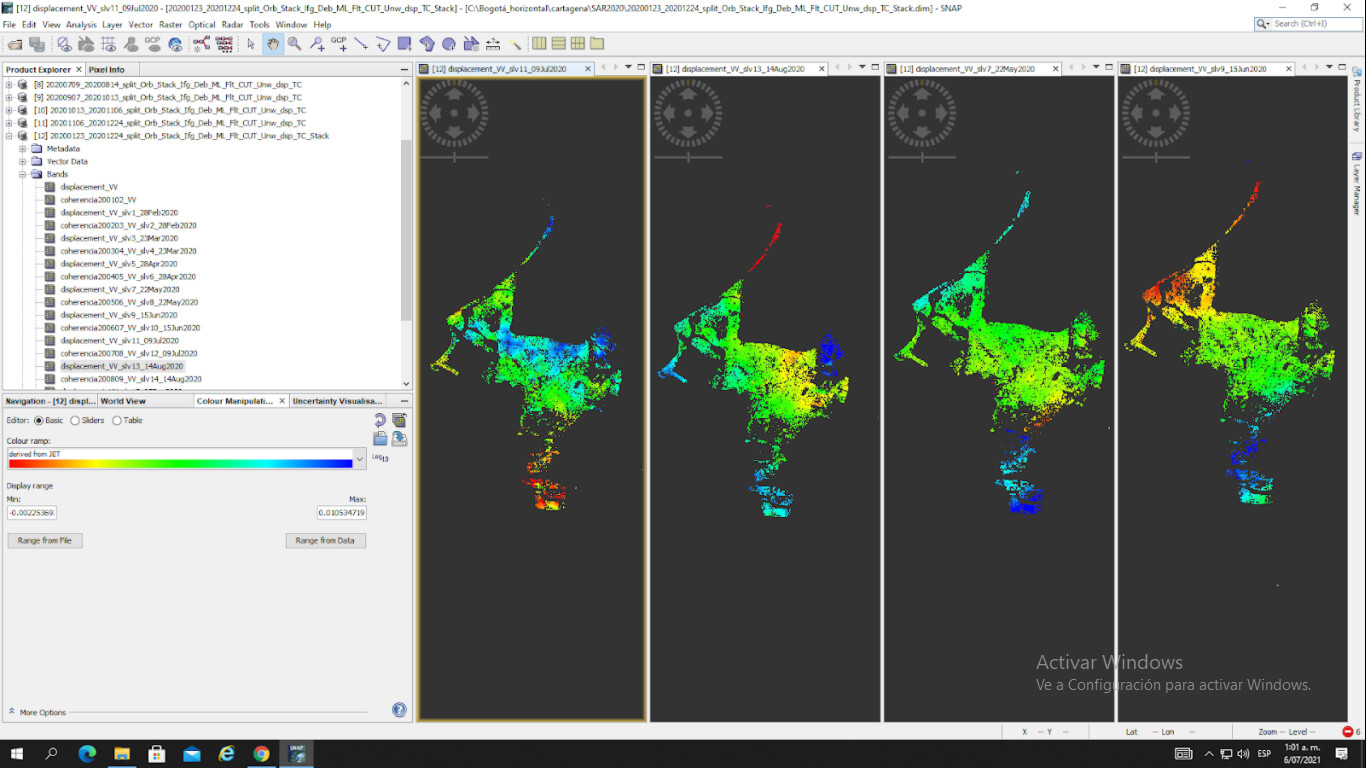
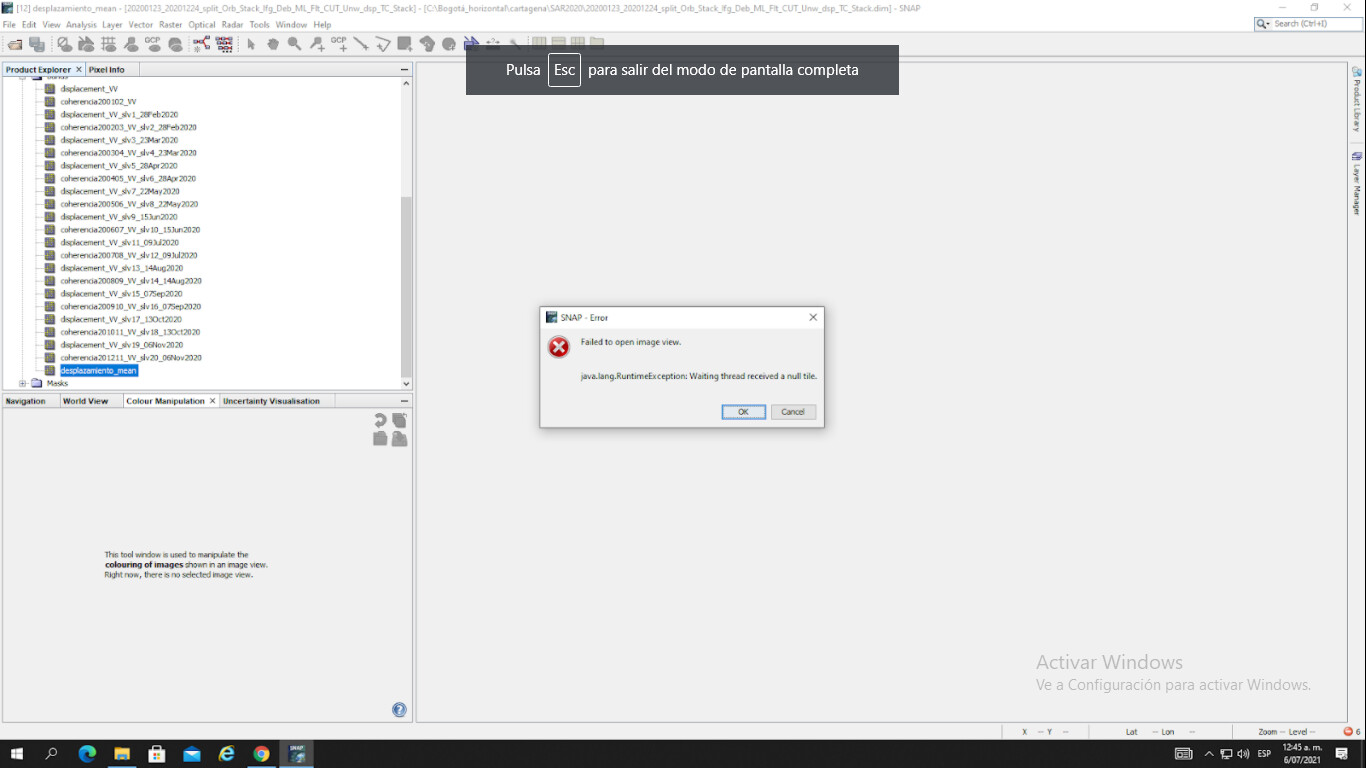
Hi Sir, I hope you find well. Finally I have changed my study area and I did those displacement maps from January 2020 to December 2020. However, when I try to do an average map of the displacement maps SNAP show me that error.
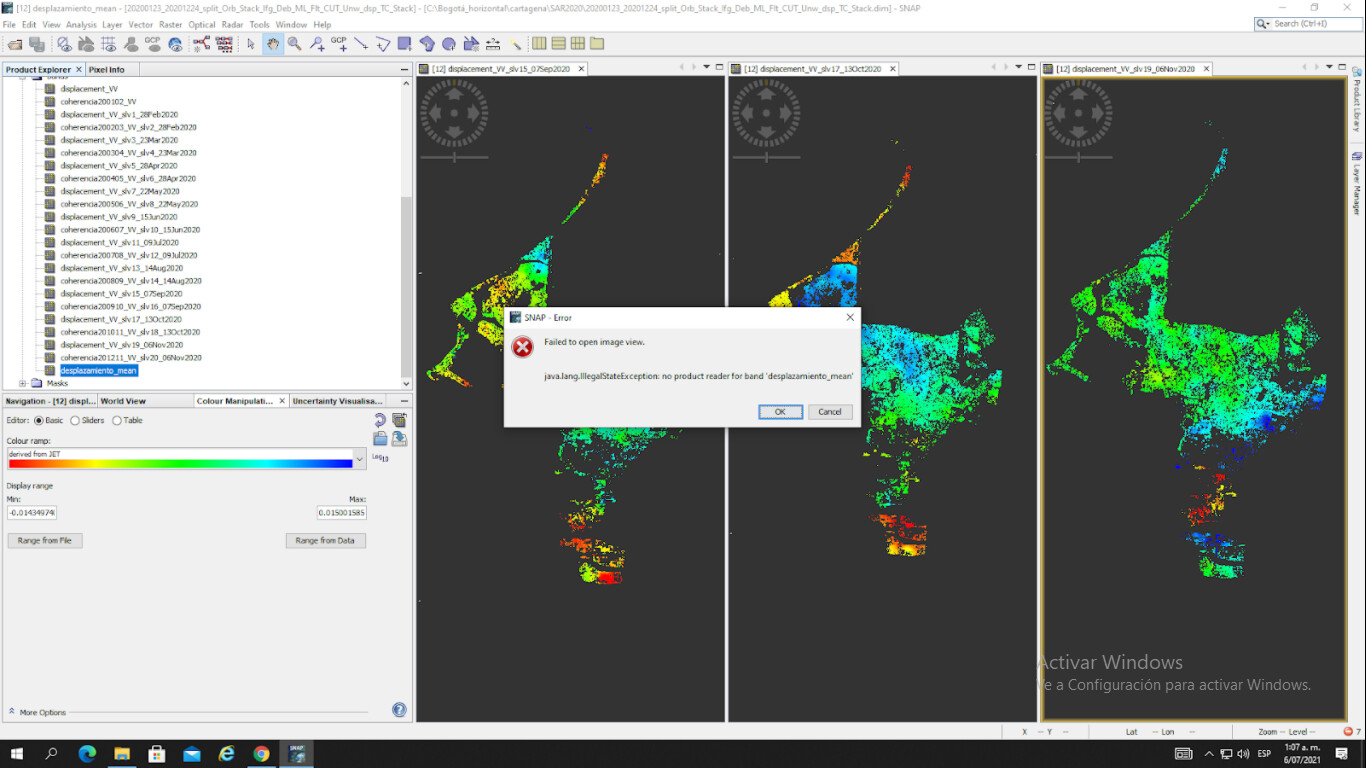
Good day Mr, Braun. I finally did the mean displacement map and I am a little bit hesitant about the results.
Because most of my displacement maps (month by month) have higher values of displacement than the mean displcement map?
How can I interpretate the results of the mean displacement map? How does SNAP to calculate that final result? With the mean of each displacement maps or averaging pixel by pixel between the displacement maps?
On the other hand, when I calculate the statistics of the displacement map there is a file called “max error”. Does that file refere to the uncertenty of the data?. And in that sense, if I applied a mask for pixel with low coherence, are the statistics just for the no masked pixels or for all of them?
Displacement map month by month:
Mean displacement map