Dear experts,
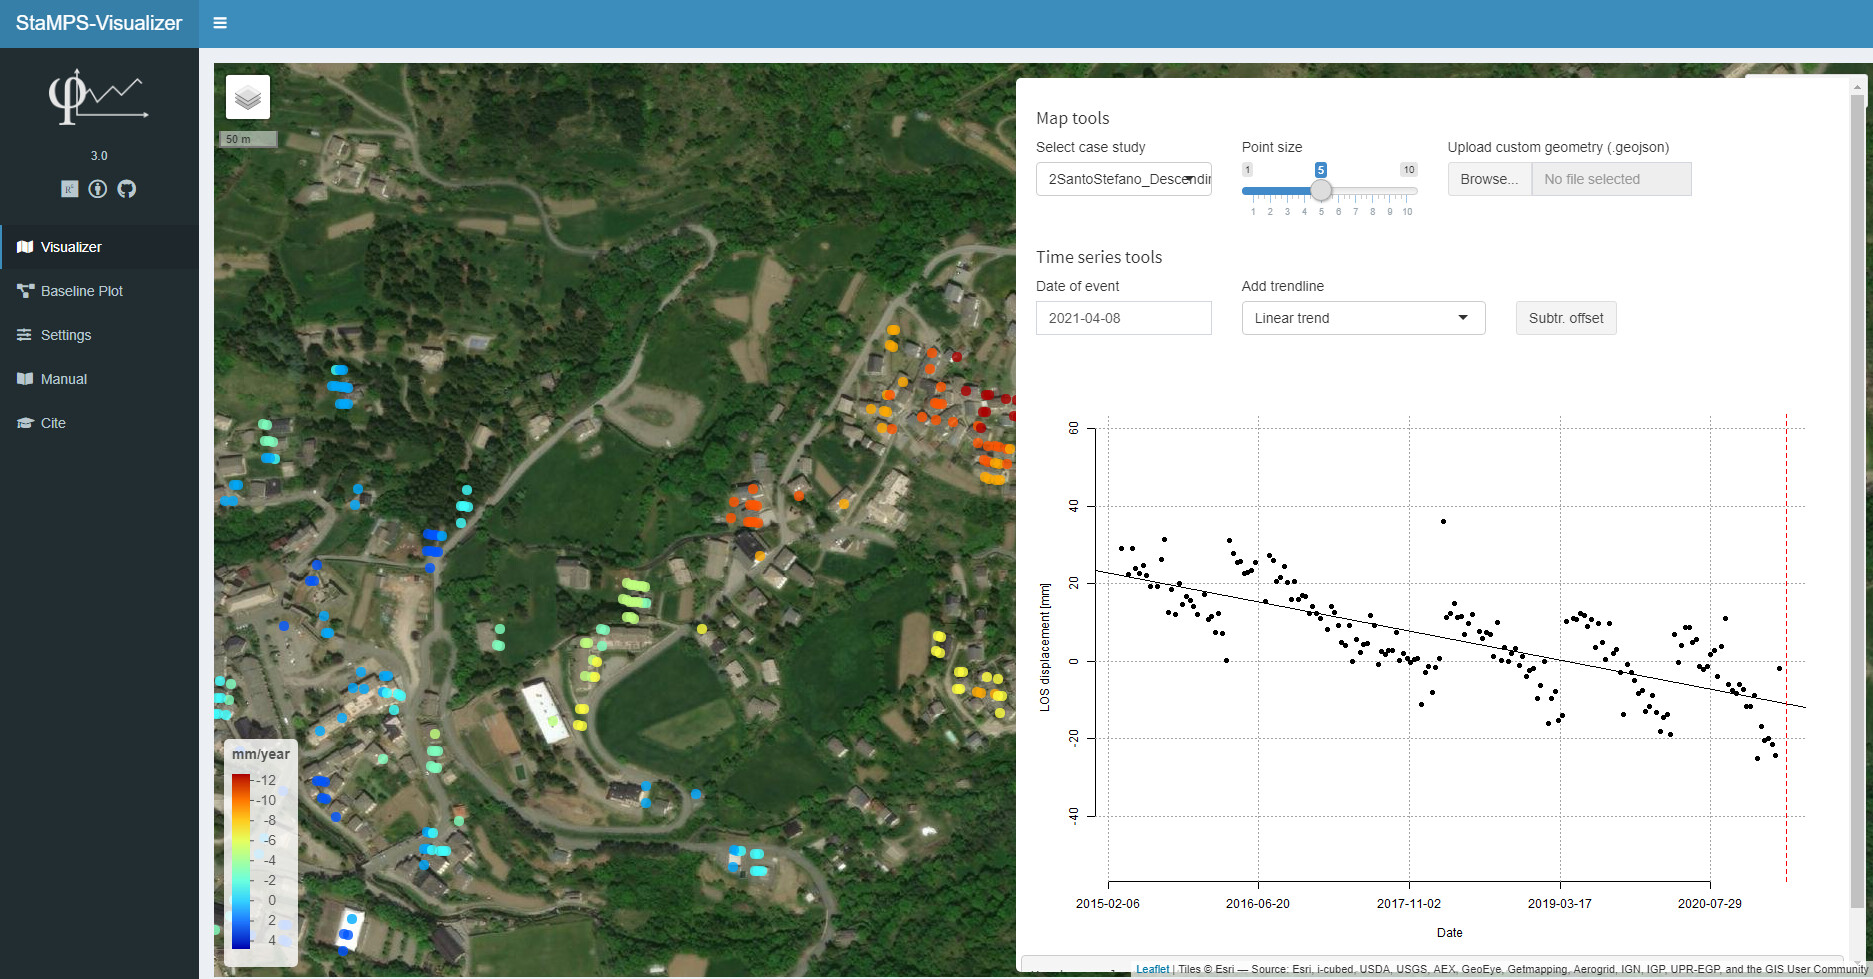
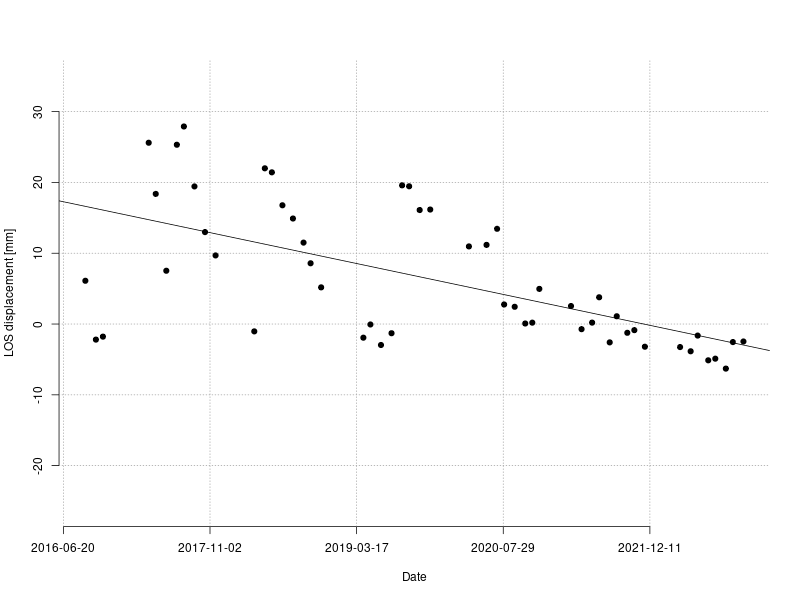
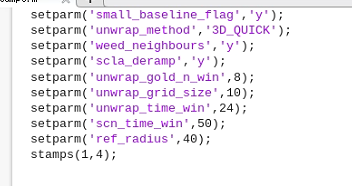
I’m analysing a landslide area over the period 2015 – 2021. I used Snap, snap2stamps and finally StaMPS and in the attached screen are the results. As you can see the time-series of the selected PS is “stepped” and this “stairway” is proper of all the PS produced over the AOI. I find this pattern quite strange and difficult to explain in a geological way (i.e. it does not seem a sinusoidal/seasonal pattern and no anomalies seem to be detected by inclinometers or other monitoring tools over the area). So, my question is if in your opinion this pattern may be due to the processing (unwrapping maybe?). Since the single segments have more or less the same inclination that is quite different compared to the mean linear trend over the whole period, is it possible that somehow they belong to a single trend and during the processing they were moved? Do I have to set/change some parameters?
During the processing I had only one warning during StaMPS step 3 (Warning: Not enough random phase pixels to set gamma threshold - using default threshold of 0.3) but I don’t think it affects the pattern…
Thank you very much in advance for your help!