Hi everyone,
I’m wondering if SNAP allows to derive statistical features of local patches. This idea comes from a paper that says:
“Since the morphological structure of an urban neighborhood is one of the essential factors that local
climate zone classes try to describe, it is natural to derive features describing the local neighborhood.
It has been shown that simple statistical parameters of a local neighborhood the mean and standard
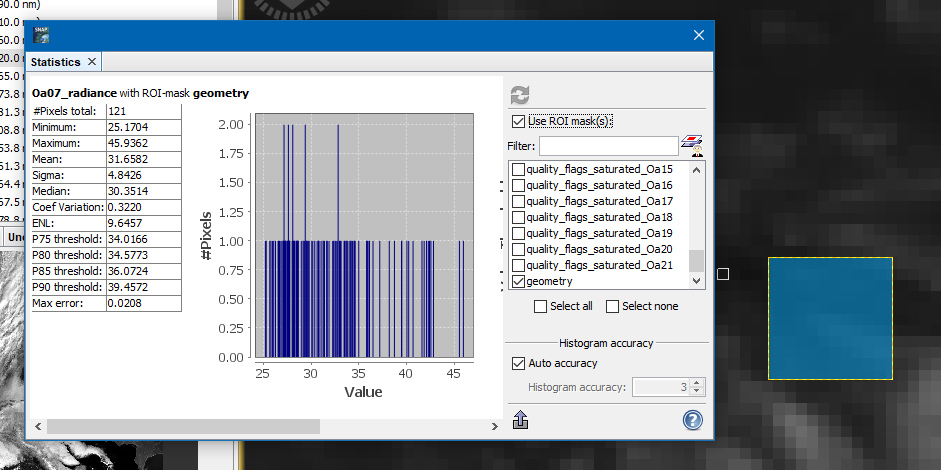
deviation are suitable features for the classification in [13,25]. In our global-scale task, we extracted five
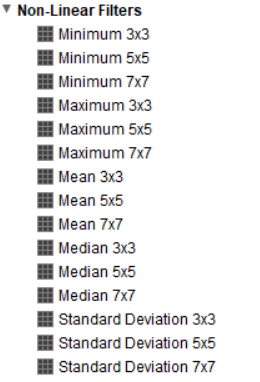
statistical parameters: maximum, minimum, mean, standard deviation, and median of local patches.
Since the ground sampling distance (GSD) of the LCZ map was suggested to be 100 ms [3,25], the local
patch in this work was defined as a size of 10 by 10 pixels, corresponding to the suggested 100 meters
GSD. Those parameters were derived from all four polarimetric features (Pol-Baseline), resulting in 20
features. We named the local statistical feature the Stat-Feature.”
which is from https://www.mdpi.com/2220-9964/7/9/379?type=check_update&version=1. This is applied to SAR data.
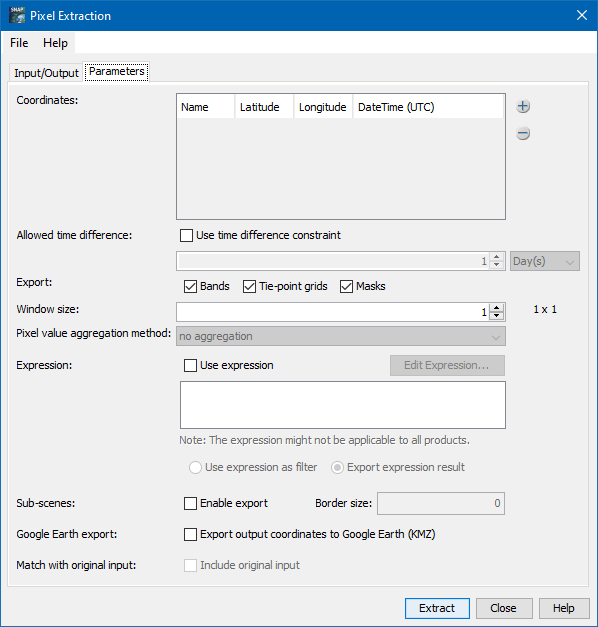
Is there any way of doing this analysis in SNAP?
Thanks.