No problem. Thanks you put your time.
I mean this problem in below.
If you apply Range Doppler Terrain Correction on both elevations, you can simply stack them.
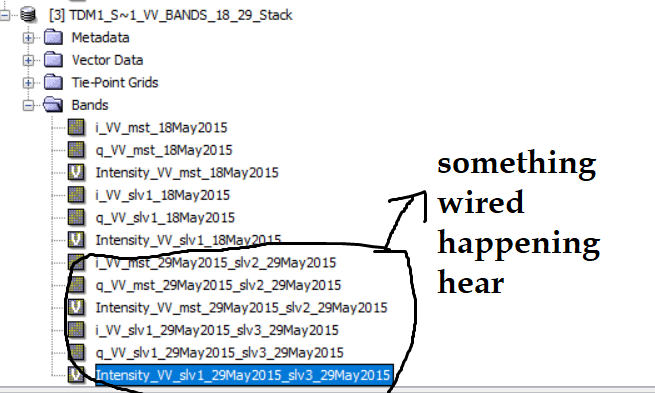
This is because each TDX-Product has two VV bands and the automatic naming seems to have a glitch. But again, you only need one image per date for classic interferometry.
Dear @ABraun
Please look at below:
I applied Range Doppler Terrain Correction over interferograms and results are in below:
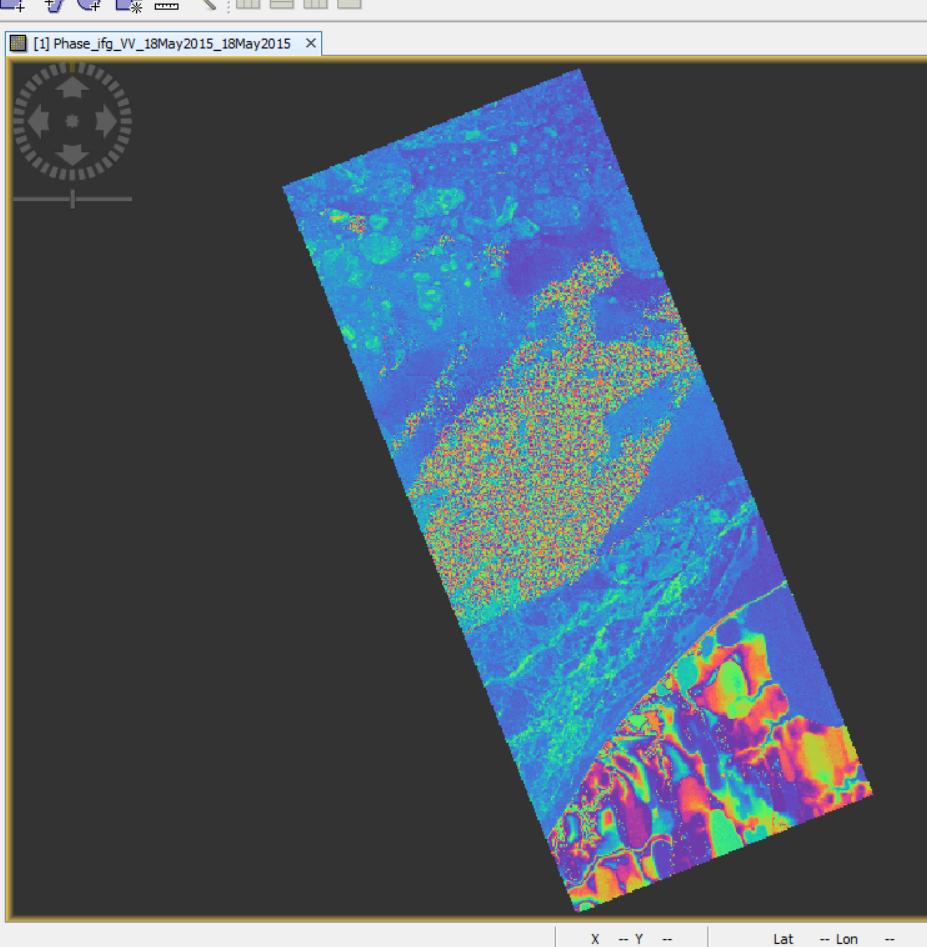
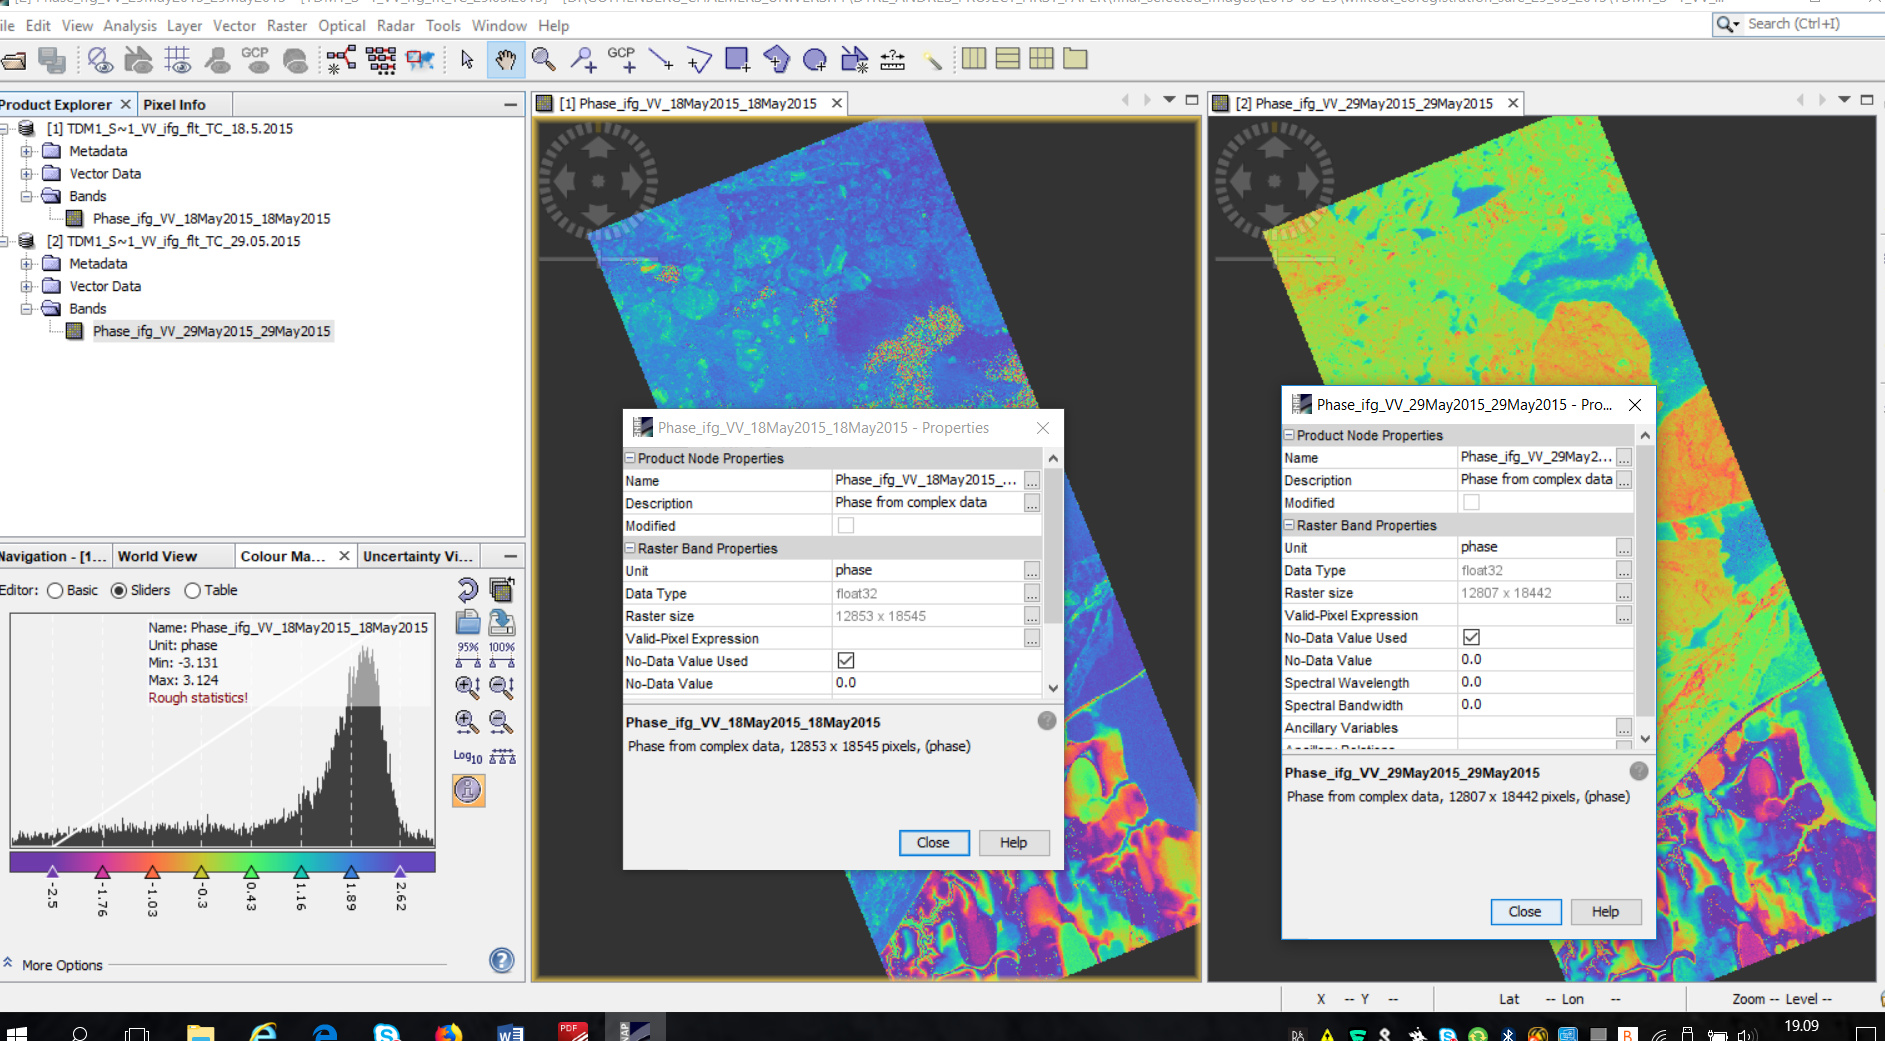
Figure1.interferogram from VV band on 18.5.2015 (6862*17802 pixels)
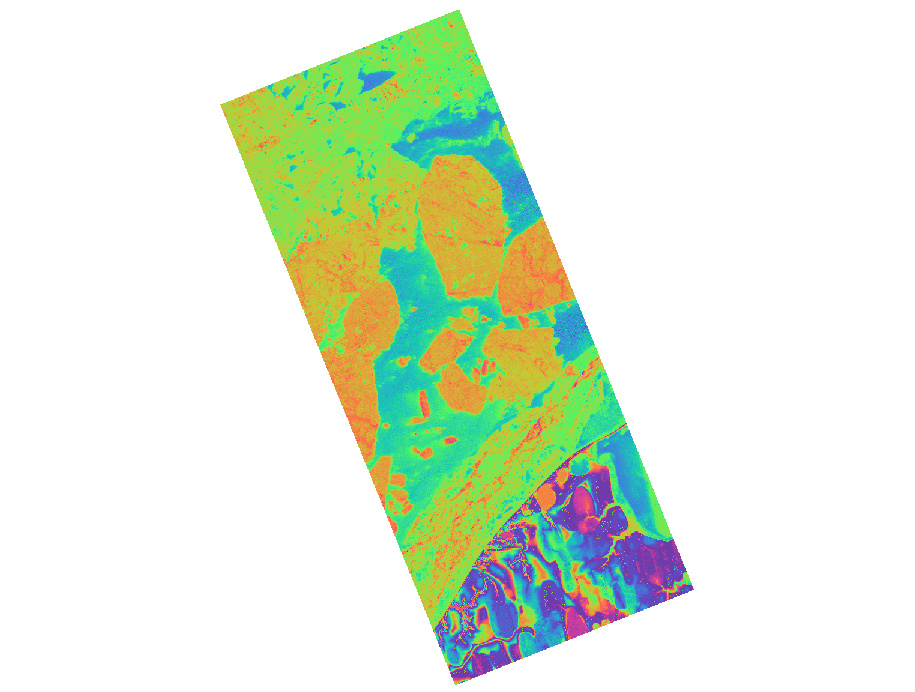
Figure2. interferogram from VV band on 29.5.2015(6862*17688 pixels)
As you can see, they have different dimensions.
As you told me, for solving this problem, I should convert them into elevation? Am I right? And apply ‘Range Doppler Terrain Correction’ on them, then I should stack them?
Now I have two questions:
- I applied before ‘Range Doppler Terrain Correction’, why I should applied it again on elevation result?
- Imagine, I want to have two interferograms in same dimension? What is the solution?
Sorry for confusing.
I do not know what do you mean with classic interferometry?
I want to make one interferogram for (VV or HH, bistatic mode) for 18.05 and another interferogram for (VV or HH, bistatic mode) FOR 29.05 and then do further processing but problem is interferograms dimensions.
They are differences.
I want to export interferograms in MATLAB and do further processing there but still they have different dimensions and I can not do anything between 18 and 29.
I hope my explanation is clear now.
I don’t see the different dimensions to be honest, do you mean rows and colums?
There was a misunderstanding: If you want to convert the inteferogram to elevations, you will have to do this before range doppler terrain correction.
Export to snaphu, perform unwrapping, and import the unwrapped phase back into SNAP. A tutorial is shown here: https://www.youtube.com/watch?v=xbIrhbzNrRo
After unwrapping, you can use “phase to elevation” and retrieve absolute elevations (still in radar geometry).
As a last step, you can apply Tange Dopper Terrain Correction so both elevations are projected into a coordinate reference system Then you can stack them and compare the elevations.
This is the SNAP approach, I don’t know anything about Matlab. But if you only need the interferograms with same rows and numbers, you can use the collocate tool to make one stack out of both. The resulting product has one common geometry.
I don’t see the different dimensions to be honest, do you mean rows and colums?
Yes, look at below Figures 1 and 2:
Figure1.interferogram from VV band on 18.5.2015 (6862*17802 pixels)
Figure2. interferogram from VV band on 29.5.2015(6862*17688 pixels)
You can not see here but I can see in SNAP.
There was a misunderstanding: If you want to convert the inteferogram to elevations, you will have to do this before range doppler terrain correction.
Export to snaphu, perform unwrapping, and import the unwrapped phase back into SNAP. A tutorial is shown here: https://www.youtube.com/watch?v=xbIrhbzNrRo
After unwrapping, you can use “phase to elevation” and retrieve absolute elevations (still in radar geometry).
As a last step, you can apply Tange Dopper Terrain Correction so both elevations are projected into a coordinate reference system Then you can stack them and compare the elevations.
This is the SNAP approach, I don’t know anything about Matlab. But if you only need the interferograms with same rows and numbers, you can use the collocate tool to make one stack out of both. The resulting product has one common geometry.
Yes, I need interferograms with same rows and numbers. Where is collocate tool?
If I make both interfergrams and then make stack from them, is it ok? I mean it does not have problem in meaning?
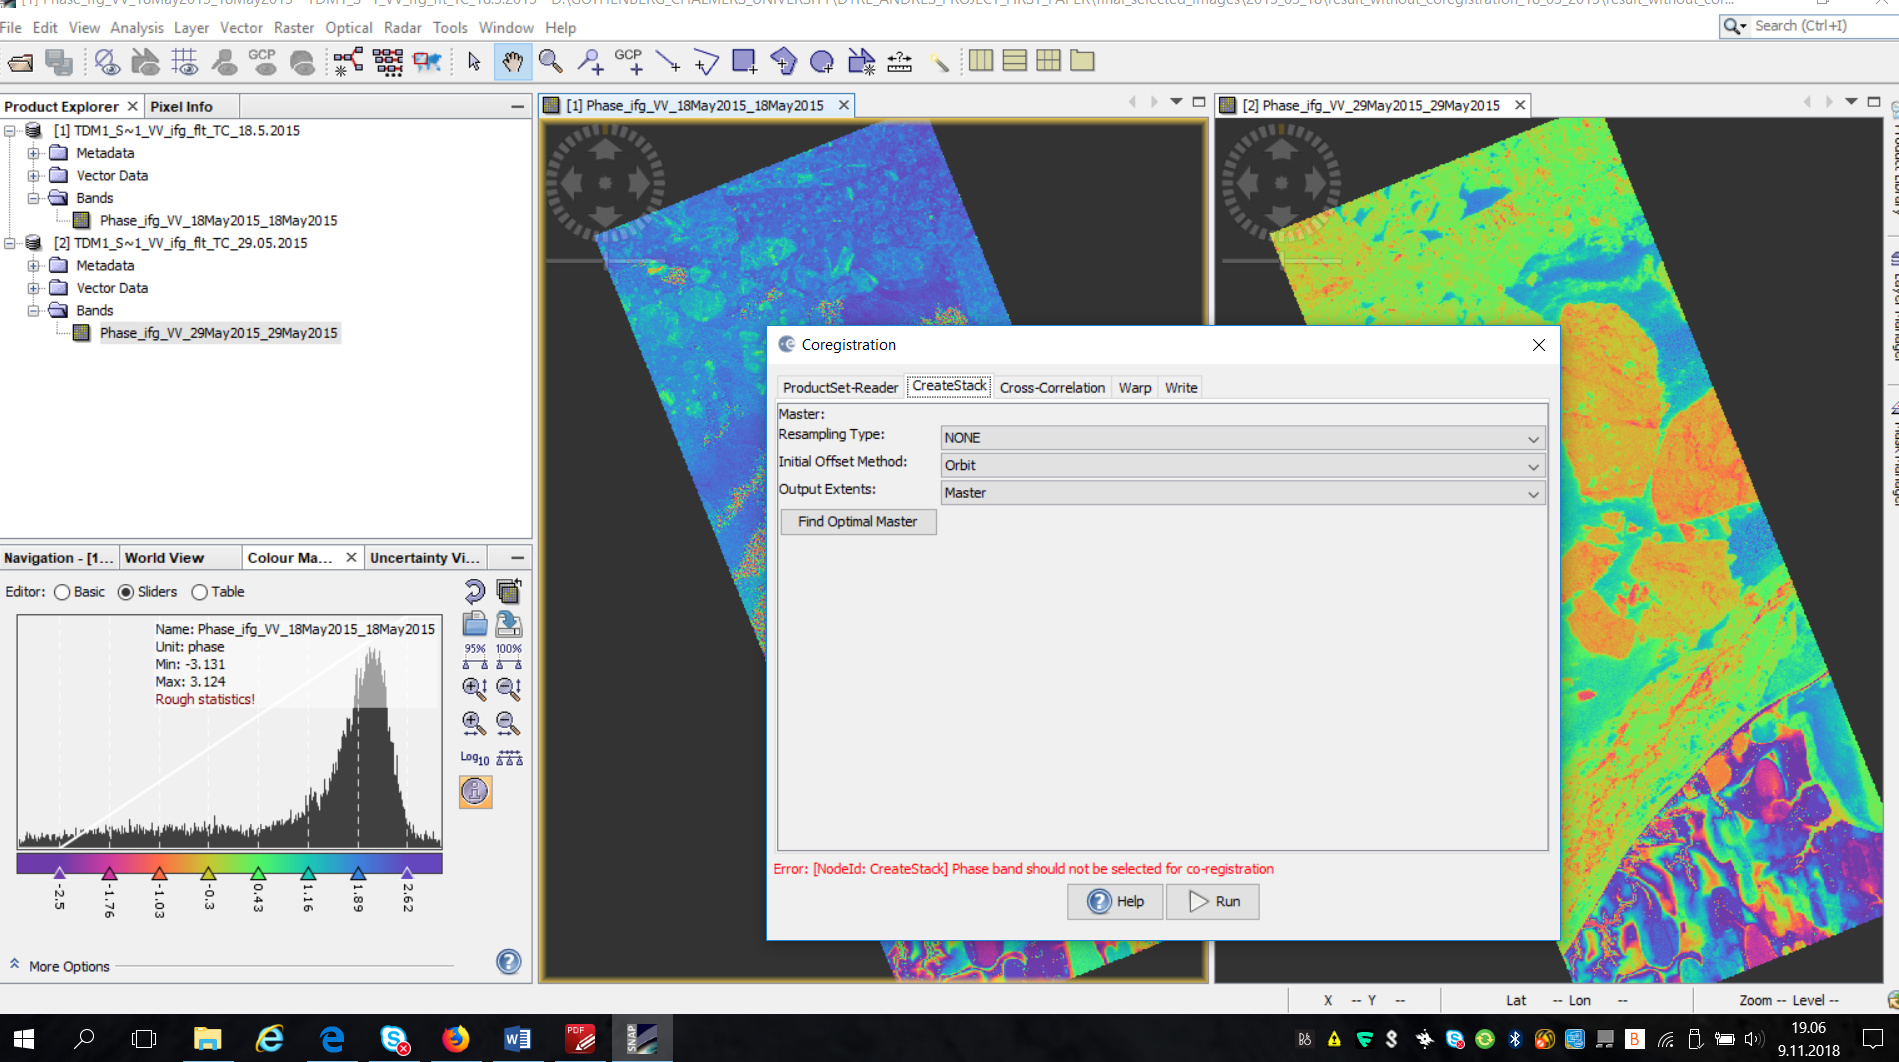
I tried to make stak from two interferograms but it gives me error:
phase band should not be chose for coregistration.
look at below:
Dear @ABraun
You can see in below their difference dimensions;
as I said, this is no problem because collocation adjusts the size according to the master image.
Dear @ABraun
Thanks for your help.
I did collocation (then I did further processing here instead of Matlab) and as you know collocation add ‘collocation flags’ in our bands (figure1).
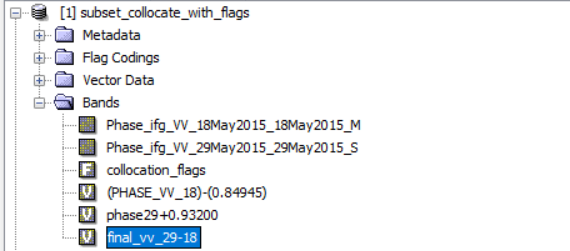
Figure1.
I want to export my final result (‘Final-vv-29-18’ band) in geotif but I think I have to have ‘collocation flags’ because when I do not chose it (figure2), then in next step (figure3), it ask me that:
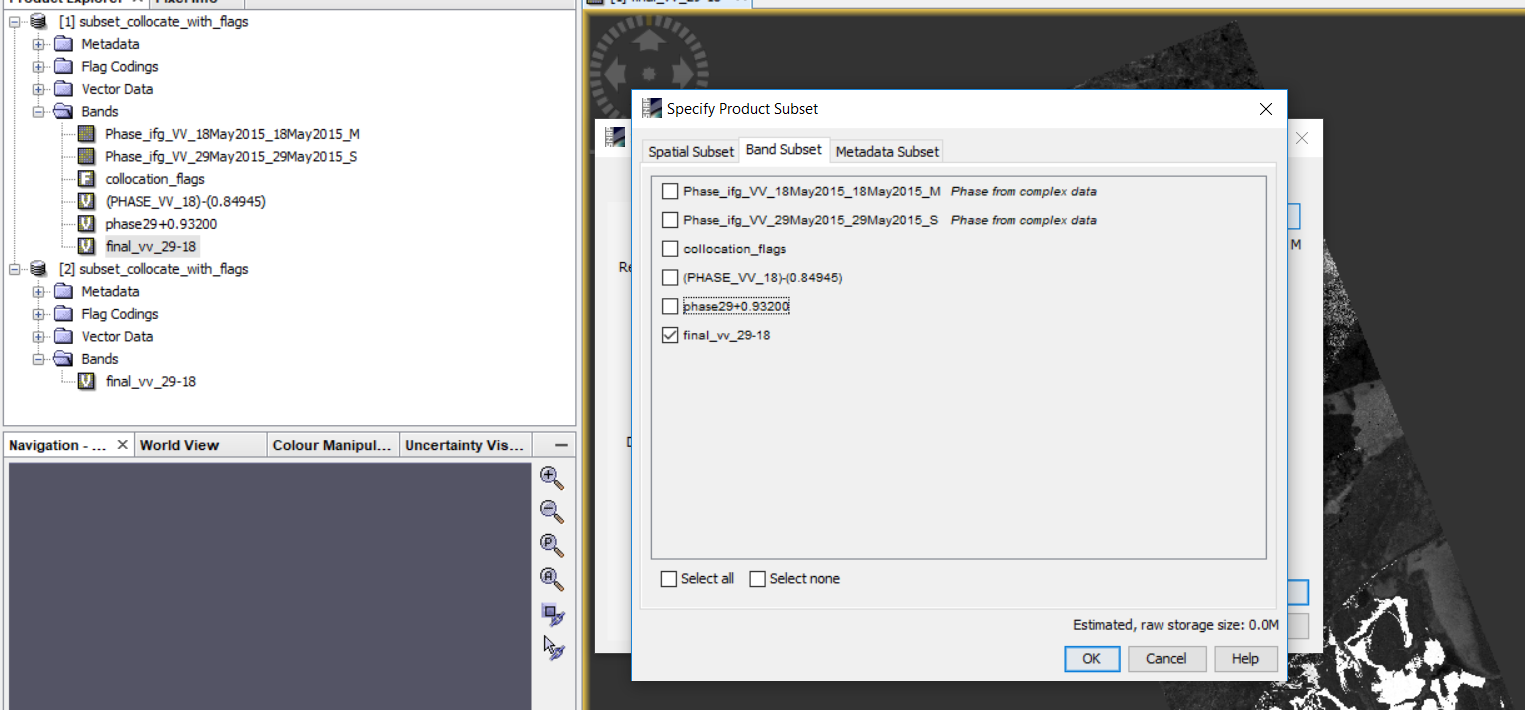
Figure2.
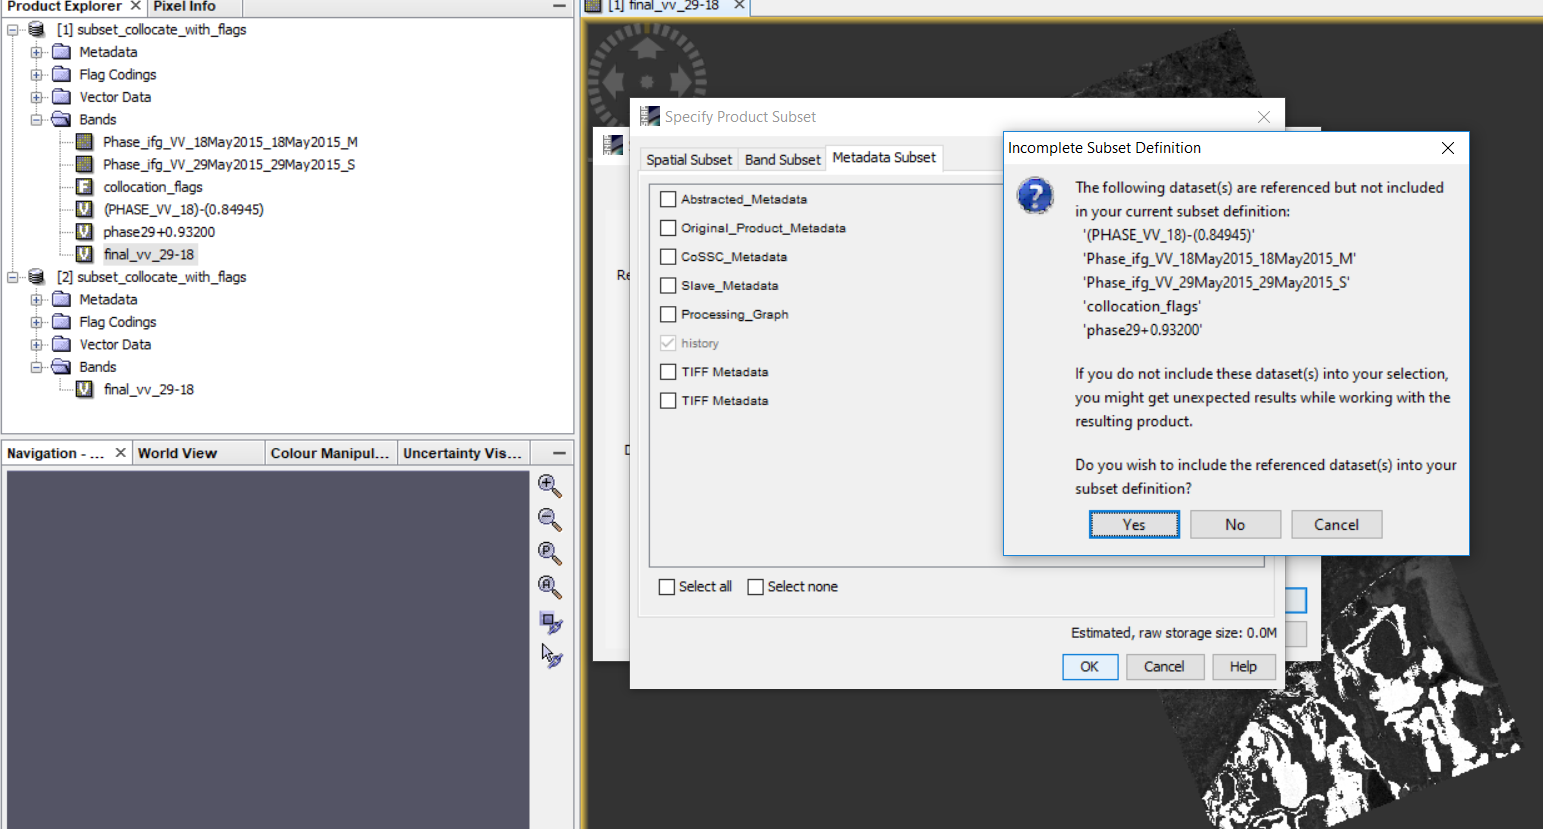
Figure3.
Do you wish to include reference dataset into in your subset definition?
If I chose ‘NO’, then my result is not opening.
If I chose ‘yes’, then I have one extra band (collocation flags) in my result.
Is there any way to only extract ‘Final-vv-29-18’ band’?
Thanks
This is not related to the collocation, but rather to the virtual nature of bands created with band math.
Right click on your calculation and select “convert band“. Then save your product and you can export it.
Did collocation create a correct stack?
Dear @ABraun
Yes, collocation created a correct stack.
Now, based on something you told me, I converted bands but when I want to export my result as a tif again I got same error. Anyway I press ‘NO’ but then I can not open the result in SNAP.
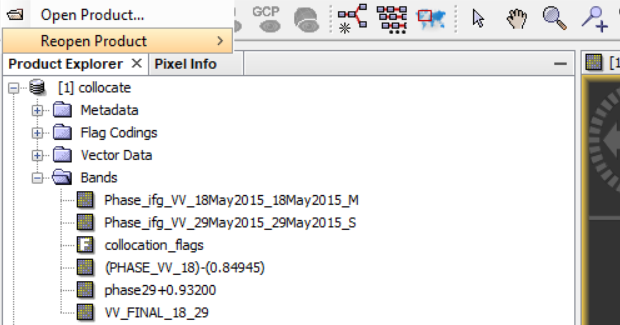
Figure1. Cnverted bands
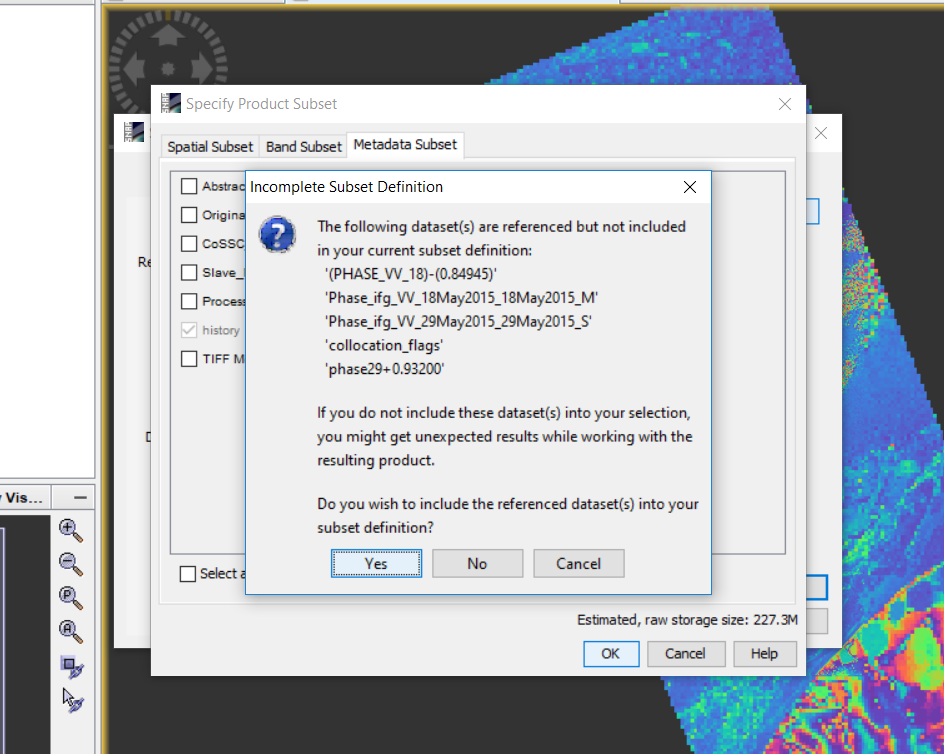
Figure2. Same error
I do not know what is the problem?!
if the band is still virtual, SNAP will ask you this question.
Are you sure you have selected “convert” band and saved the product with File > save product?
After that, the converted raster is no longer dependent from the logics defined in the band maths.
Yes. Now it works. I saved it by right click on data and I think I should use file and then save product.
Thanks 
Dear @ABraun
Sorry for so many questions 
I applied:
Radar…interferometric……products….interferogram formation
Over ‘xml’ file for 26th April (imagine only vv band) and my interferogram is in figure1.
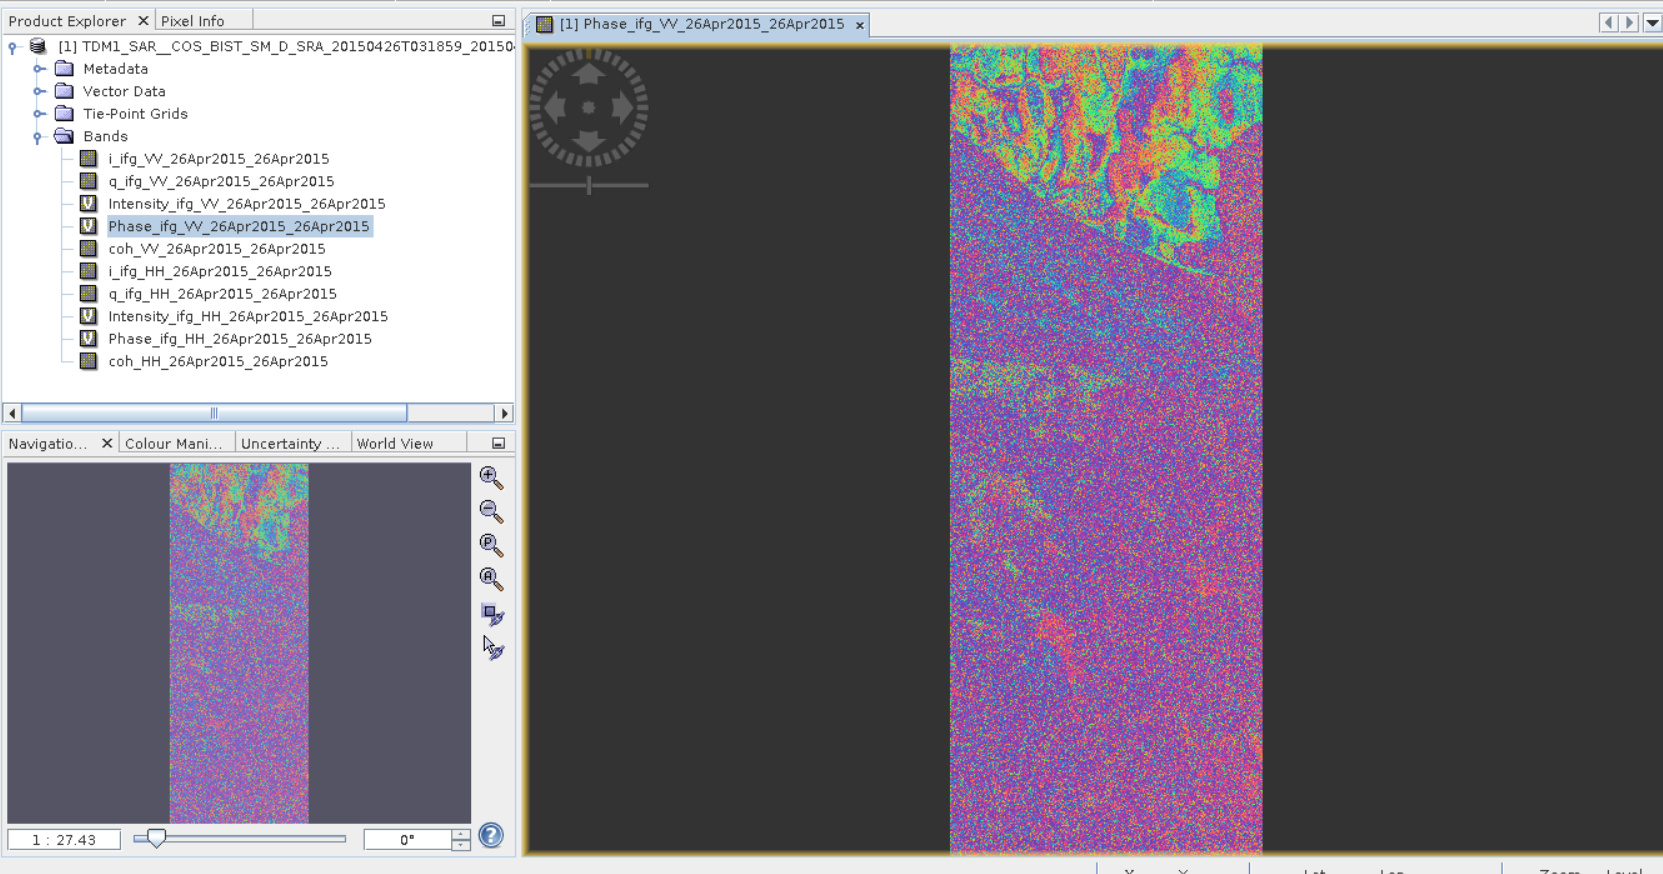
Figure1.
But when I applied exactly same process over another day-28th January- then I got below figure (figure2).
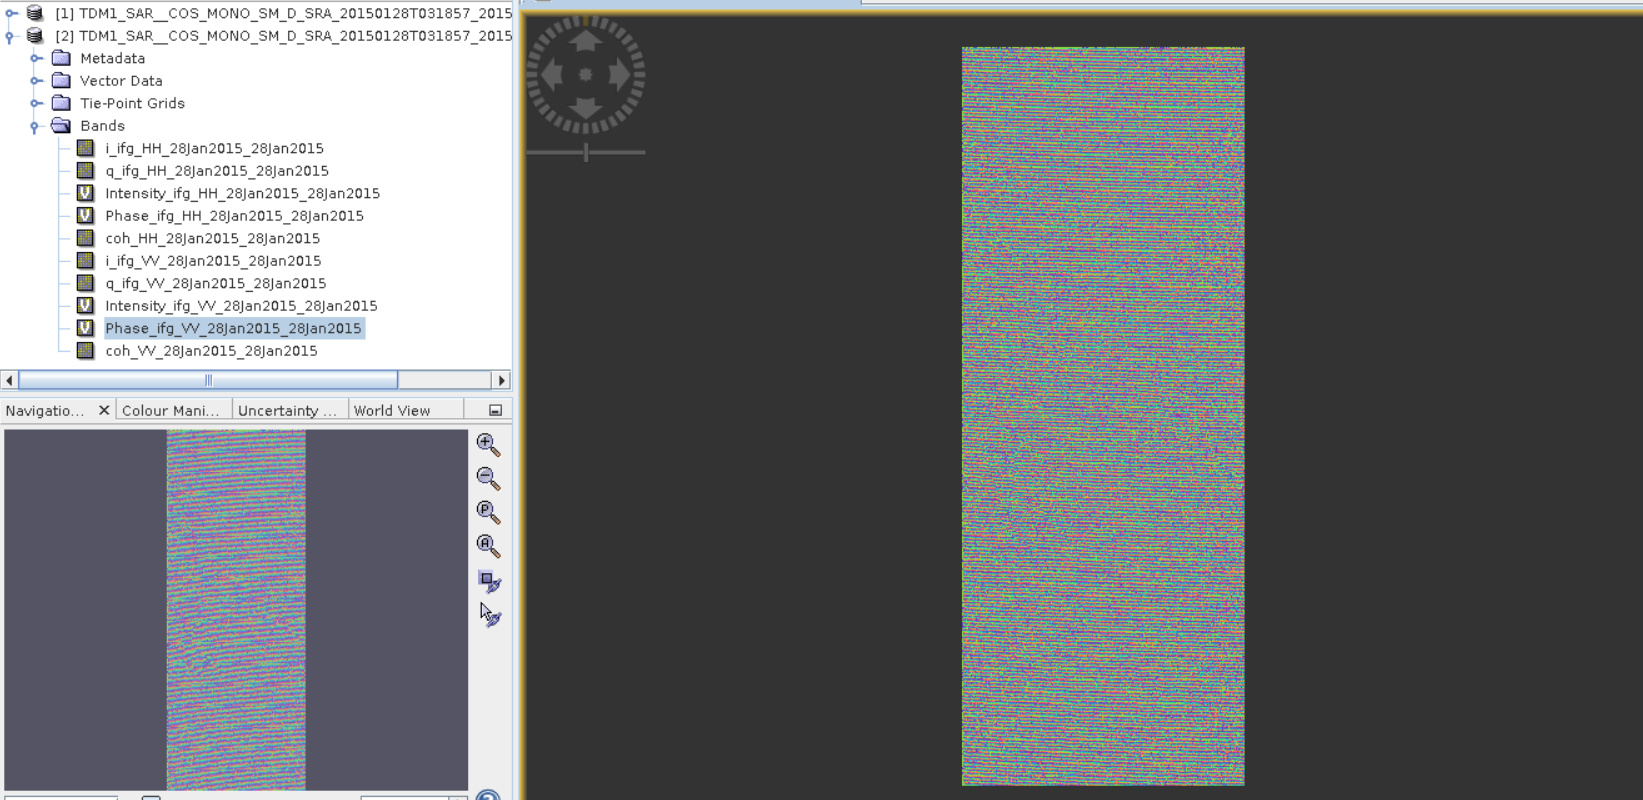
Figure2.
Why I have these right strips in figure2 (I did completely same process) ?
Thanks in advance.
very strange indeed. Are the two images of the bistatic product of 28.01. well coregistered? Make an RGB composite again to see if they match.
My guess is that SNAP doesn’t correctly overlay these images (even if they are from the same acquisition product)
I did not do coregistration. I used ‘XML’ file that is already coregistrated and then applied ‘interferogram formation’. How can i make an RGB composite?

Dear @ABraun
I have ‘bistatic’ and ‘pursuitmonostatic’ in my data. Interferograms are OK for bistatic mode but I get some strips over ‘pursuitmonostatic’.
Is there any way to remove them?