By coregistration I meant that both images should be already aligned when opening a TDX pair.
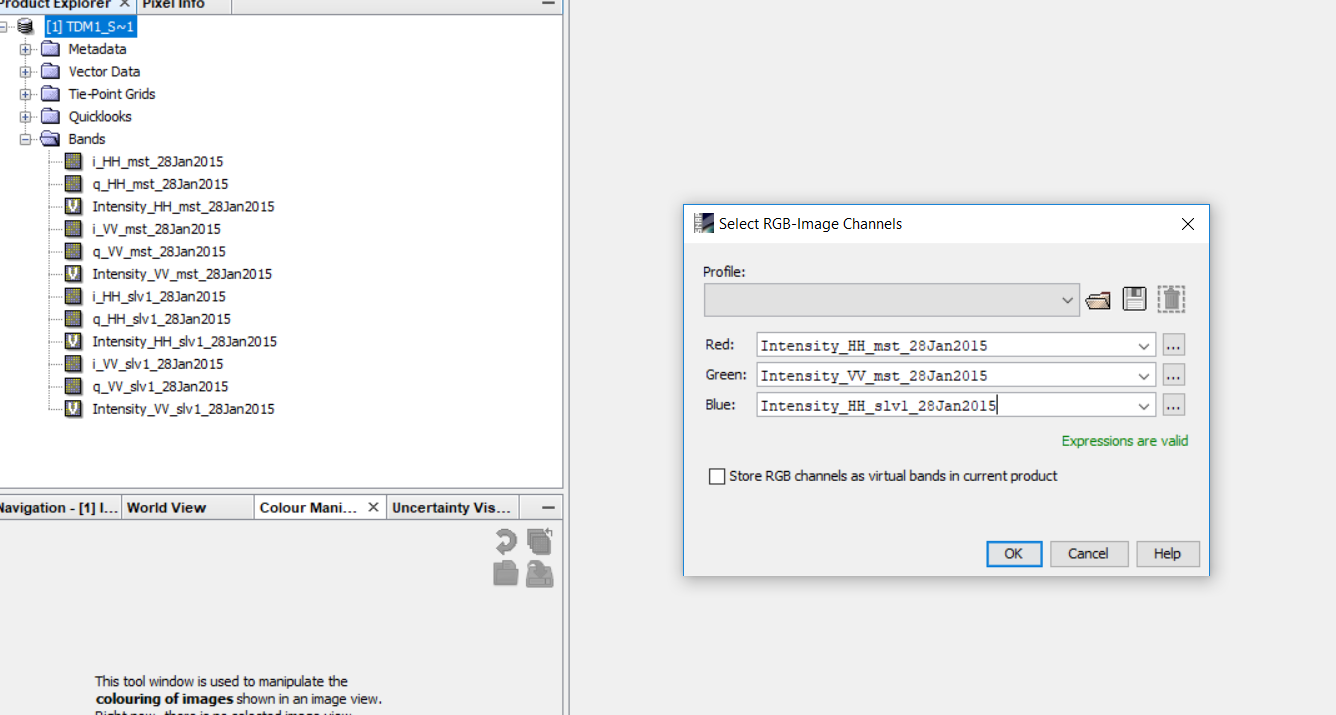
Right click on the original data opened by the XML > create RGB
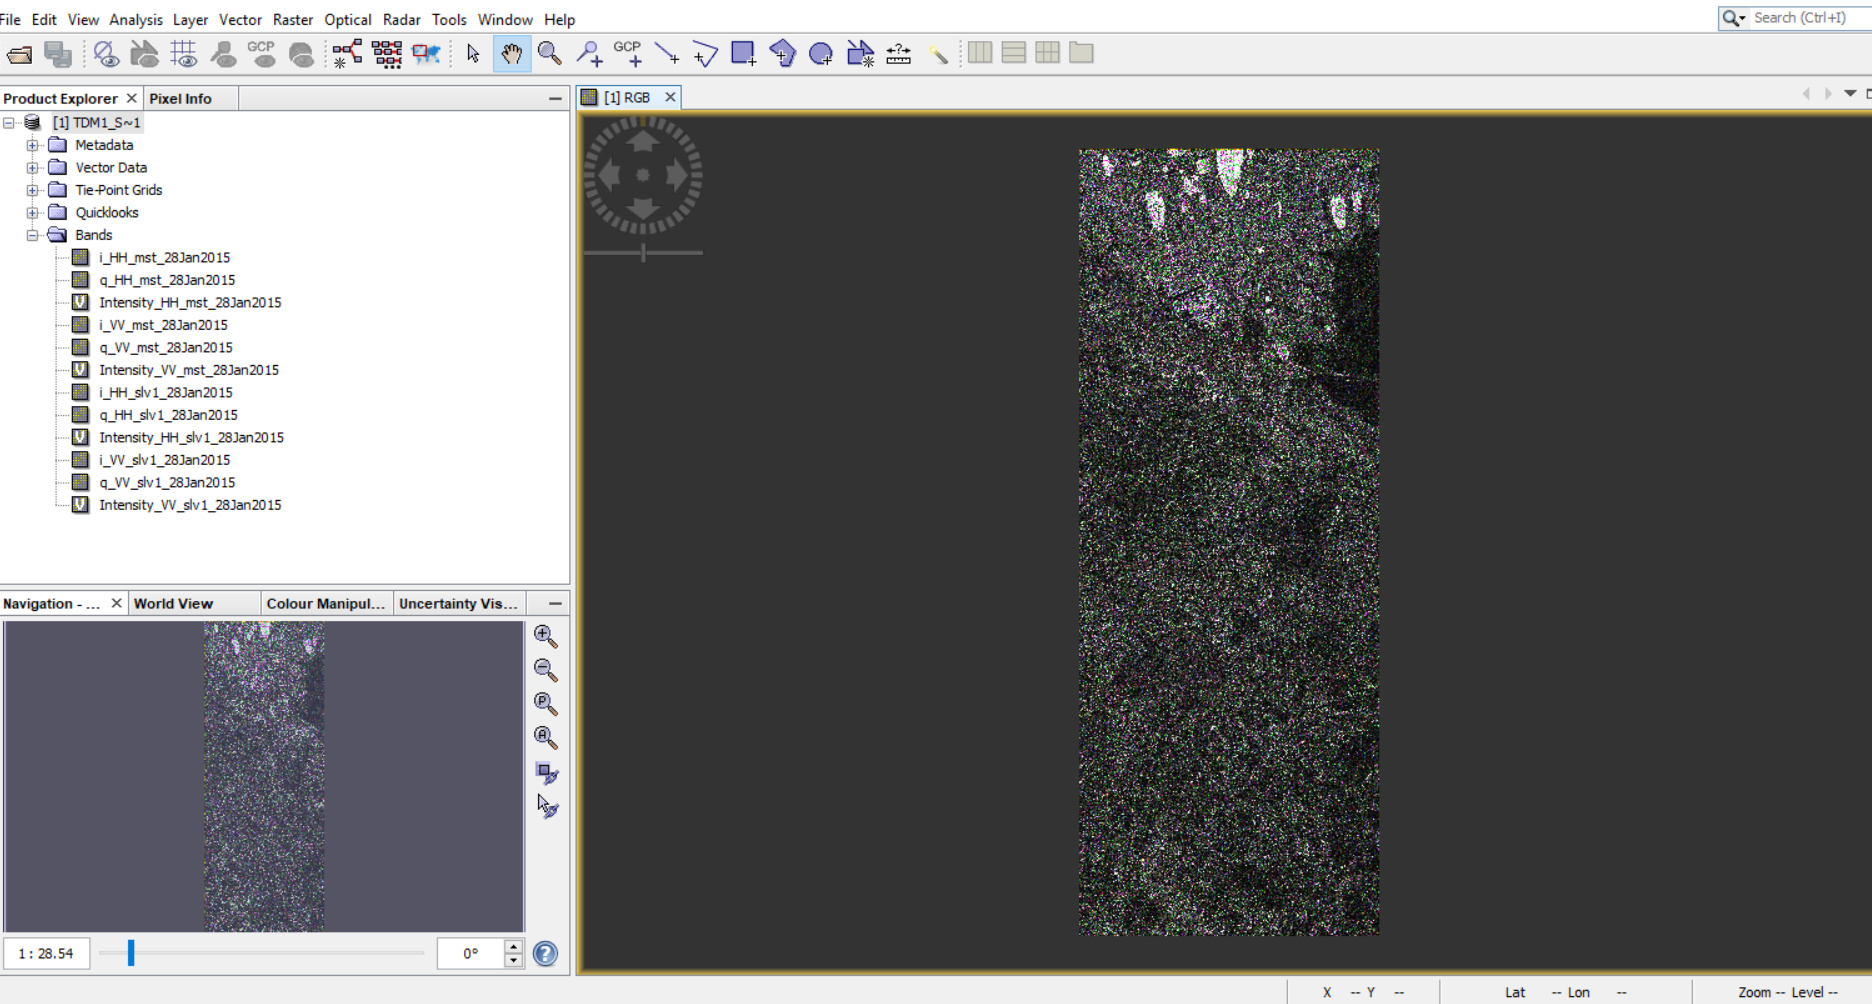
select both intensity layers for red and green. The result shows you both overlayed as colors. Described here:
Dear @ABraun
As i told you I want to see topography changes between two days (18 and 29) by TanDEM-X products.
As i know i should do below steps;
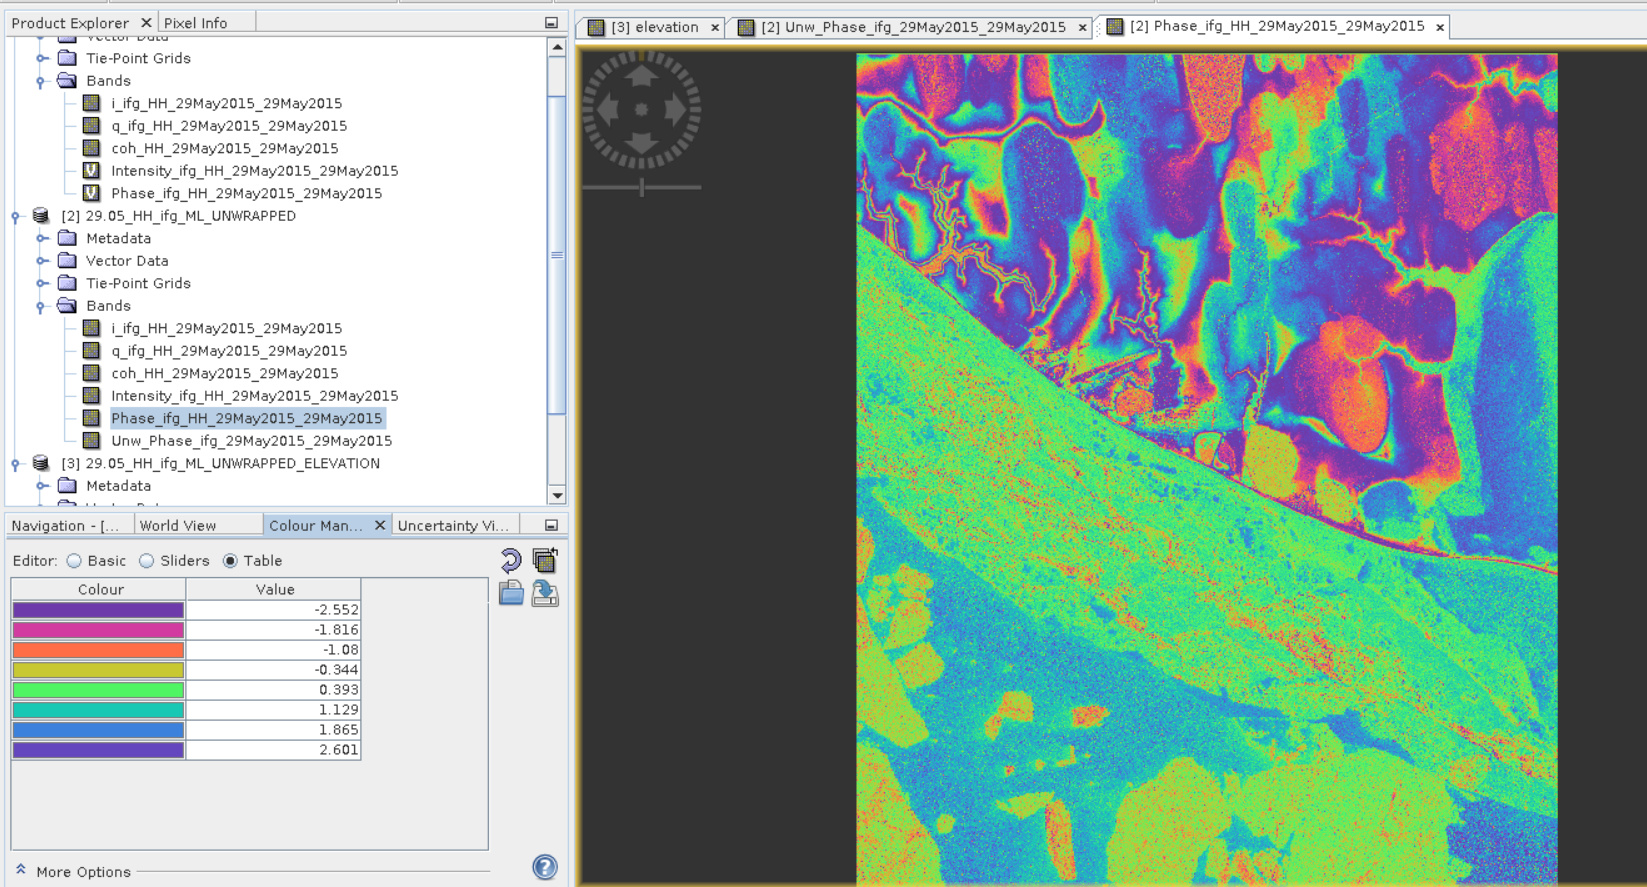
Step 1: Construct 2 interferograms
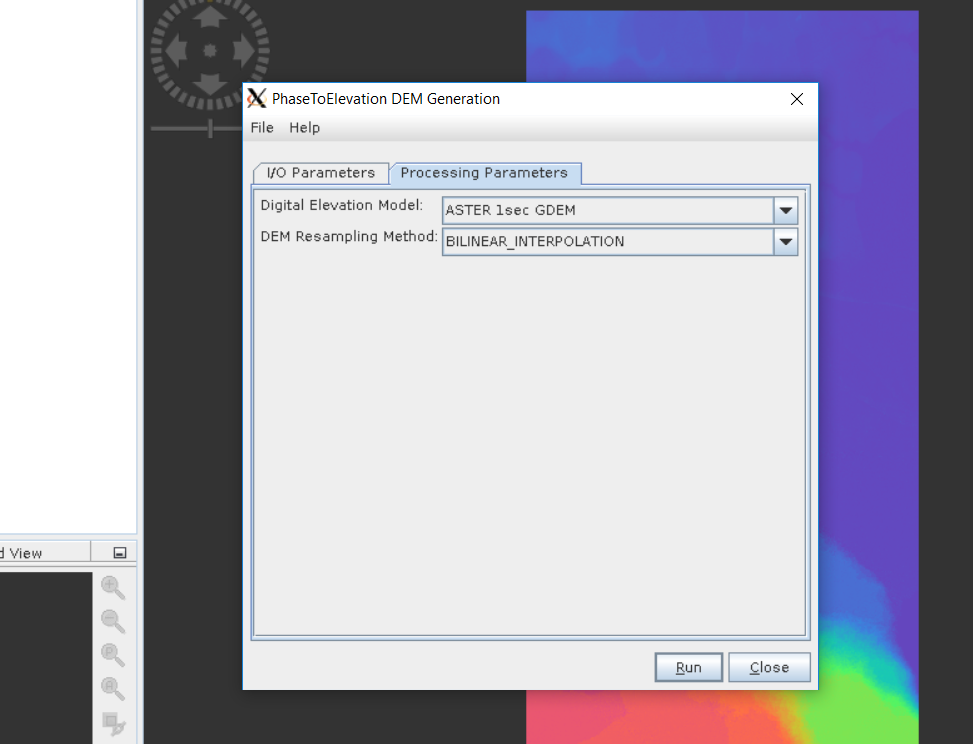
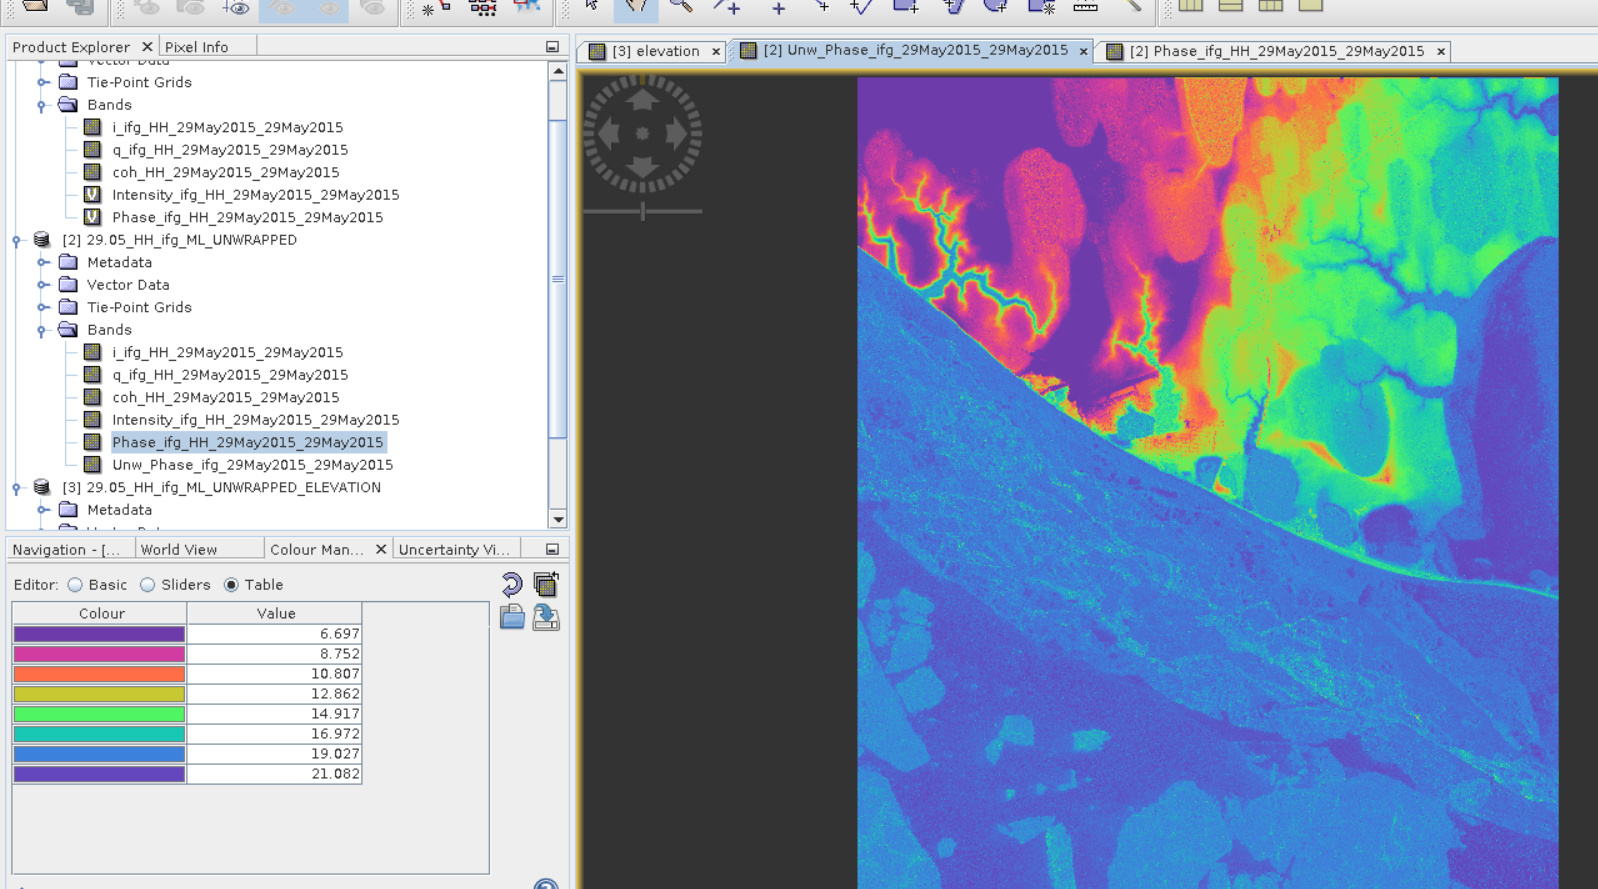
Step 2: Create DEM from each of the interferograms
Step 3: Calibrate DEM
Step 4: Subtract DEMs
But would you please let me know how can make DEM from from each interferogram? Is there any totourial for it?
I think I should do these steps that you already mentioned
Create one interferogram per date (based on only one polarization), unwrap it and convert it to elevation. Then you can subtrackt the absolut elevations of both dates to search for changes.
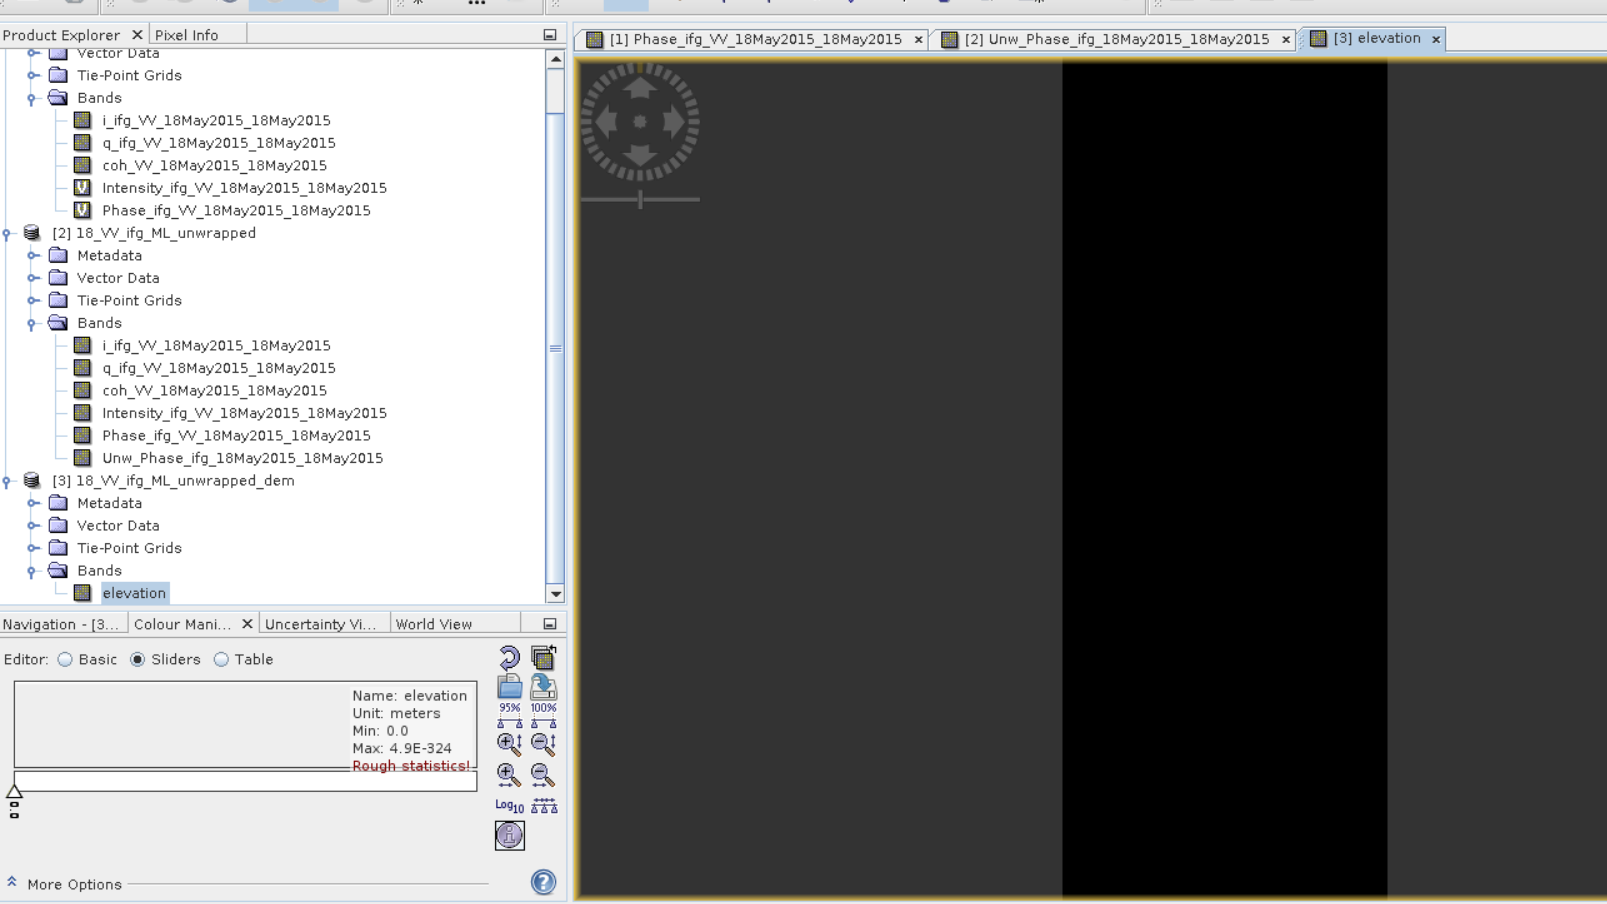
Is it really black or does it just have few extreme pixel values which distort the contrast?
Use the statistics tool to find out or set manual min/max values in the color manipulation.
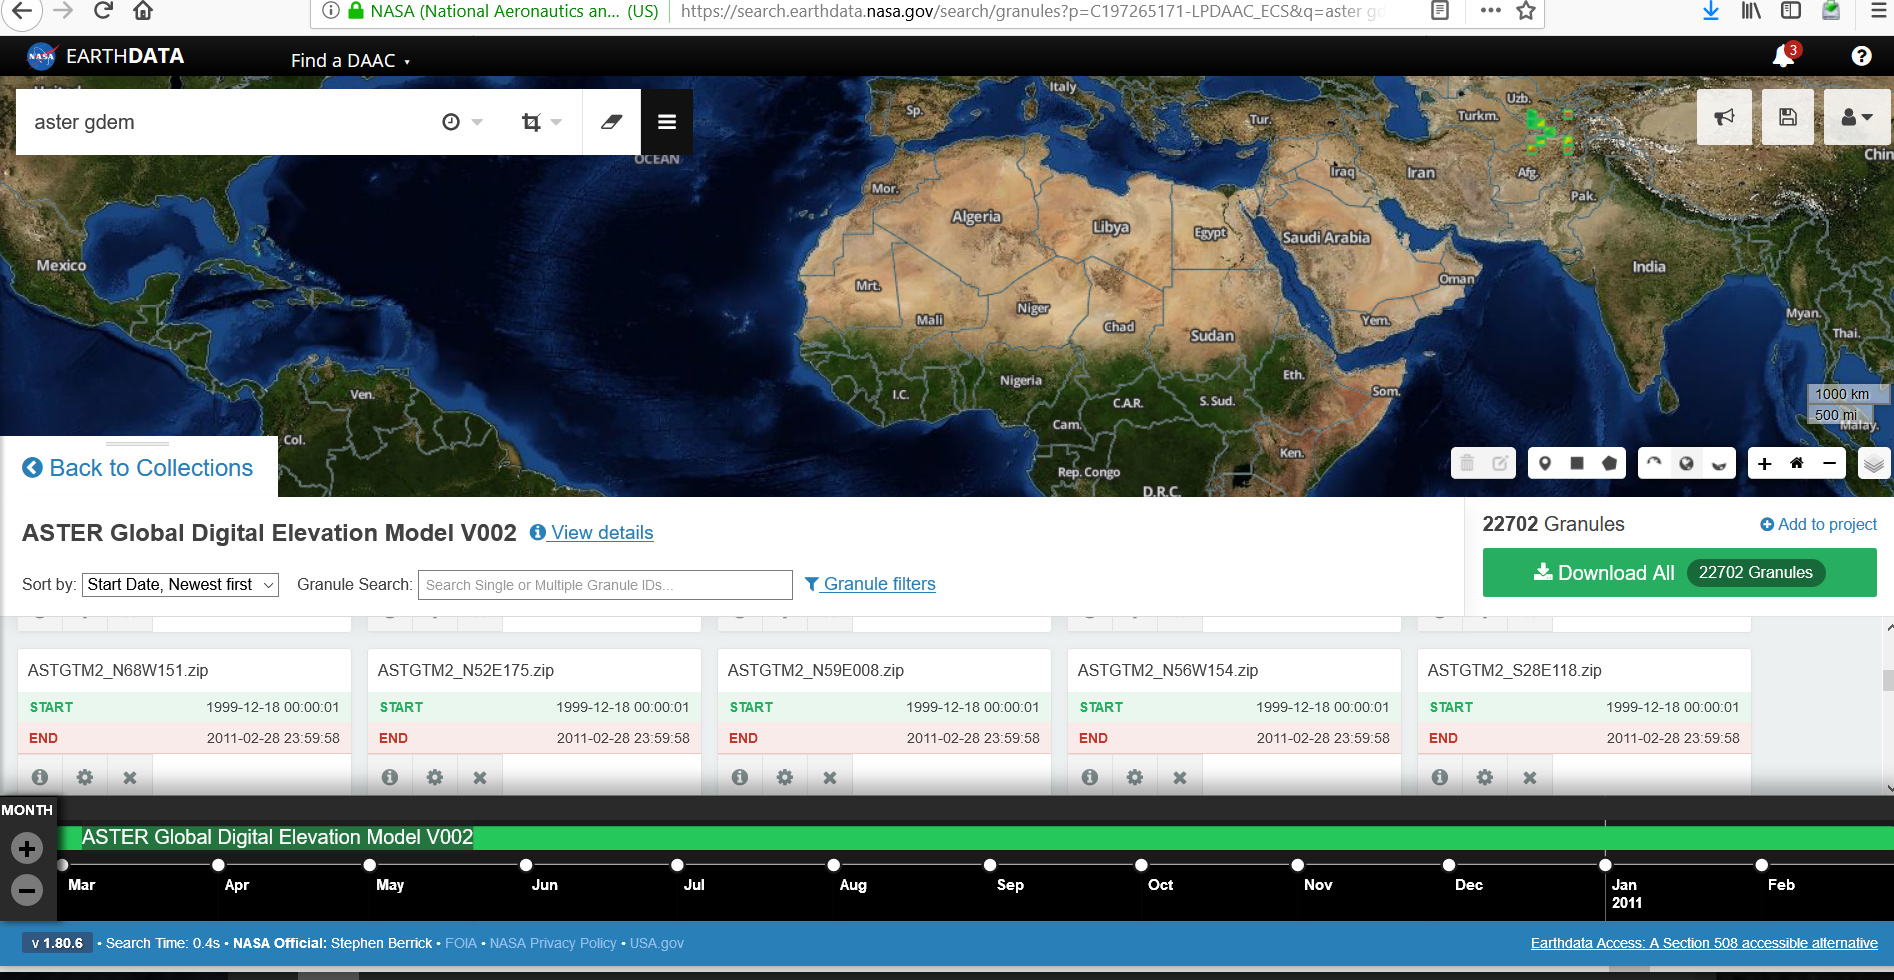
Try a diffent DEM, for example and see if it persists, even if the DEM is of very low resolution. You could at least exclude the ASTER GDEM as an erros source then.
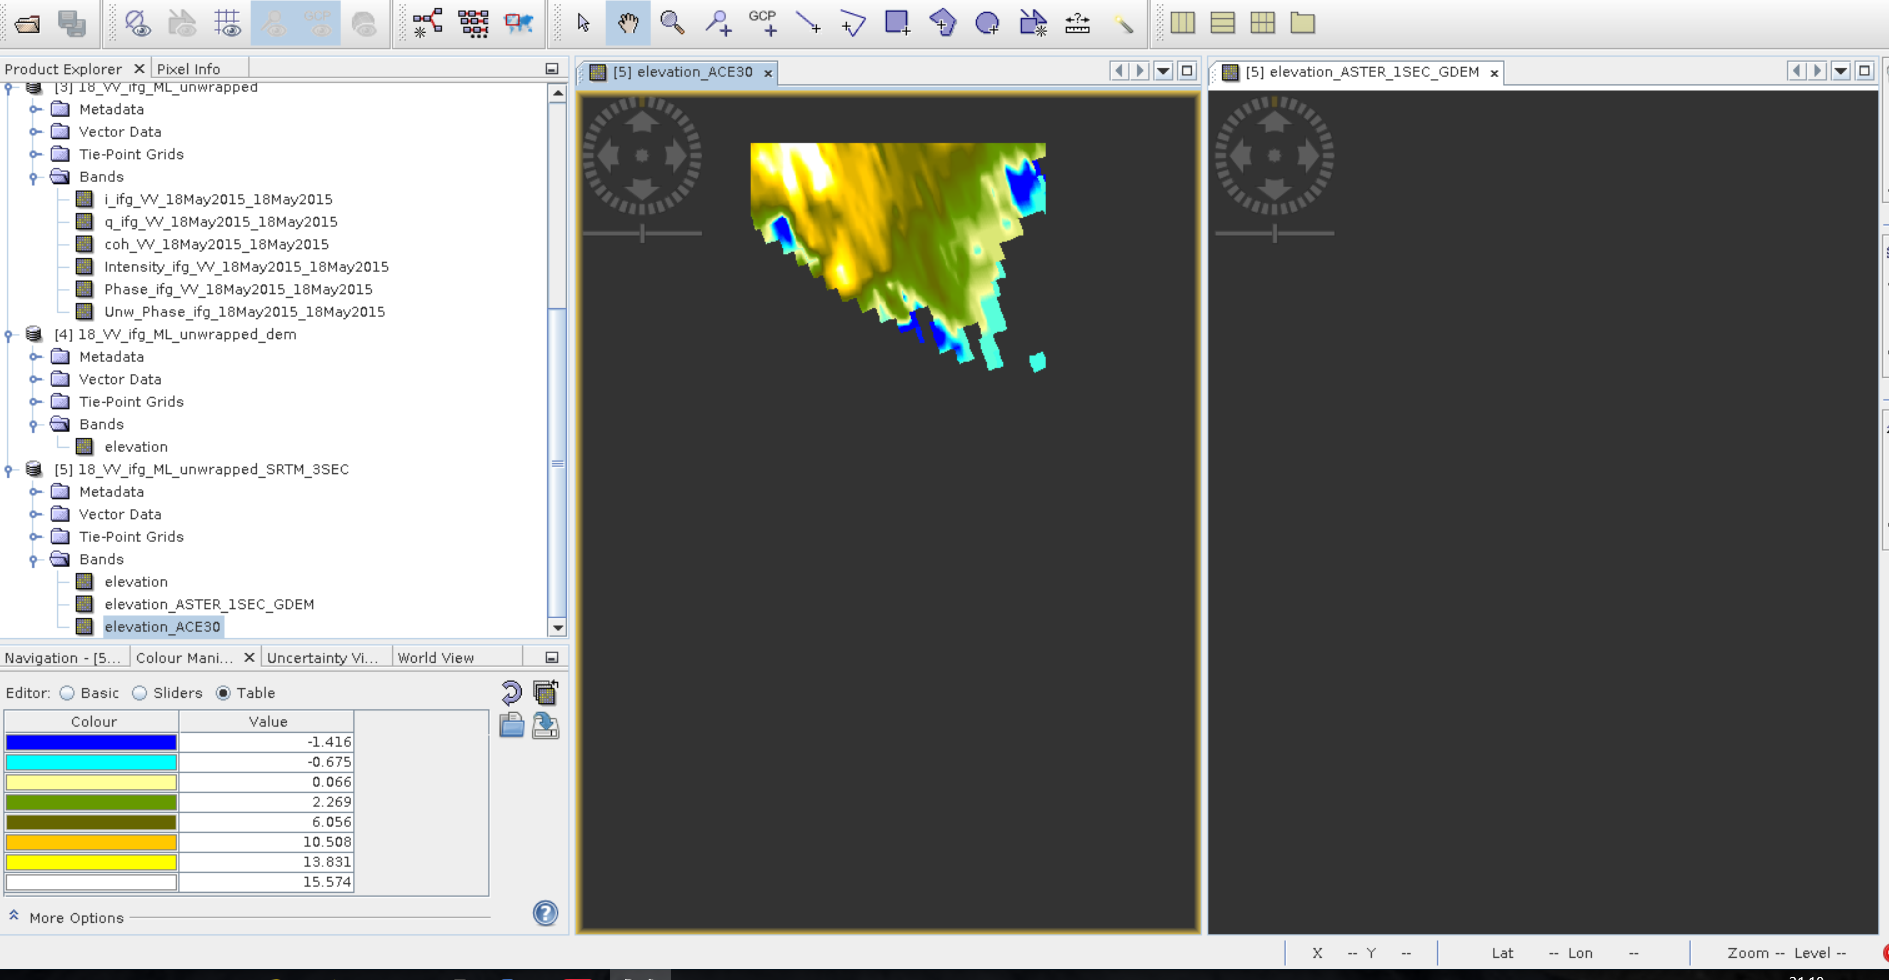
Right-click on the data and select “Add elevation band” to get an idea of the DEM quality in your image…
If nothing helps, repeat the unwrapping with different parameters (e.g. SMOOTH instead of TOPO, there are lots of discussions on snaphu in this forum)
and so on, and so on…
Nobody knows this data better than you. Be confident to seach for possible error sources, try to find explanations. In case you did, tell us what you already tried, so we can narrow it down. The “Phase to elevation” has no paramters to adjust so it must have another cause.
Try a diffent DEM, for example and see if it persists, even if the DEM is of very low resolution. You could at least exclude the ASTER GDEM as an erros source then.
I used ‘ACE 30 (Auto download)’ and the result is in figure 2.
I do not know my elevation result is correct or not? And why ‘ASTER GDEM’ did not work?
Right-click on the data and select “Add elevation band” to get an idea of the DEM quality in your image…
I added two elevation bands for ‘‘ACE 30 (Auto download)’ and ’ ASTER GDEM’. I can not see any image in ’ ASTER GDEM’ but there is something in ‘‘ACE 30 (Auto download)’ (figure3). Why is like this?
If nothing helps, repeat the unwrapping with different parameters (e.g. SMOOTH instead of TOPO, there are lots of discussions on snaphu in this forum)
and so on, and so on…
Nobody knows this data better than you. Be confident to seach for possible error sources, try to find explanations. In case you did, tell us what you already tried, so we can narrow it down. The “Phase to elevation” has no paramters to adjust so it must have another cause.
I mean that parts of your study area might lay within areas which are not contained in a DEM because they are off the coast, which could be an explanation for why the ASTER GEDM failed.
There is a small part of land in my images and most of my area is ice. Can this be a reason? If yes, then why it worked with ‘‘ACE 30 (Auto download)’?
another thing that came to my mind: You downloaded the ASTER data before applying this module, right?
As stated in the drop down menu, it is not Auto Download. That means, it must be downloaded manually and placed in the correct folder, as described here: External DEMs
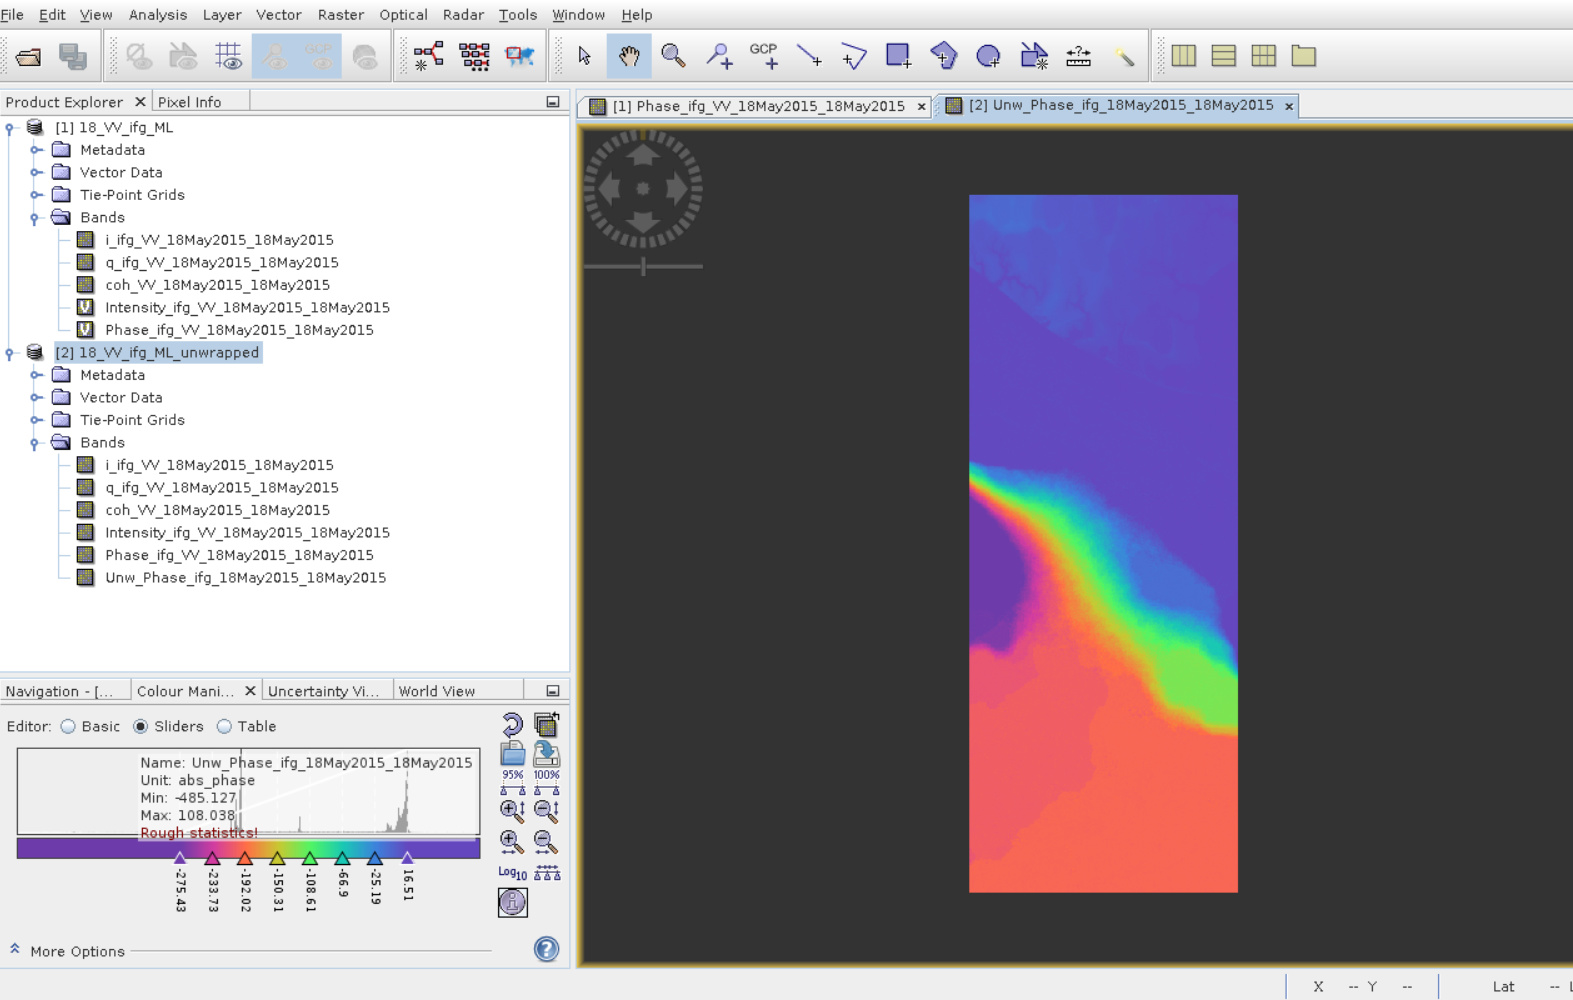
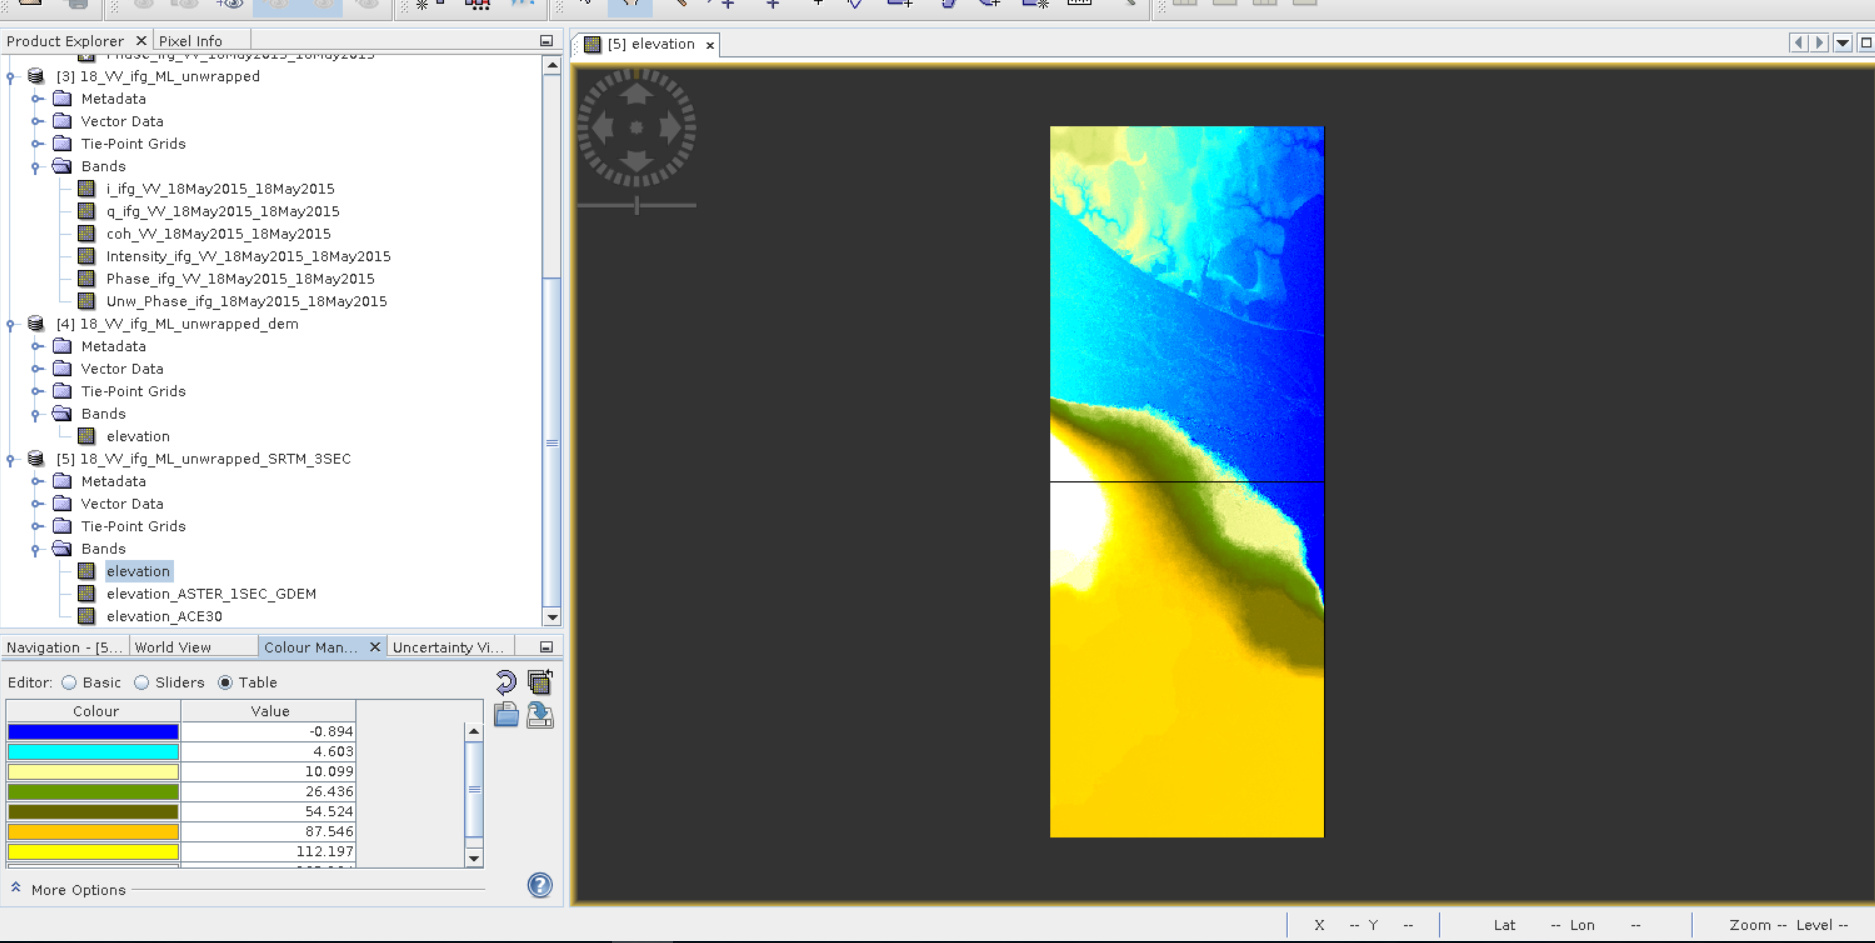
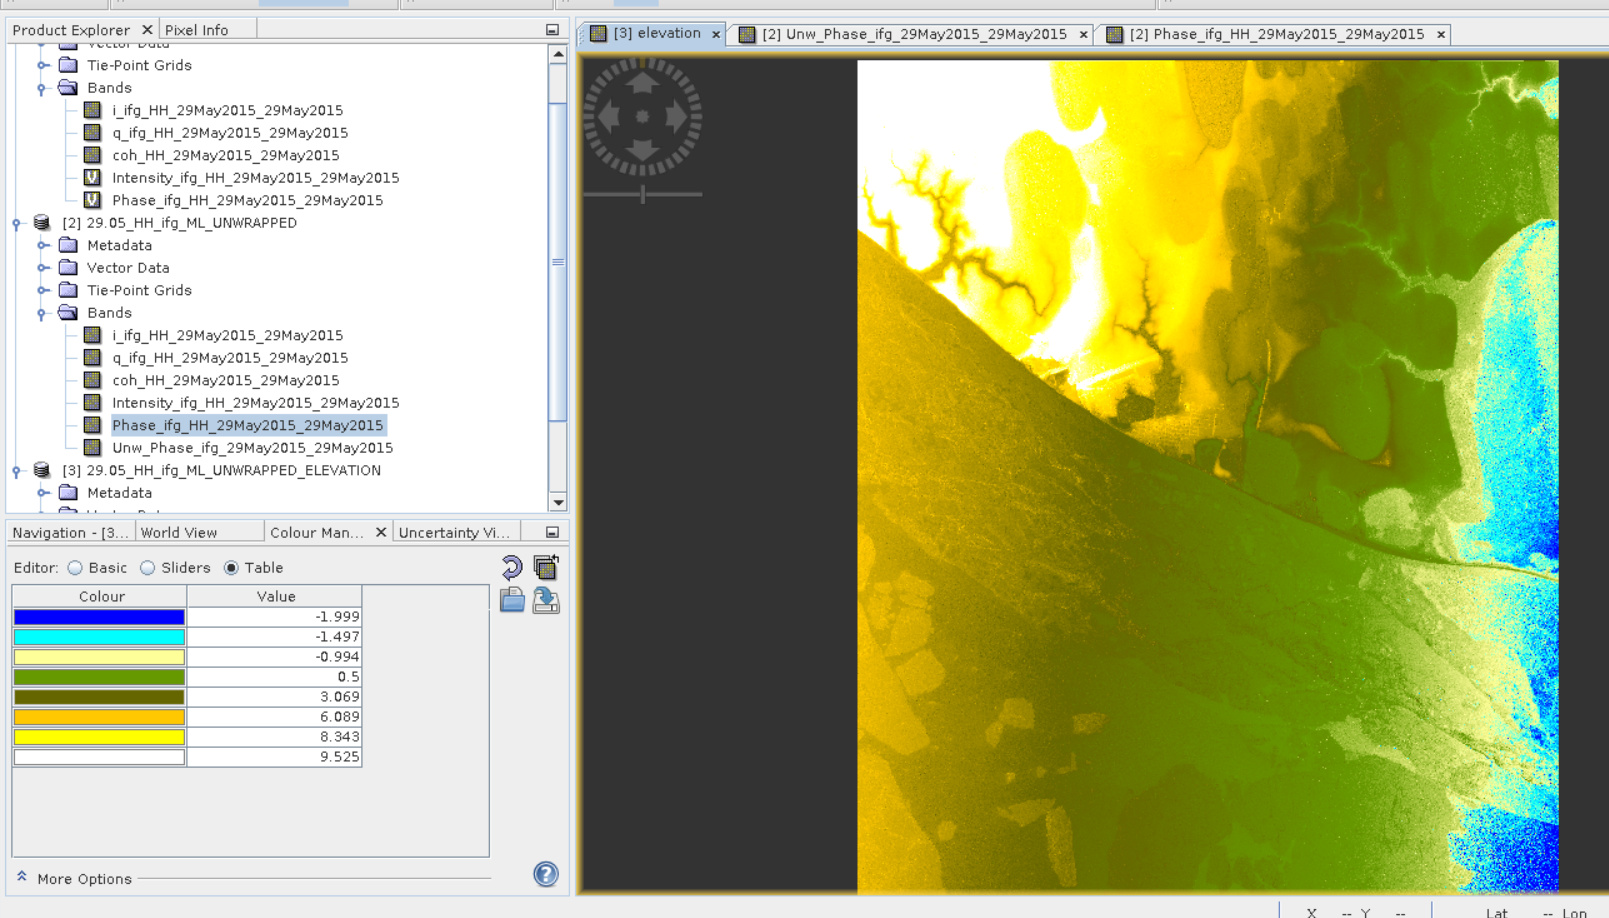
This is my first experience about DEM with TanDEM-X data and I do not know how good is the result! but I do not know why there is a gradiant (i mean a color pattern from left to right _ yellow to blue_) on my elevation result?
looks very good. The could be caused by large along-track baseline of the pursuit mode. Maybe you find some indications on DEM quality from this mode in this publication:
Add the elevation band to your product as I explained above to compare the unwrapped result with the real elevations from ACE30. Definitively worth trying ASTER as well as it is of clearly better quality.