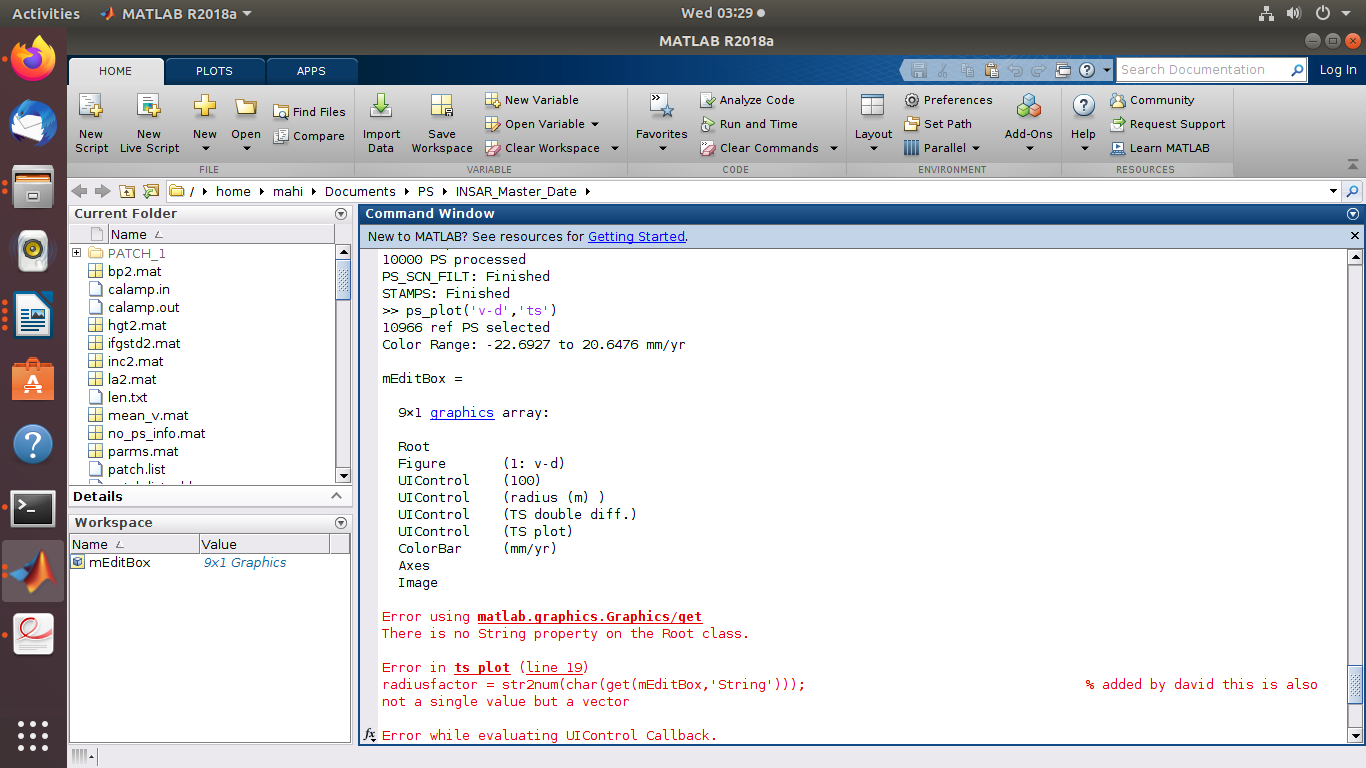
I would like to plot in Matlab time series for a few PS points, but after I click on the ‘TS plot’ button on resulted graph, I get the following error message:
ps_plot(‘v-do’,‘ts’)
4918 ref PS selected
Warning: MATLAB has disabled some advanced graphics rendering features by switching to software OpenGL. For more information, click
here.
Color Range: -87.0554 to 63.1659 mm/yr
Error: A BREAK may only be used within a FOR or WHILE loop, and then only within the same file as its corresponding FOR or WHILE
statement.
Error while evaluating UIControl Callback
This definitely needs some more context.
I guess you are talking about StaMPS processing of interferograms exported by SNAP but how can we know this? Just posting a random error message won’t get you much help.
What is your data? What have you done with it so far? For which aim? At which step does the error occur? Only for this dataset or also for others? Which solutions have you already tried?
Without that information chances that someone understands your problem are probably low.
I was refering to the Matlab processing. After unwrapping and estimating the mean velocity, I would like to plot time series for a few PS points. But when I click on the “TS plot” button on the results graph (using ps_plot(‘v-do’,‘ts’)) I get the above error message.
@Andreea
Recently, I changed from Matlab 2013b to 2016b and meet the same problem.
I found in R2016b version that after you correct the “break” to “return” in the code of stamps ( “ts_plot.m” and “ts_plotdiff.m”) and the problem can be solved!
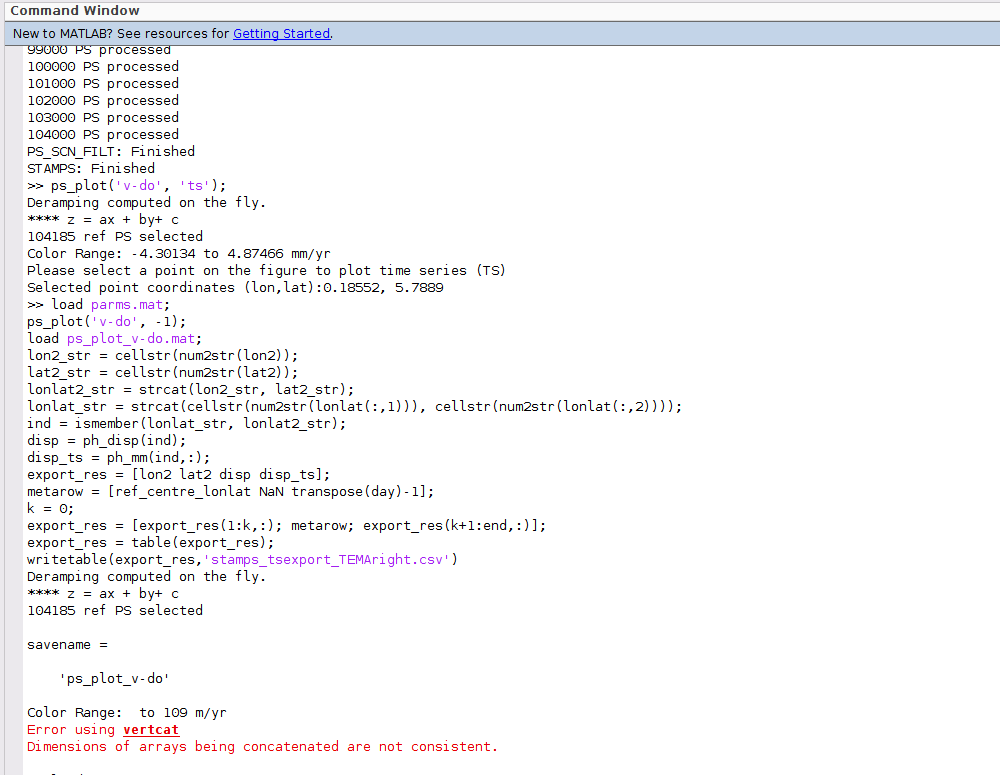
I ran the PSInSAR process to the very last step where I used the command ps_plot(‘v-do’, ‘ts’); in matlab. I then tried exporting the CSV file using the command below: