but from all this information i am trying to make a matlab script that will take the time_series as presented in ps_plot(‘v-do’, ‘ts’) of both the ascending and descending image stack to merge these into vertical displacement based on raster operations.
for this i would like to know which files contain the incidence angle per pixel and also the deformation per pixel over all image pairs. the documentation on this is almost not available so i hope any og you can give me a head start on which matlab files to use for this script.
it includes a readme and in the end i used a simple method do calculate the vertical displacement.
The scripts are a mess since they were made on the fly to finish my thesis but i hope you can extract something from it.
There was 1 ascending track and 2 descending tracks available, so i took the mean displacement of these 3 images for my final results, thats why you see 3 folders. Within these folders there were 2 timeseries of insar images (1 series before the fire and 1 after the fire). I will look into the scripts and see if i can extract the part i used to calculate the vertical displacement and give it to you.
Sorry for the long wait, I am not regularly checking this forum anymore and kinda forgot that i would do this.
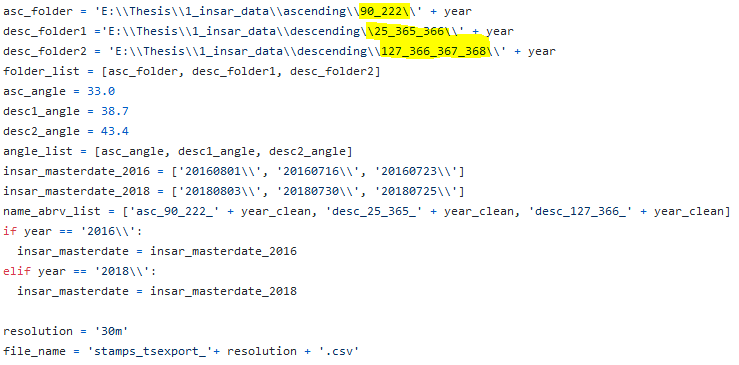
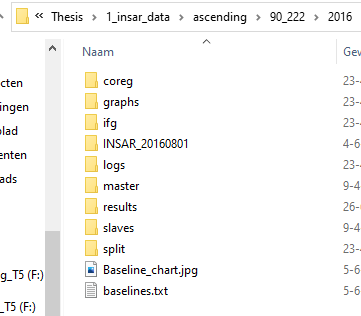
So my folder structure looks like this:
Which is just all the input files for Snap2stamps and the provided output which goes into stamps.
After running step 1-8 of stamps I run the code for extracting the PS points and their values which is located here: StaMPS-Visualizer, SNAP-StaMPS Workflow or in my documentation (https://github.com/gjvanleeuwen/SNAP-StaMPS-Visualizing) under the header " how to process in StaMPS". I save the points to a csv which is located in the results folder which is the only thing you need.
When you have the points saved as a csv I work through the points using the provided functions to calculate the vertical displacement (**** assuming only vertical displacement, for 3D read: https://doi.org/10.1016/j.earscirev.2014.02.005).
The functions i used combine 3 tracks because for descending i had 2 available tracks over my study area. With a bit of python skills you can easily change the script to read only 2csvs and combine them in almost the same way.
** note that the incidence angle i used to calculate for my measurements may differ for your study area, explenation regarding how to find this angle are located here: Difference between vertical and LOS displacement
If anyone has any problems doing this please email me, i can help with your coding stuff.
Thank for for your contribution.
I am new in SAR data analysis with SNAP. I am studying the vertical displacement (subsidence and uplift) of an area. For most of the tutorial that i have consulted, the InSAR analysis is performed on data from exactly the same orbit. I mean the data (master and slave) downloaded from ASF overlap at 100%. I would like to know it is possible using SNAP to perform InSAR analysis from for example descending and ascending data. In case it is possible, what would be the advantage?
when all images are from the same track, you get the displacement along the line-of-sight (LOS) between the earth and the sensor.
If you want to have vertical displacement, you need images from both ascending and descending tracks. There are lots of approaches to achieve this, some are strightforward, others are more complex. At the moment, none of them is implemented in SNAP.
I think you are following my tutorial and to do both ascending and descending you will just have to do all the steps for both tracks separate. In the end you can combine the LOS results using one of the methods @ABraun mentioned above.
I have downloaded your thesis. Thank you for your kind support and your hard work. I think we treat similar problems. I am interested in investigating land subsidence evolution following an earthquake that happen in 2007. therefore since there is no available sentinel data up to 2014. I will start from 2015 combining your method and the materials provided by @ABraun
I am sorry to bother you again. I am using windows 10 and i don’ t have MatIab licence. I know that the processing of StaMPS should be run in Linux terminal. I have installed ubuntu subsystem in my windows environment. I would like to know if it is possible to run Matlab environment of StaMPS without having full licence of Matlab. Is the licence include in the Matlab environment of Stamps? or shall I separatly buy a Matlab licence to run Matlab script in StaMPS in the subsytem linux of my windows?
StaMPS was developed under Linux, but some scrips are written in Matlab and need the core installation the Signal Processing Toolbox. Currently, there is no way around it.