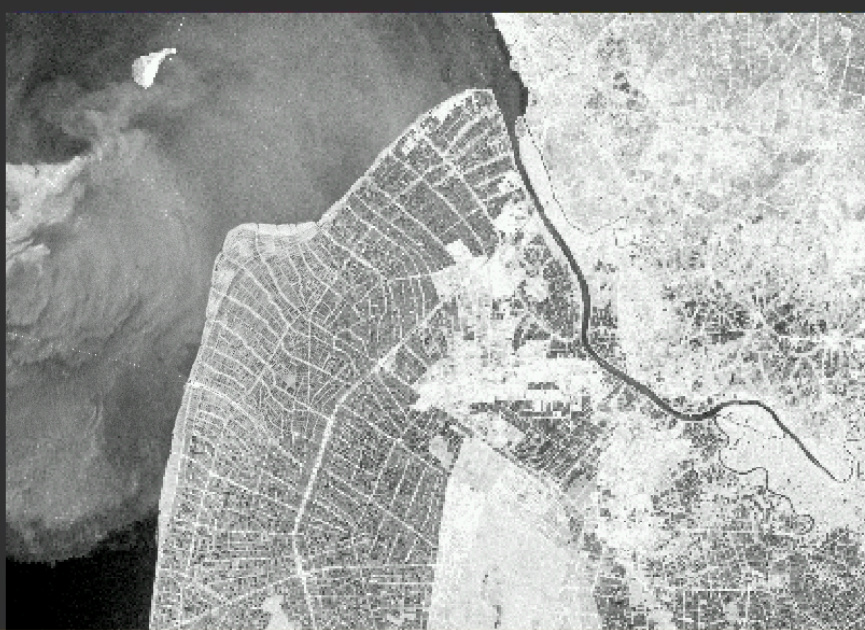
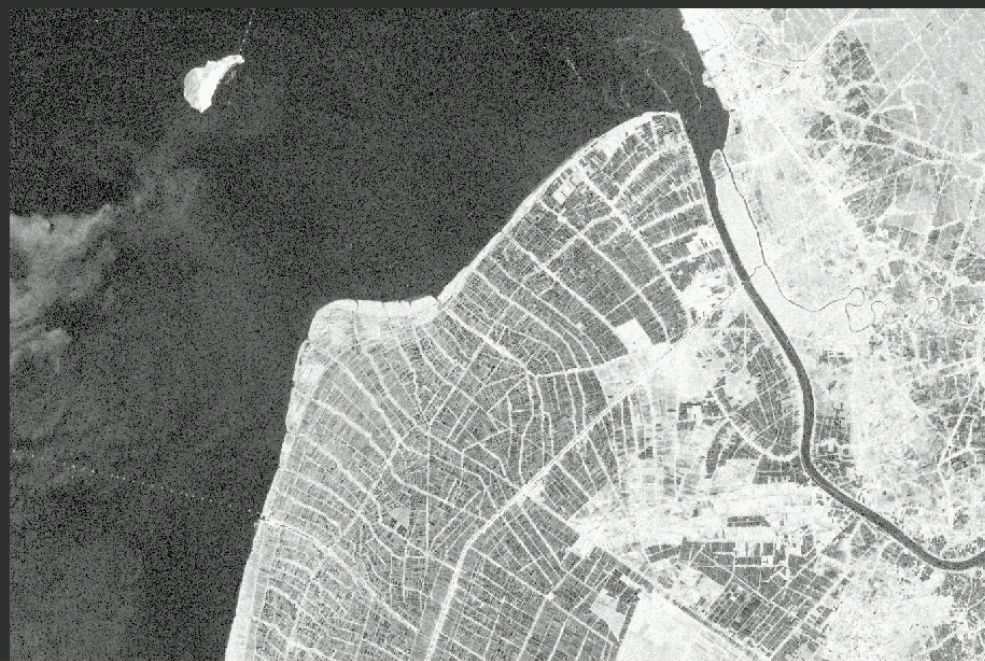
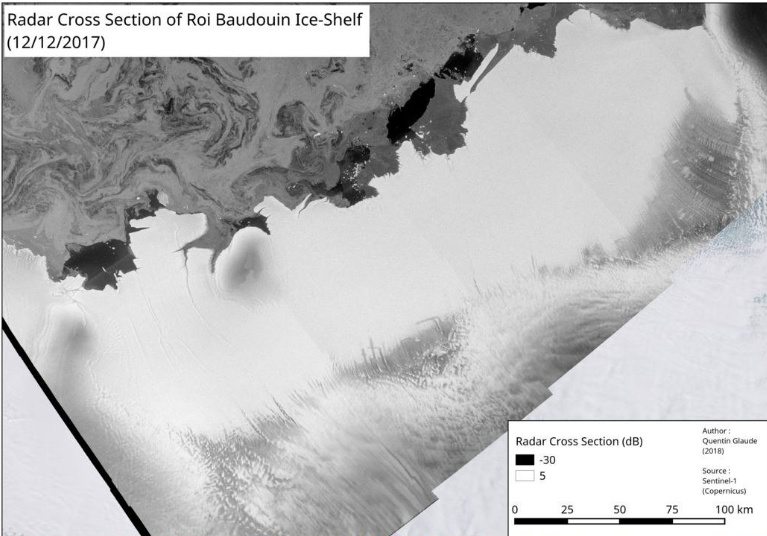
I am analazying some Sentinel-1 images over Vietnam (May 2018) and some patterns on the image have called my attention. Images have gone trhouhg calibration, spk filtering, TC and dB converrsion
Any idea what those patterns are? Atmospheric distortions? From a Sentinel-3 OLCI image from the same day (as the first image) we can see the area is covered by clouds.
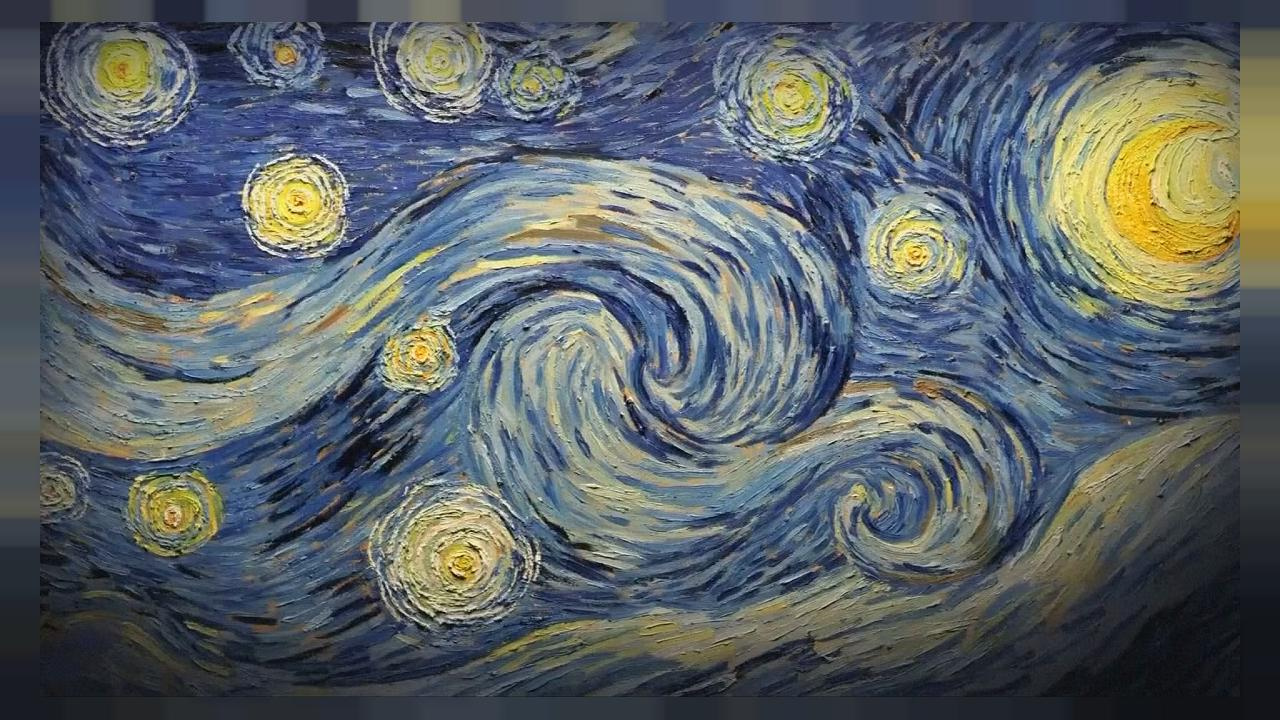
I think the Van Gogh - patterns are swirls of sea-ice/water mixture in various stages of melting/refreezing. No idea what the Vietnam-features are, clouds are not an issue at C-band except for severe thunderstorms.
I am not an expert in oceanography, but i can give you my humble opinion.
First of all, when making observations over ocean under rough weather using SAR, we see that co-polarization (HH or VV) gives us a different backscatter signature compared to cross-polarization (HV). The backscatter intensity observed in VV under a rough sea is much stronger compared to the backscatter intensity in VH. So, looking at your first two image, it looks like the sea at the time of acquisition was quite rough.
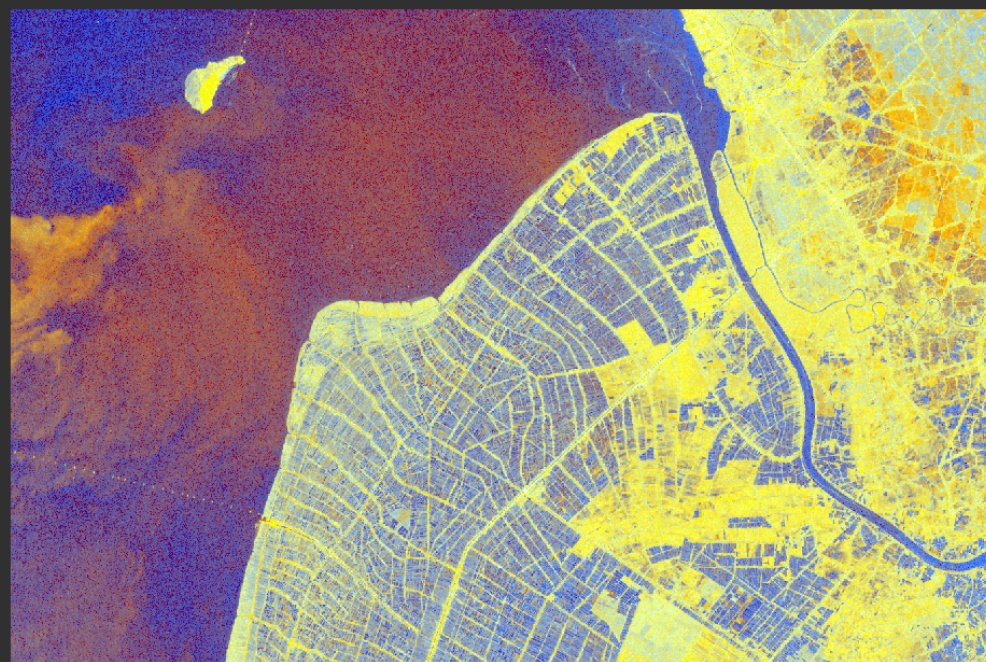
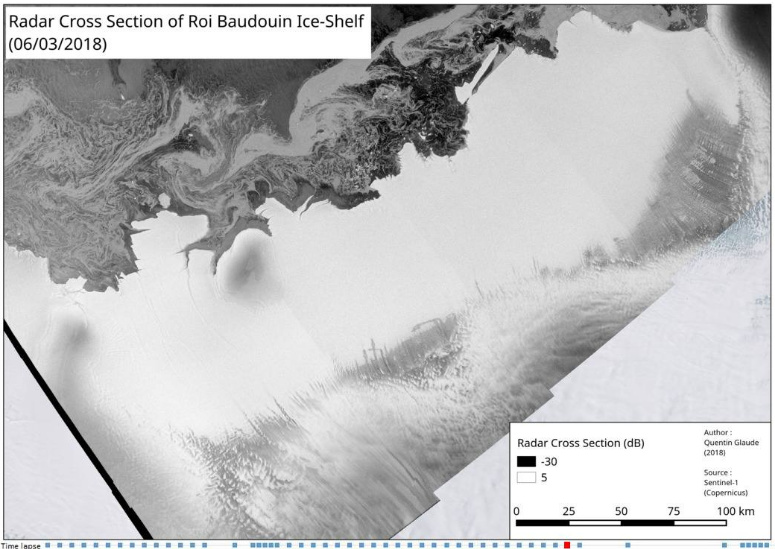
In terms of your last two images, this pattern is a bit strange, the only explanation i can give is that, this pattern emerges potentially due to the underlying topography on that area. Sometimes, the offshore bottom topography is exposed on SAR images in the presence of wind. In order to validate that, you need to have bathemetric data and see whether the pattern you see on SAR image agrees with the bathemetric data.
My guess: rain cells.
There is a similar post here:
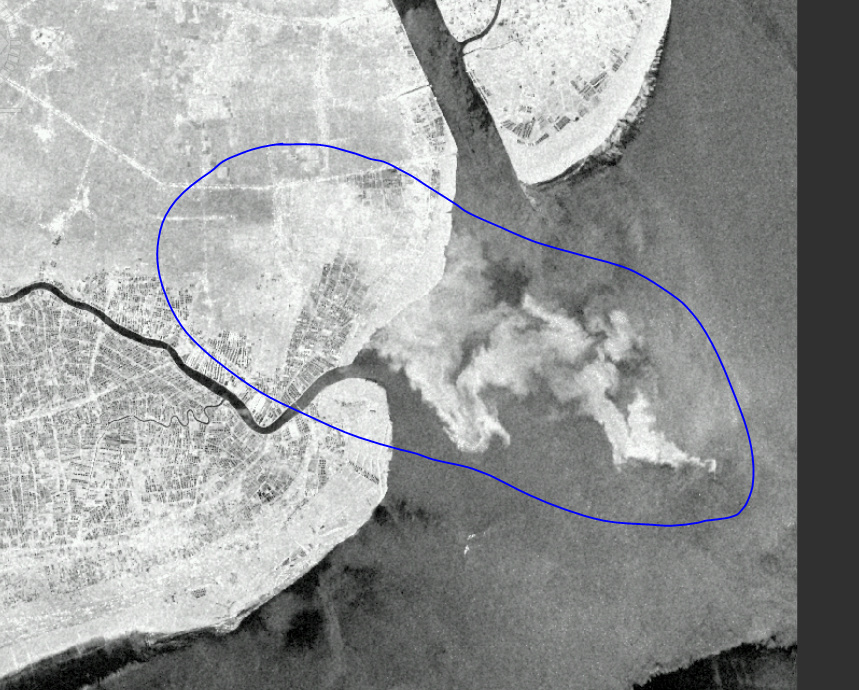
There I provide a link to a paper that explains the physics behind this phenomenon and describes the different parts of the patterns you see. The abrupt change in backscattering in the bottom left corner of your first image is a giveaway. If you zoom out, the whole pattern may look decidedly round.
The Van Gogh patterns are indeed the result of new sea ice.
Well, At first time, I thought it’ll be a heavy rain, but if you go to your ROI , it’s between to delta river, that mean, beetween two river mouth you will find very probably heavy turbulents water, with alitle higher sea level, for this reason the backscatering signail is increasing, and this area appear “white”., in case you lookfor CHLa image of this area you will find very increae level and drawing similar figure like this.
Becarefull, it’s only my personal opinion, my goal it’s oil Spill at sea.