Dear all,
I am doing interferometry with Sentinel1 (IW mode). I used two images and made coherence and interferogram.
Now, I want to plot sigma0 (dB) of image1 versus coherence two images. I do not know how can I do this by SNAP. I saw some videos about plotting in SNAP but I do not think so they can be related to ‘Sigma0 versus coherence’.
Please guide me.
I saw one example with Cosmos-skymed satellite in this paper ‘X-Band Interferometric SAR Observations of Baltic Fast Ice’ but I do not know how can I do that by snap? Should I use pin manager or something else?
I add
Correlative plot ‘Sigma0 versus coherence’ picture by Cosmos-skymed here. I want something like this.
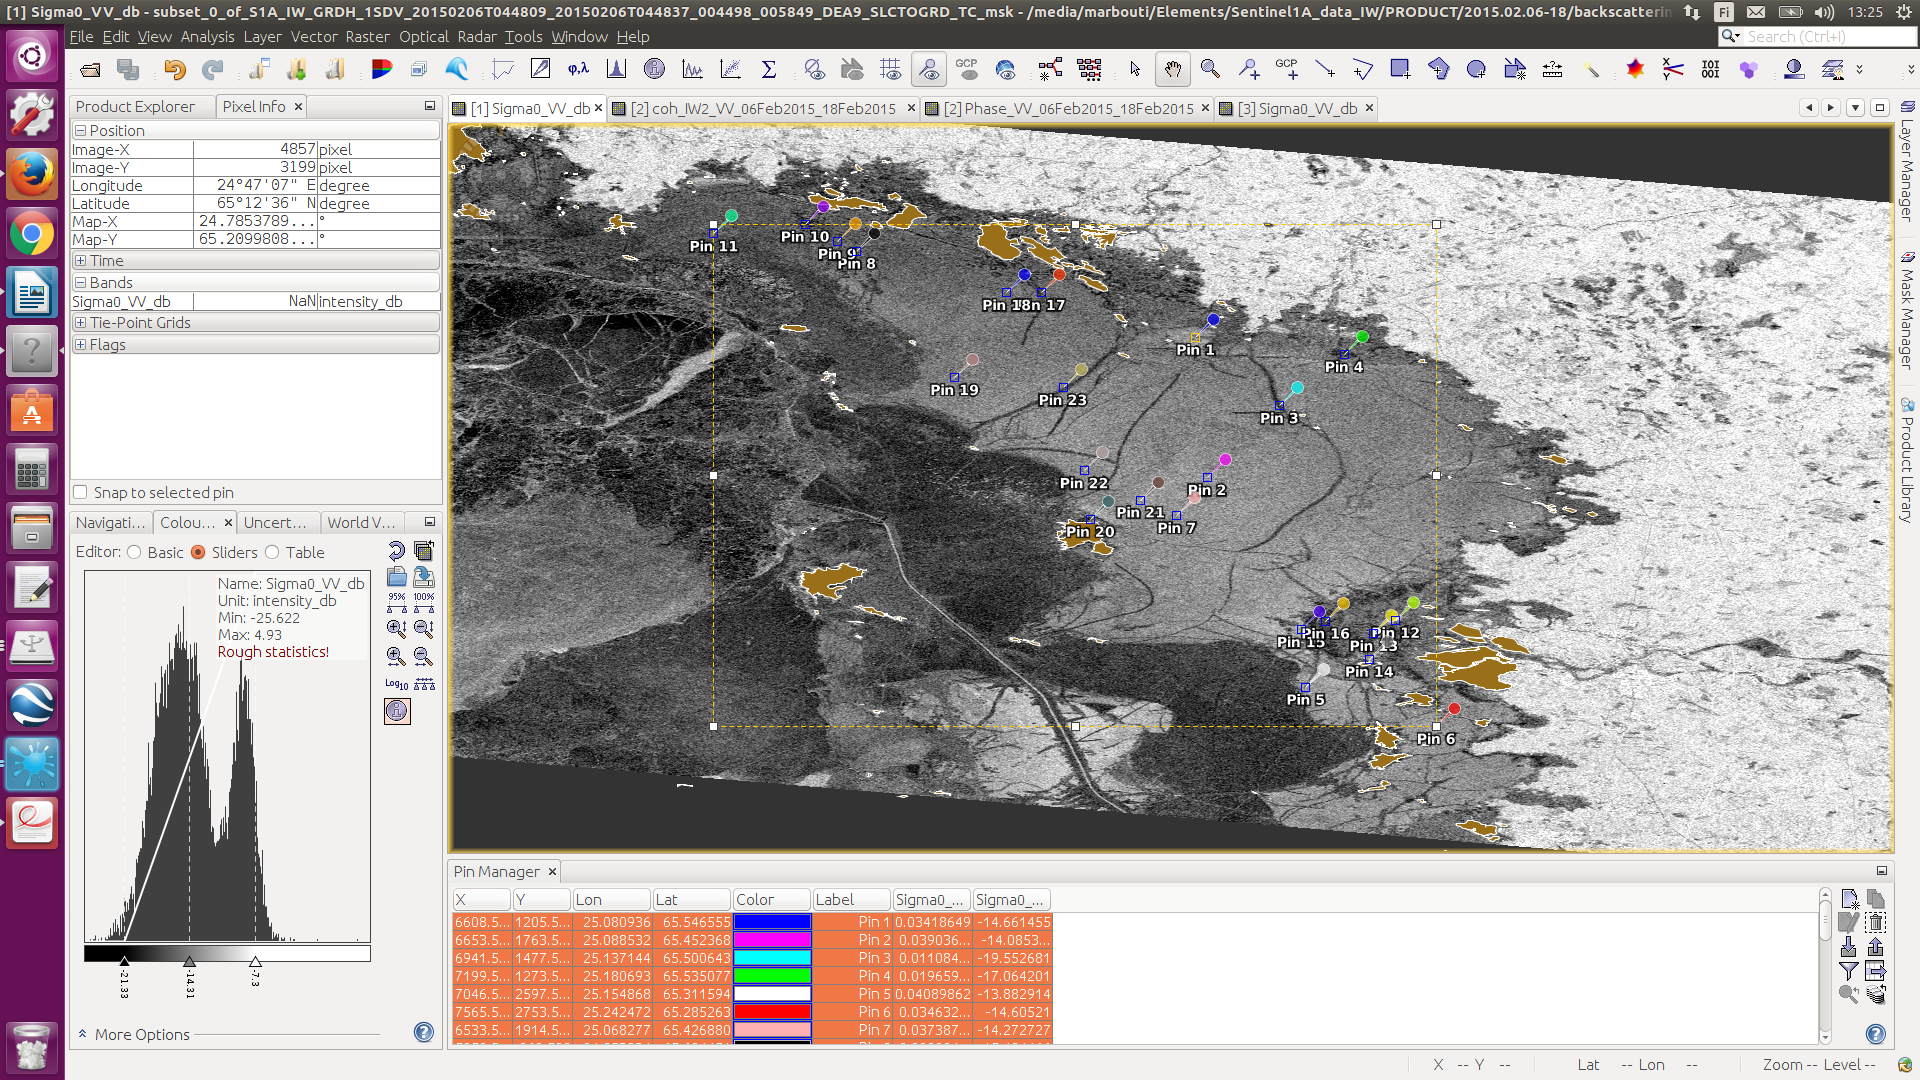
Yes. I want to choose just a few points from my sigma0 and coherence images but with same coordinates (Not whole image). It comes back to our study goal.
How we can plot only few points from sigma0 and coherence images?
I used pins for taking some points in sigma0 image, then I can export those pins to my coherence picture. It is possible?
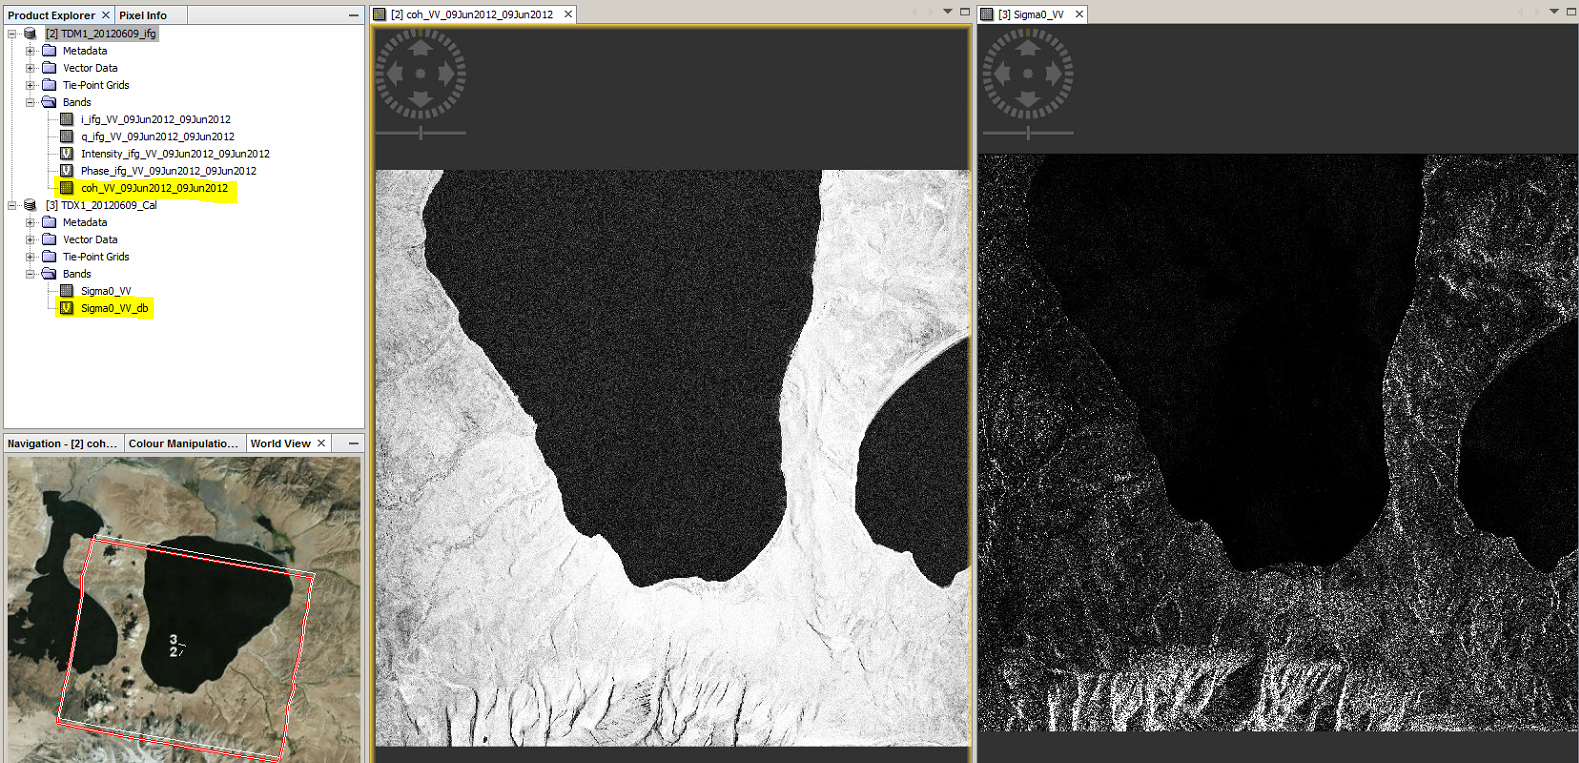
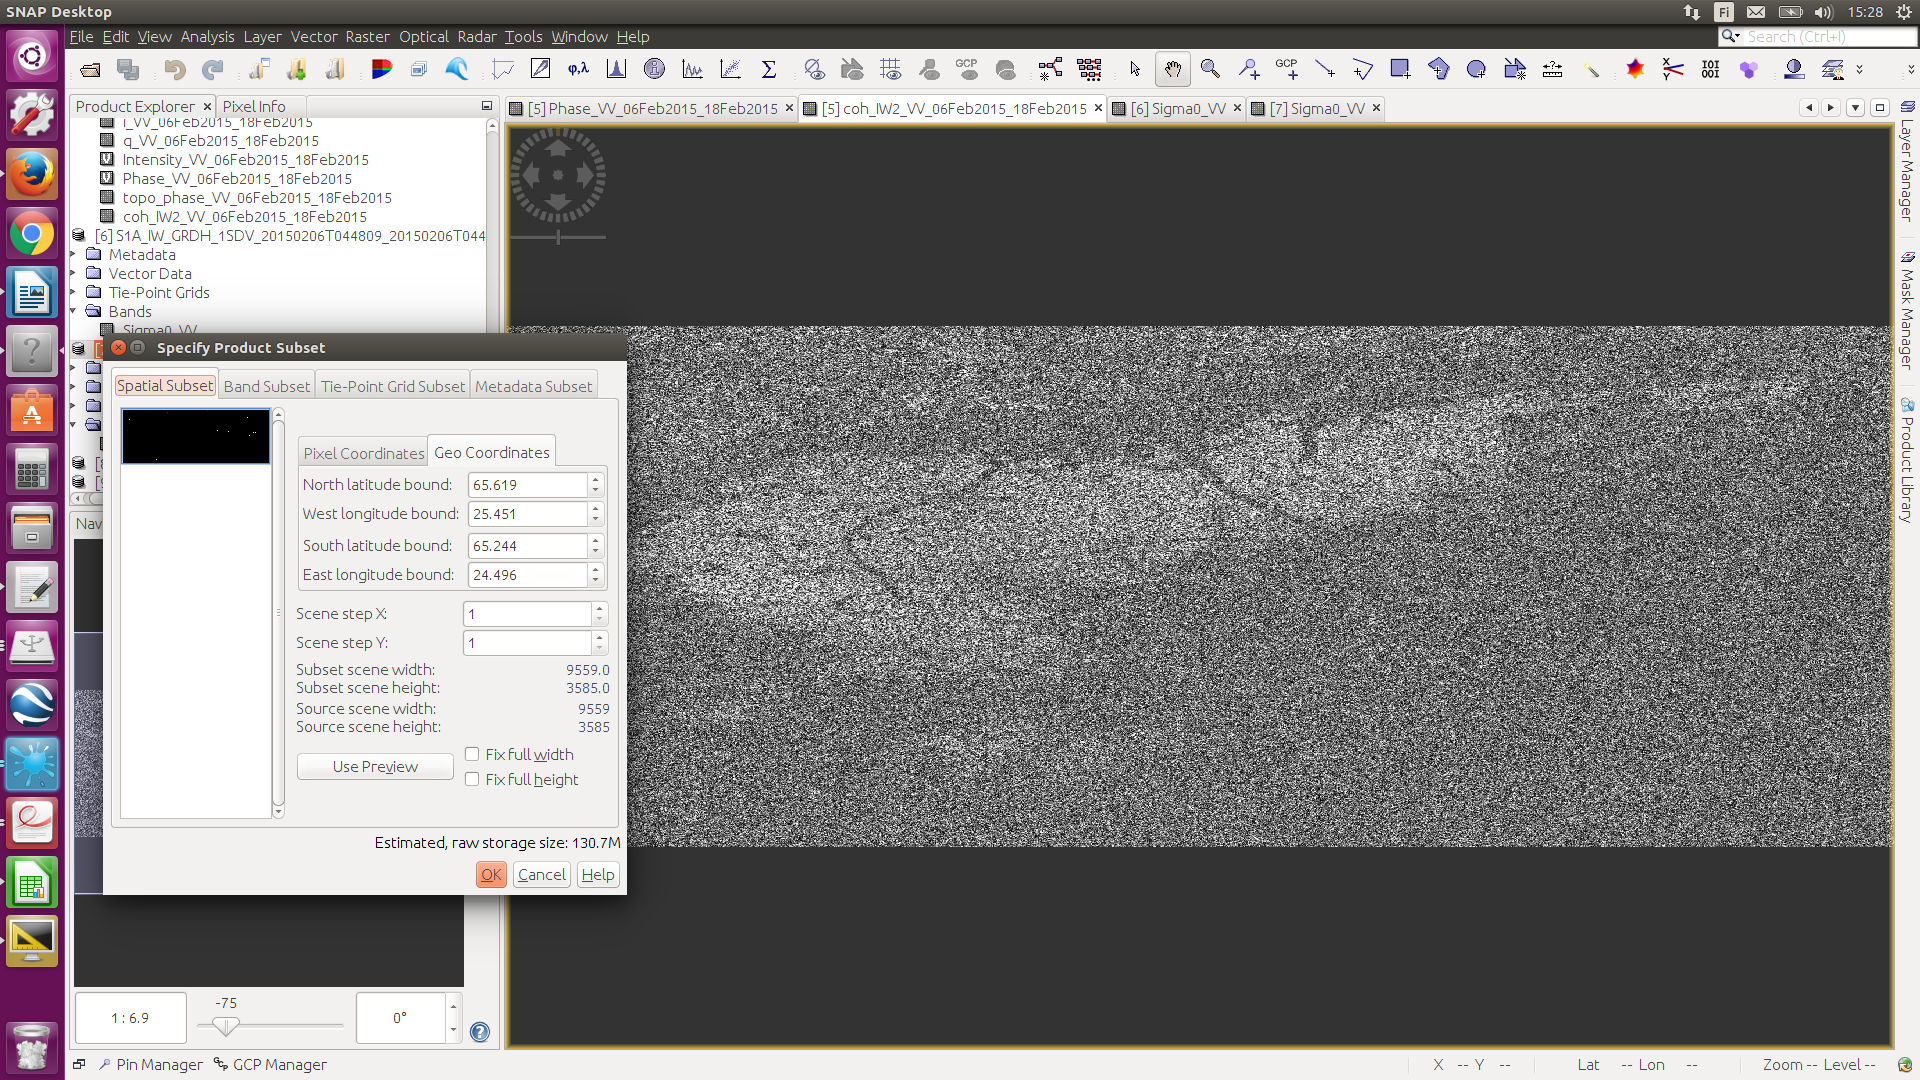
Sigma0 image:
First of all, you told me, I should Calibrate image A (or B) to retrieve Sigmao S. As my images (A and B) are in IW mode, I used SLC to GRD and then, I did like this on GRD image:
Raster……Data convertion…linear to/from Db
So I have sigma0-vv-dB
Am I right?
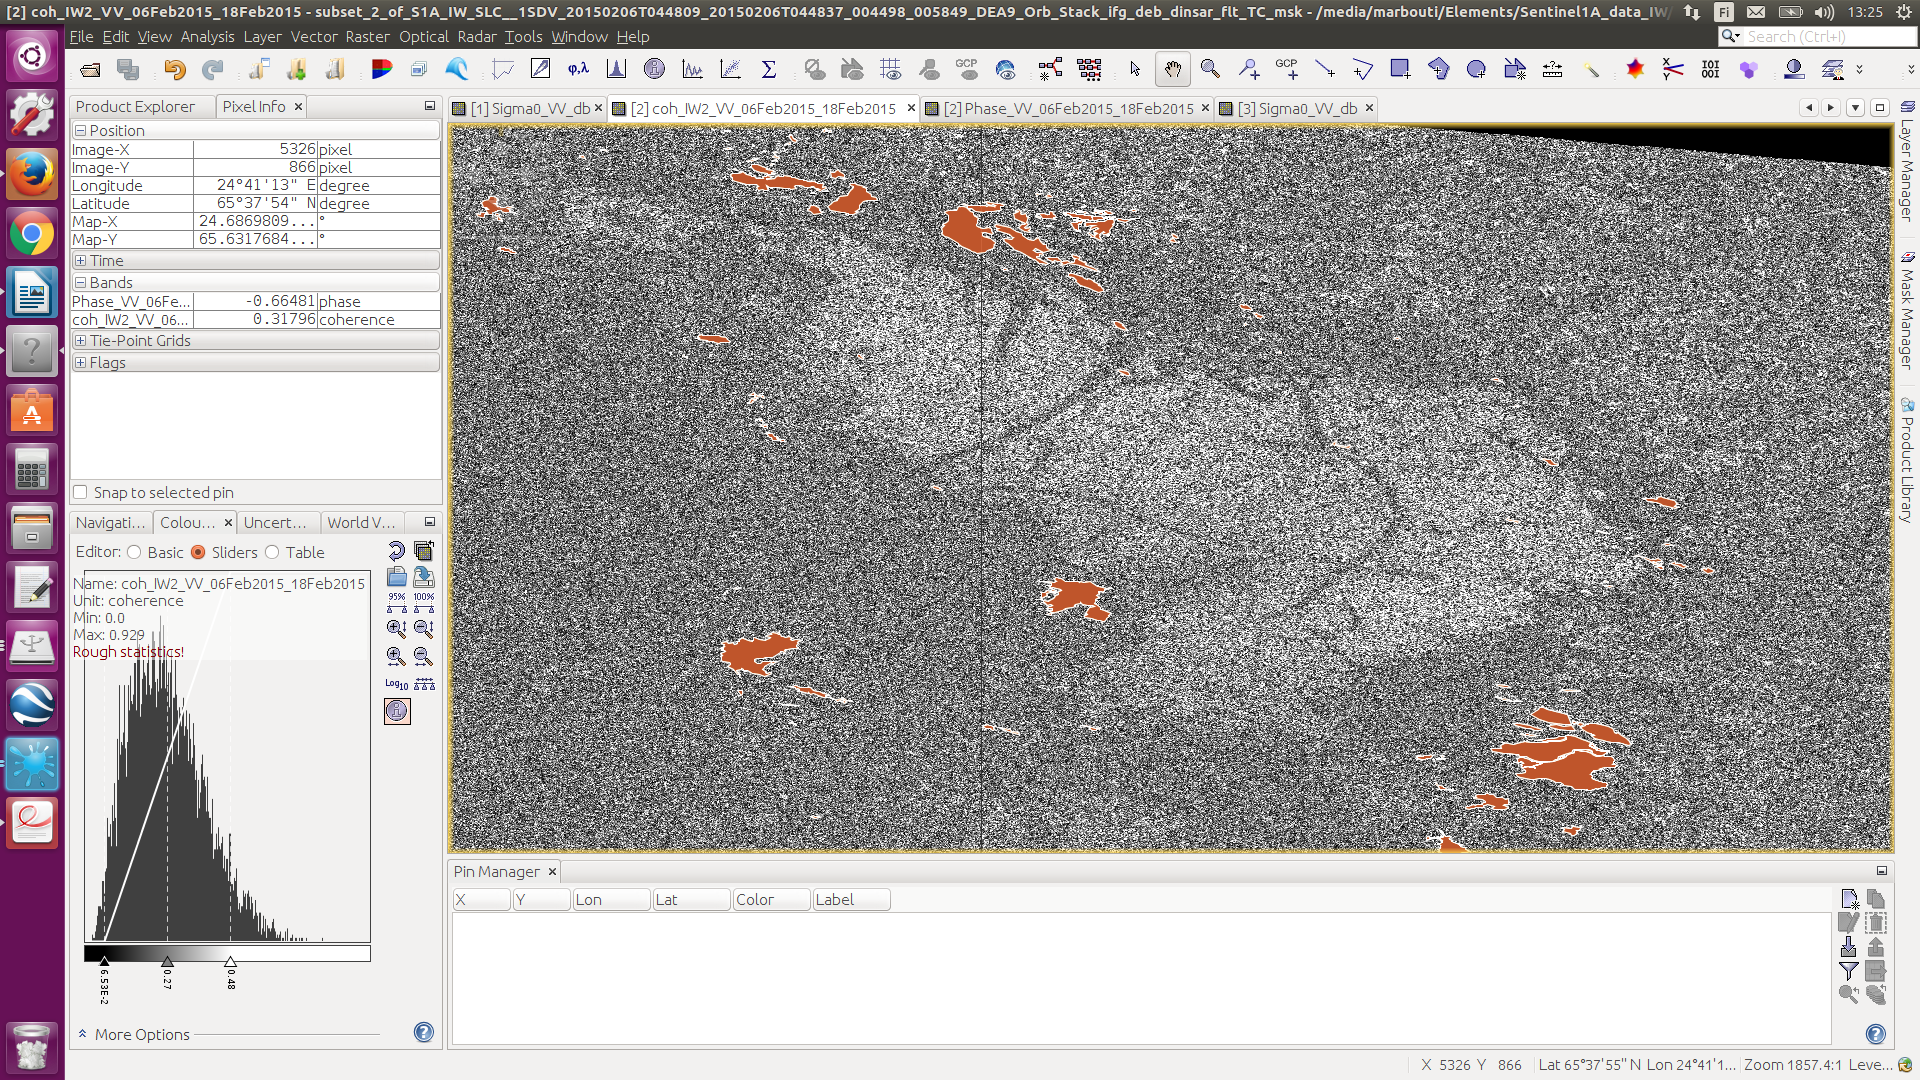
for InSAR you need SLC products, your coherence image is in slant geometry.
as you said, you calculated Sigma0db based on a GRDH product. This is already pre-processed (squared pixels) so you also need to have the Sigma0db layer in slant geometry. Use the original SLC data to calculate Sigma0.
Please also see here:
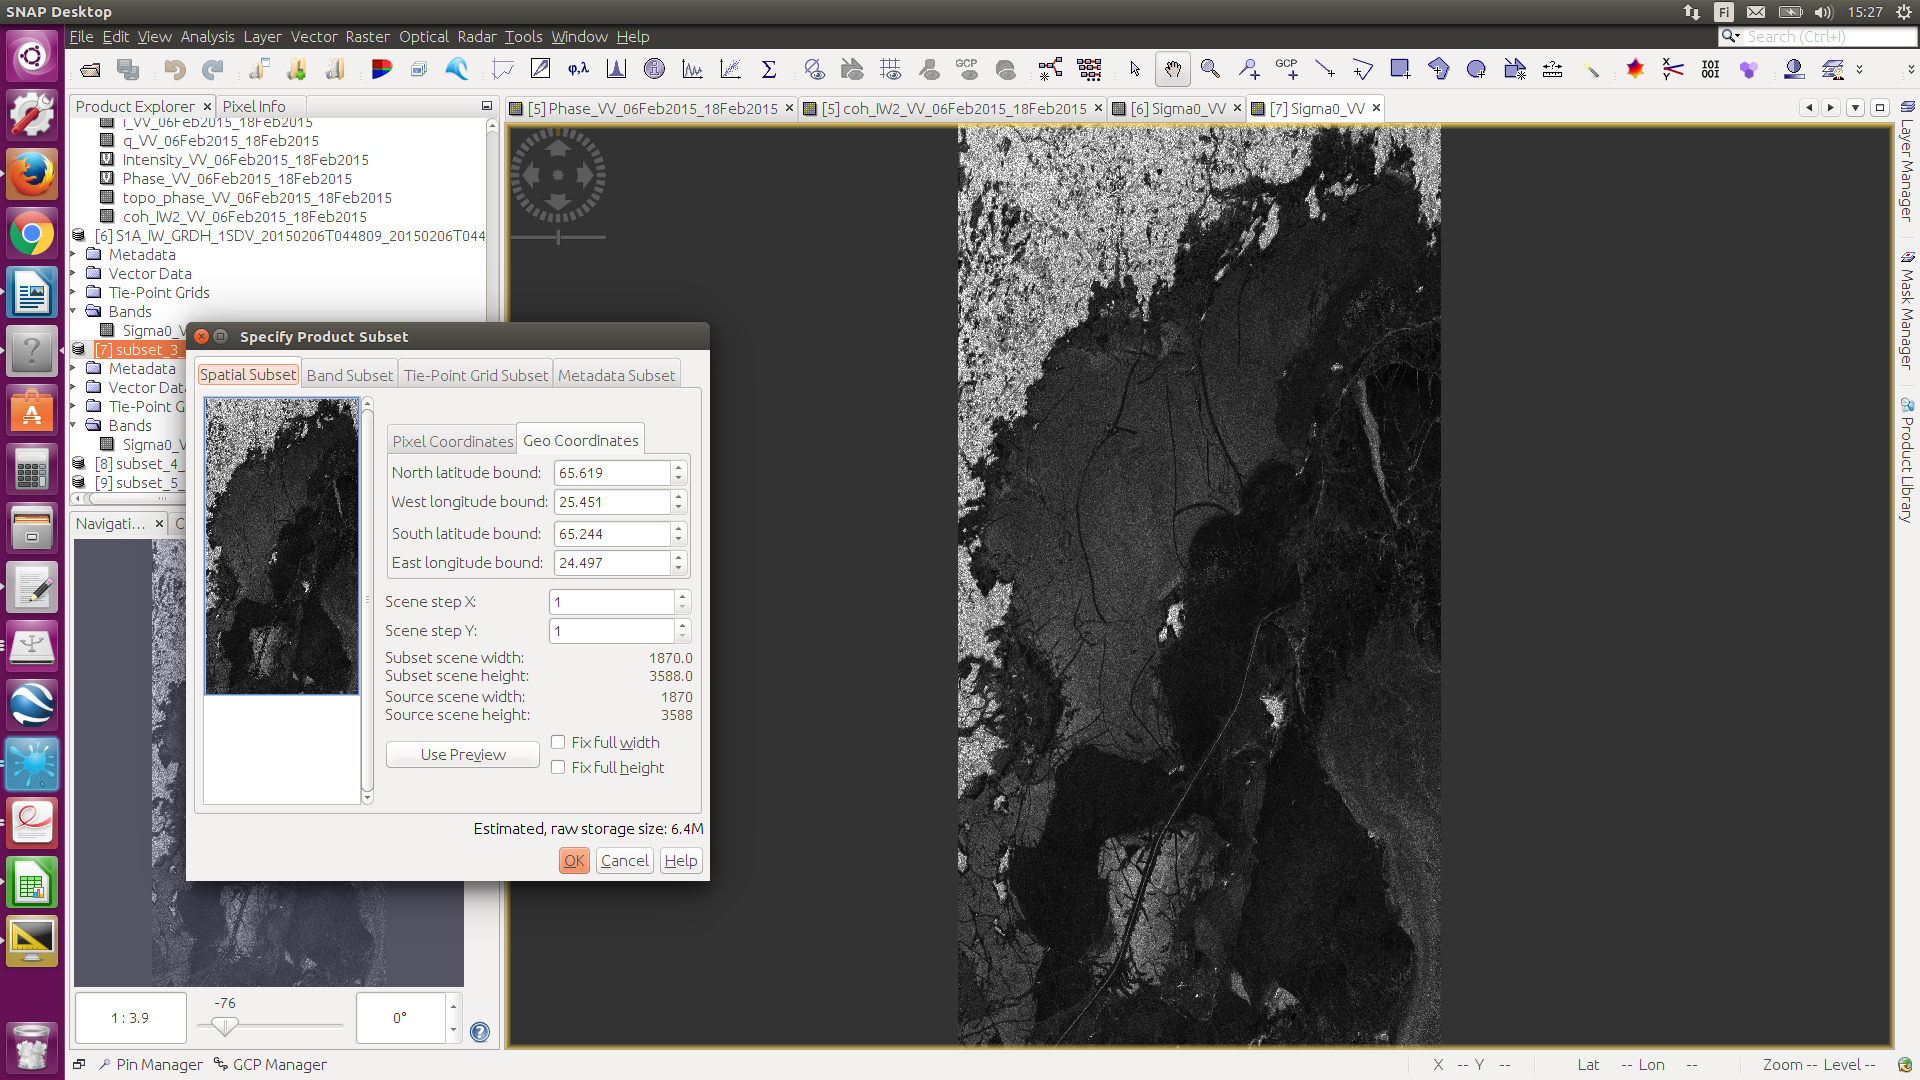
You could, as well, geocode both rasters to ground range and then clip to the same extent but this is also tricky.