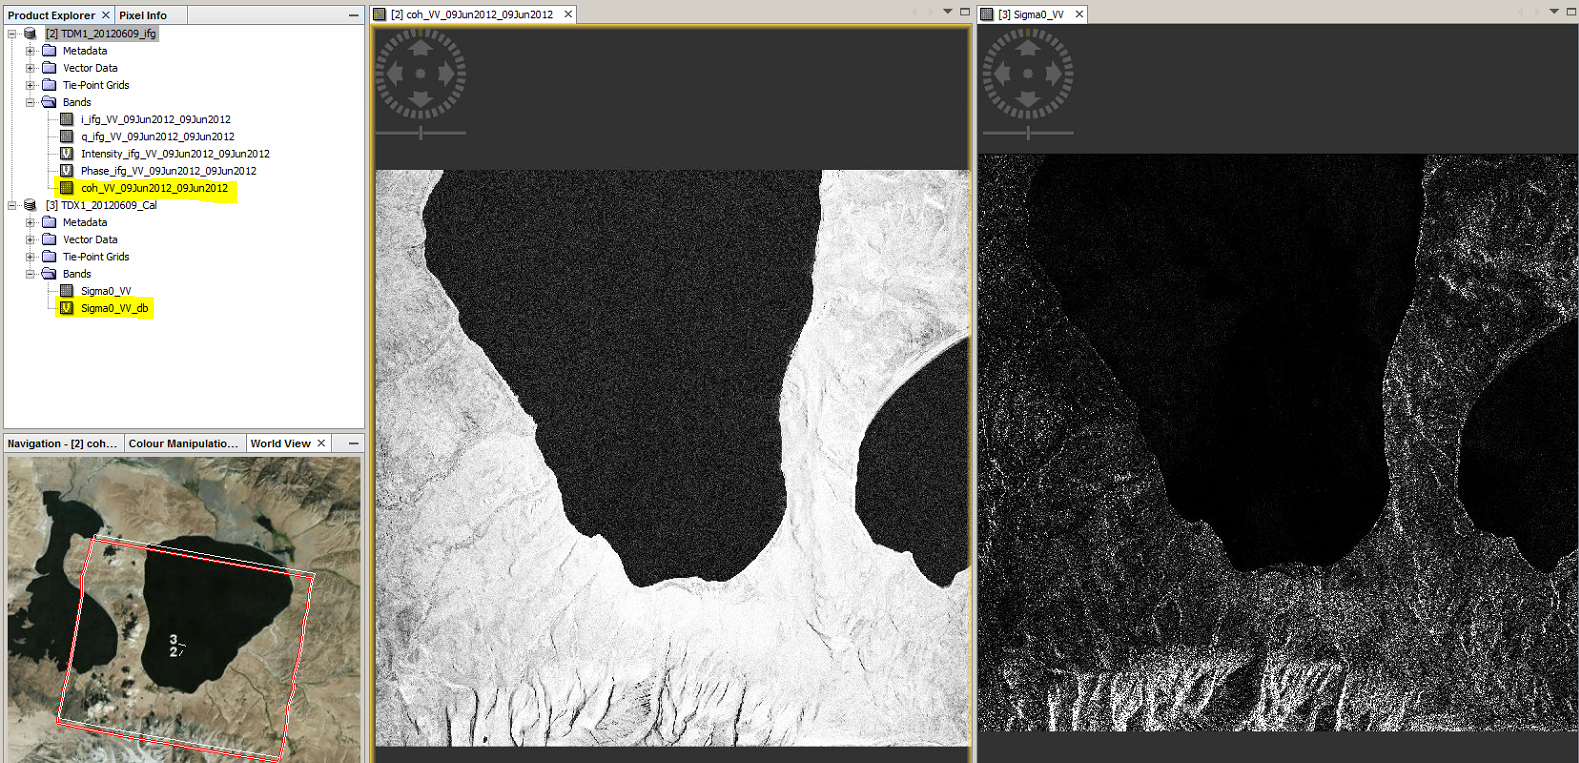
You need to generate two things out of your products (image A and B ):
- The stack which is needed to calculate your interferogram and the coherence C
- Calibrate image A (or B) to retrieve Sigmao S
Use the scatter plot ![]() to draw the values of C against S:
to draw the values of C against S:

Note that this is only possible if both rasters have the same extent:
I don’t know why it was done for only few points in your example and also where the ranges at those points come from.