Got it @ABraun Thank you.
Hi, @ABraun. If I run step 8, only changing the 2 scn parameters, then how can I plot the displacement (mm/y) inclusive of this step? Always with ps_plot(‘v-do’)? Because when I do the ps_plot(‘v-do’), before and after the step 8, the results seem identical.
Thanks in advance.
first you change the parameter, then you repeat the step which includes it.
How many images do you use and what are your scn parameters?
@ABraun For the moment I’m considering 30 images Sentinel-1A (about one year in total) of Central Italy.
I have set scn_wavelenght to 50 and scn_time_win to 50. But also if I change the scn_time_win to 365 as default for example, no changed in plot of mm/y. Also changing the scn_wavelenght to 100 or other value. So I don’t know if the step 8 is working or not.
maybe there are no outliers removed by the filtering because there are none in the data? If your time-series already followed a quite linear trend, the filter size would not make a large difference at all.
1 Like
Hello,
Is this possible to geoeref this figure with some matlab code directly?? or any other method to open this graph on google earth? i have tried the kmz output but thats so heavy to work with my system
Thankyou
You can reduce the point density of the kmz output by increasing the number in the command:
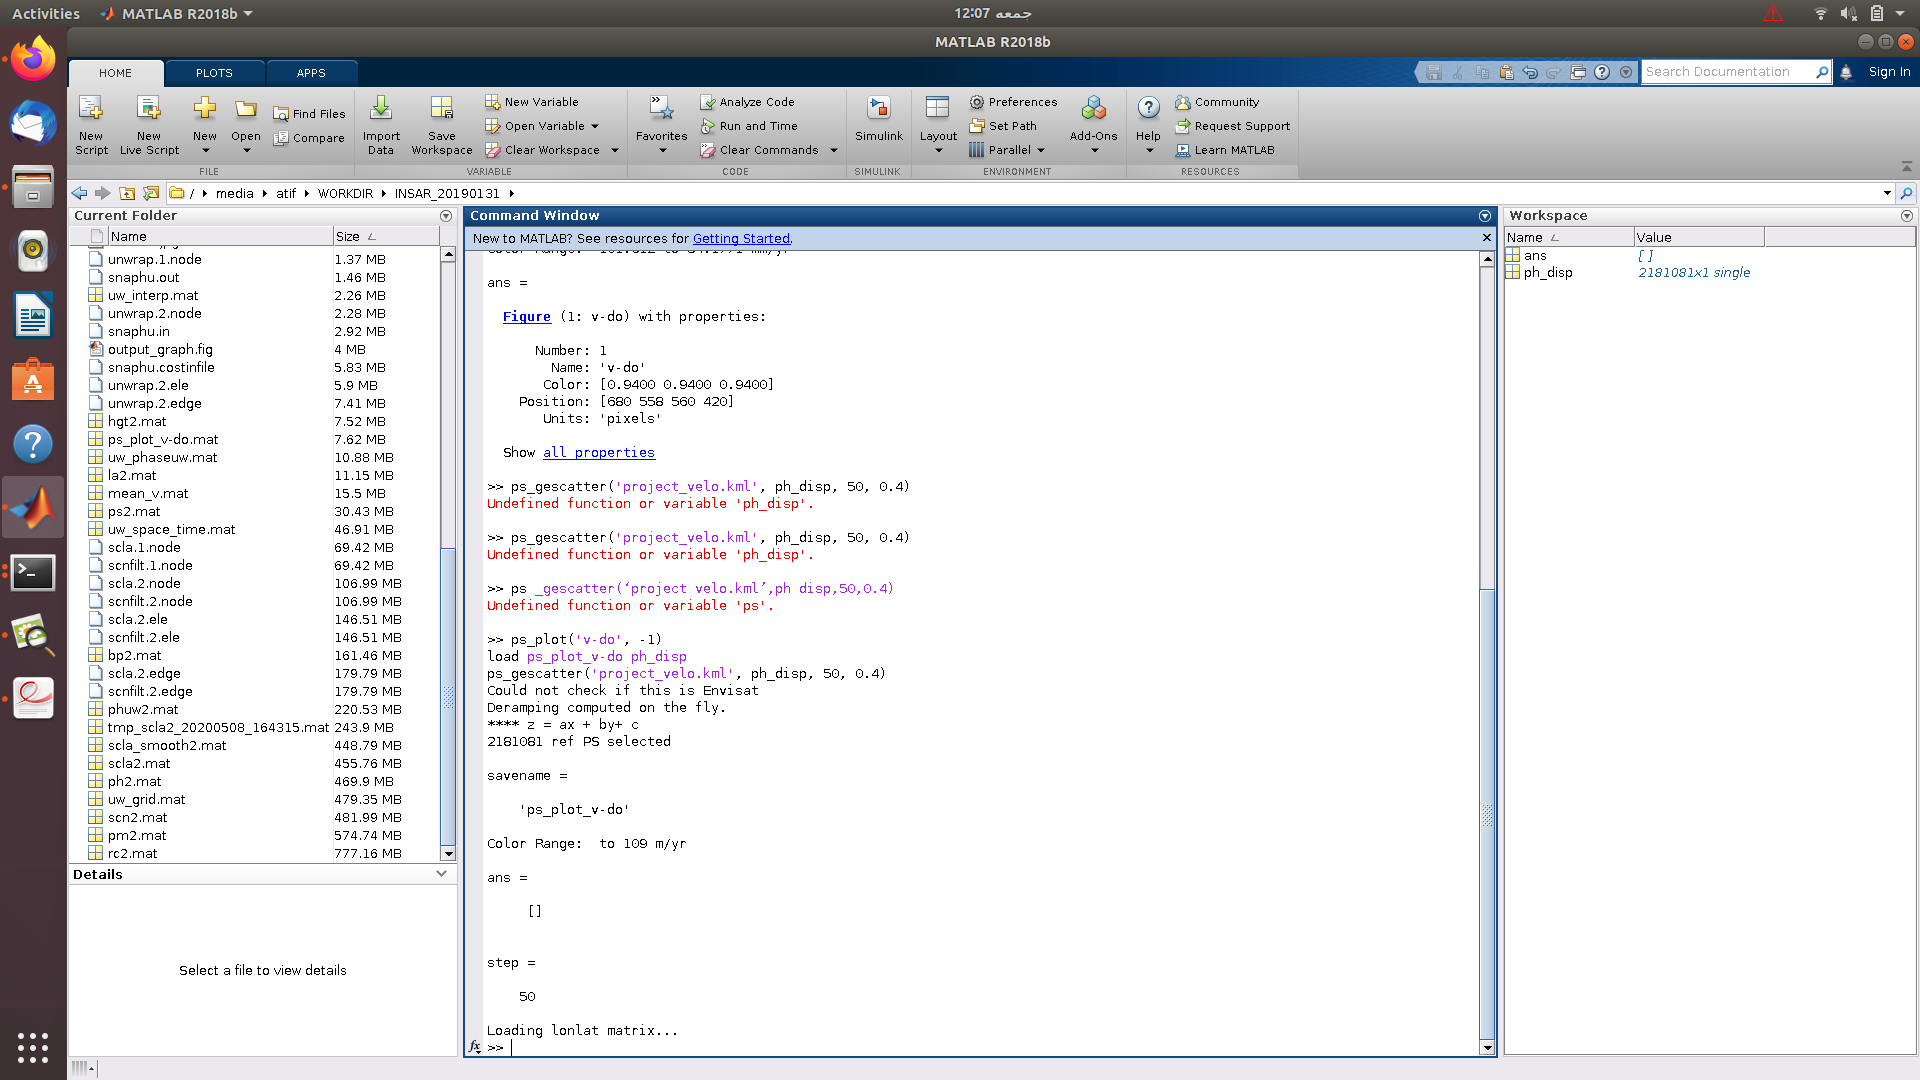
ps_gescatter('project_velo.kml', ph_disp, 50, 0.4)
1 Like
Okay. i have once completed the processing now i want to make kmz as you suggested so what function should i call in terminal? because its not mt_prep_snap now right? how to start work again to make new kmz?
these are matlab commands, so you enter them in your matlab environment, please see here: Problem in runing mt_prep_gamma_snap
1 Like
Got it… Thank you
if you see these two >> the command is finished. You don’t get any console output, but the kml file is written into the working directory. Search for project_velo.kml
1 Like
It was some error… i got the file… thankyou…
can we change the colour scheme of kml by editing the code?? i am a little confuse between the ps_plot(‘v-do’) output and kml output on the google earth… i want same colour scheme for kml and ps_plot(‘v-do’) so that i could read the subsidence on google earth easily…
Thank you…
once it is a kml you can import it into ArcMap and extract the mean displacement value from the attribute table and then style the file as you want.
I sometimes convert it to a CSV first and do the rest in QGIS, please see here: StaMPS-Visualizer, SNAP-StaMPS Workflow
1 Like
Convert the kml to a shapefile. Is this matlab code to convert?
ogr2ogr velocity_clip_large.shp .\export_velocity.kml
and should i need to install stamps-visualizer to convert data into csv file?
and sorry can you elaborate this ? is this to apply in qgis?
Extract the velocity from the attribute table (QGIS statement)
to_real( replace(substr(descriptio, strpos( descriptio,'Value: ')+7,4),'<',''))
Thank you.
no, this was just discussed in the topic of the StaMPS Visualizer, but the export is not related to it, so you don’t need to install it.
ogr2ogr is part of the gdal libraries which are installed with QGIS, for example. You can run it with the shell or probably also convert the kml to shp within QGIS or ArcMap.
The second statement is the expression to use in the attribute field calculator in QGIS to extract the displacement value from the string of the kml attribute.
1 Like
@ABraun Hello, when I ran stamps(7,7), I encountered the following error.
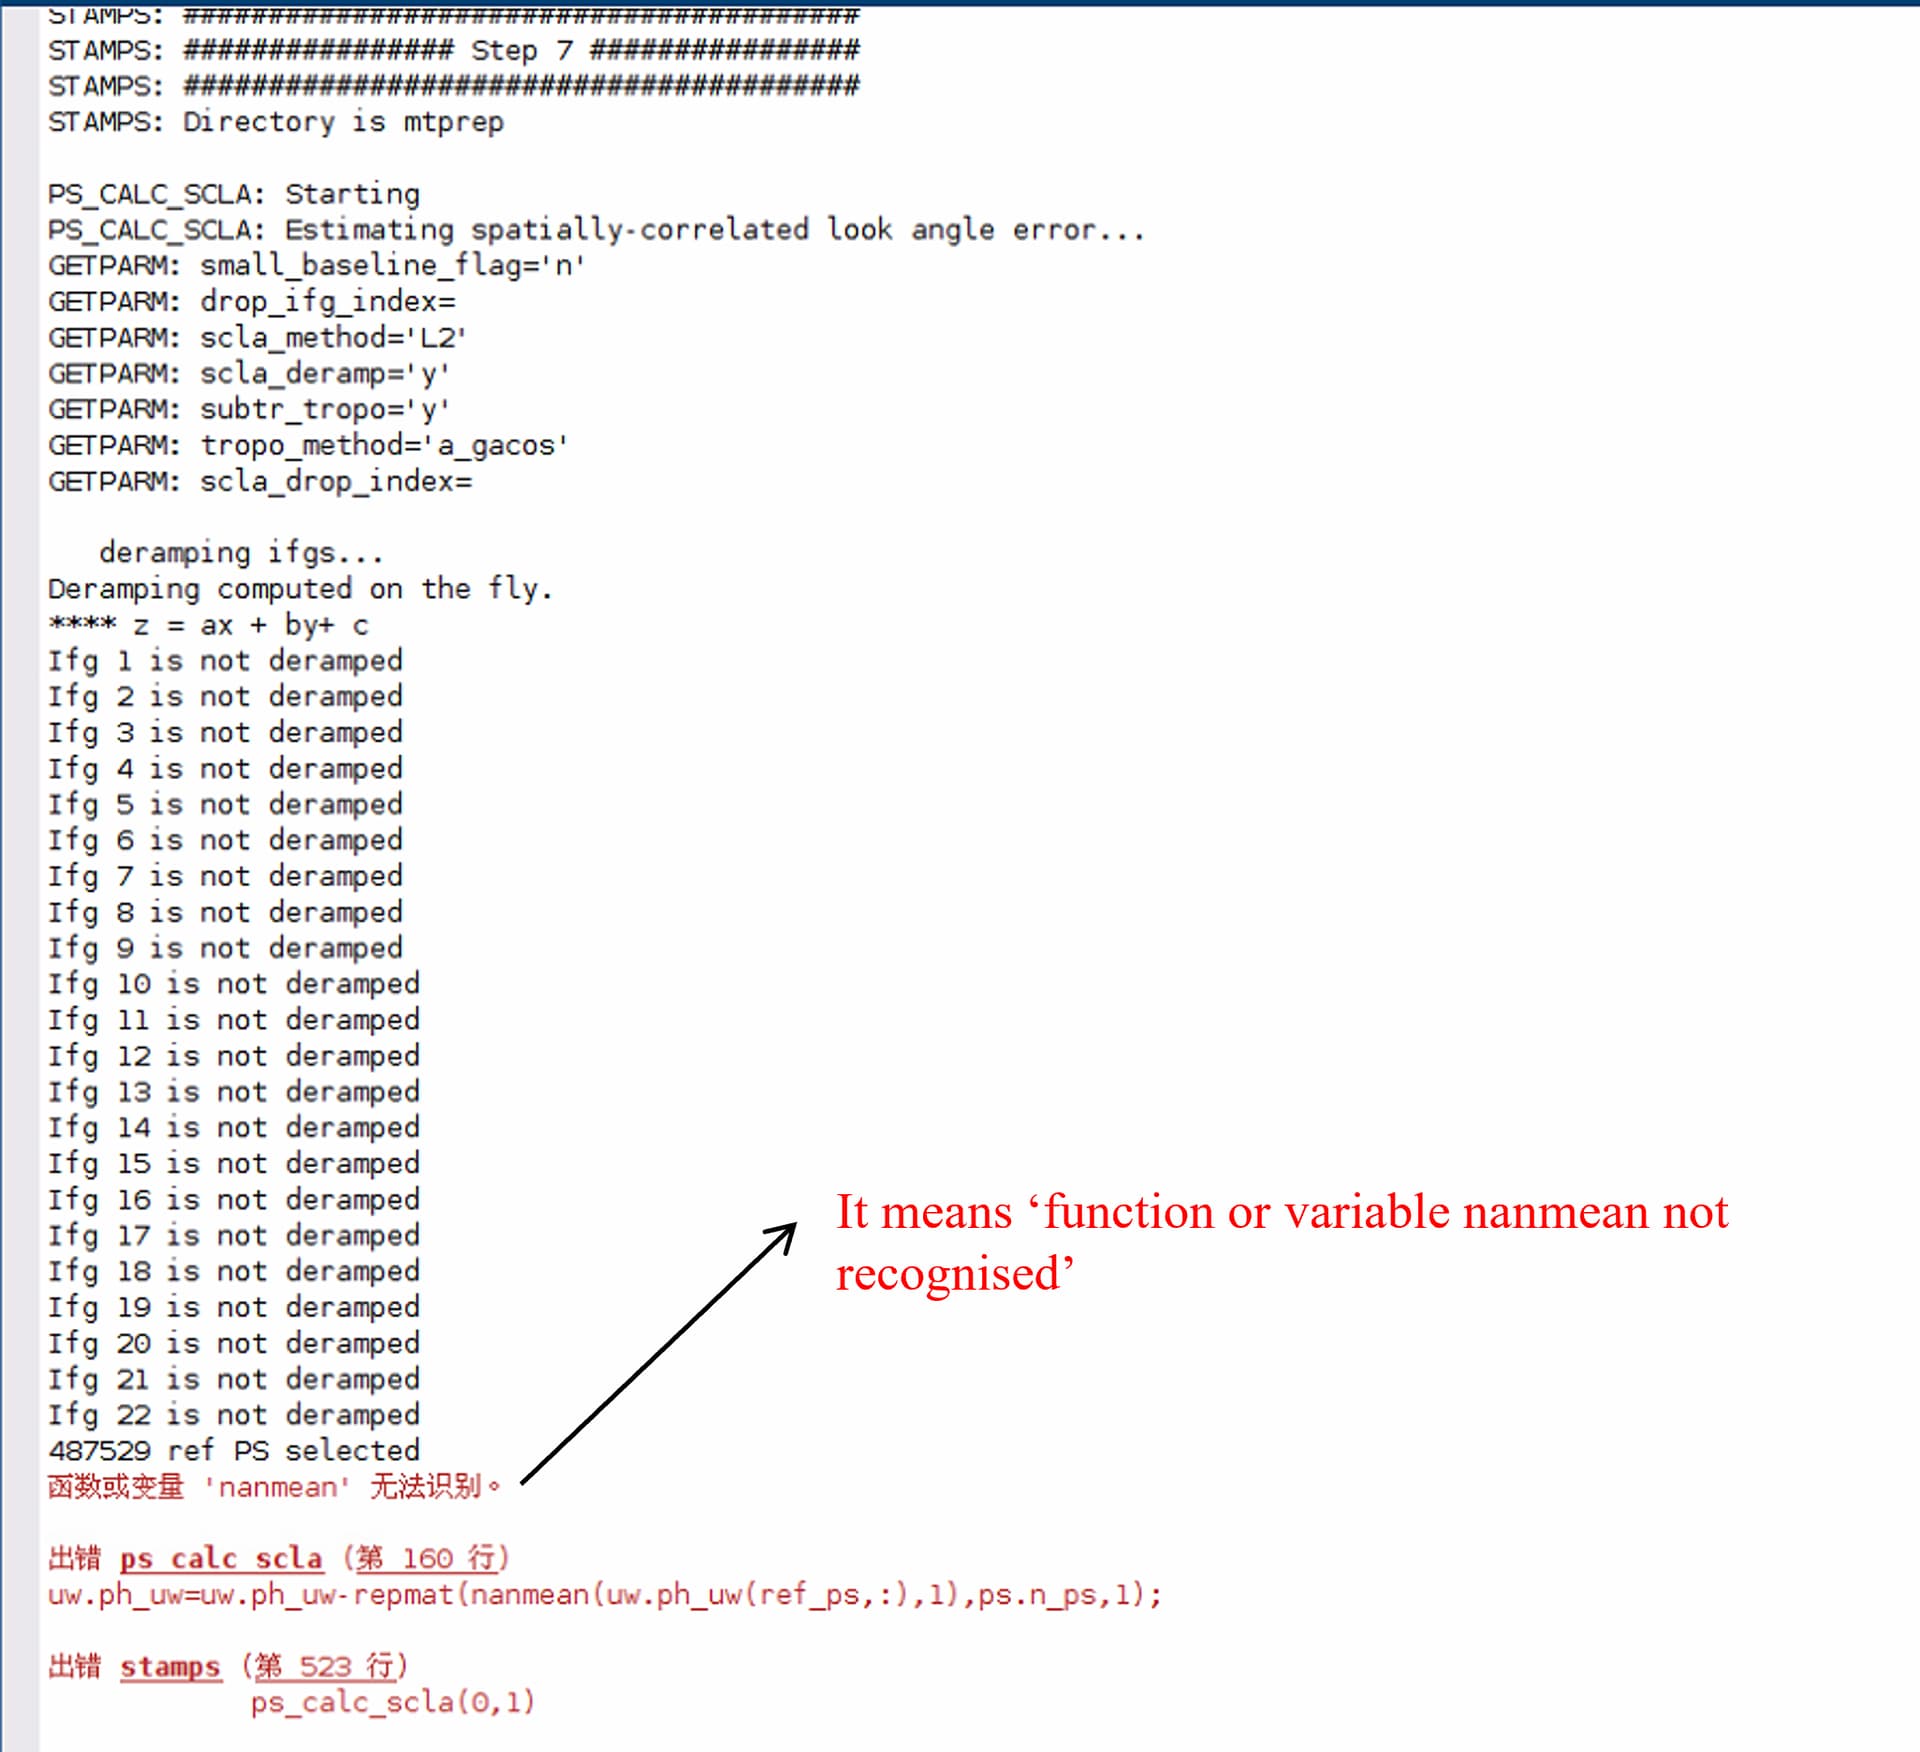
What can I do to solve this problem? Thank you very much!