Ok, I am going to check the results, I hope this works.
Edit:
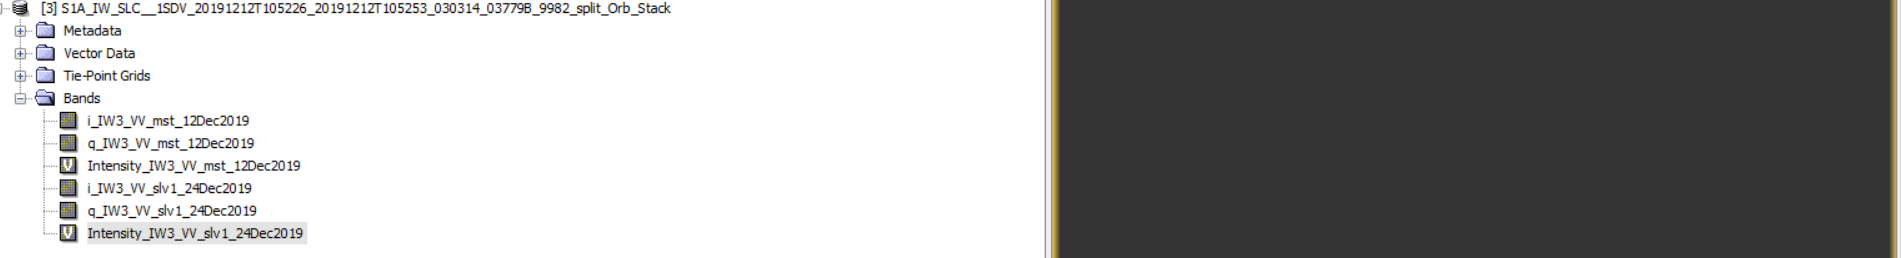
This is the file:
![]()
When I use external DEM this appears

And the process stops.
Ok, I am going to check the results, I hope this works.
Edit:
This is the file:
![]()
When I use external DEM this appears
I used this another file:
The loading process worked. I am going to check if slave image data appears.
The rseult is the same, slave image didnt appear
Can I ask you a favor, I dont know if it is possible but I would like that you can make the same process with same pair to know if the problem is my computer, the images or the software.
In the case if you can do that these are the images:
S1A_IW_SLC__1SDV_20191212T105226_20191212T105253_030314_03779B_9982.zip
S1A_IW_SLC__1SDV_20191224T105225_20191224T105252_030489_037DA8_6D12.zip
For both images I made top-split: The split is IW3 Burst 4.
Are in south of Colombia and North of Ecuador.
Thank you.
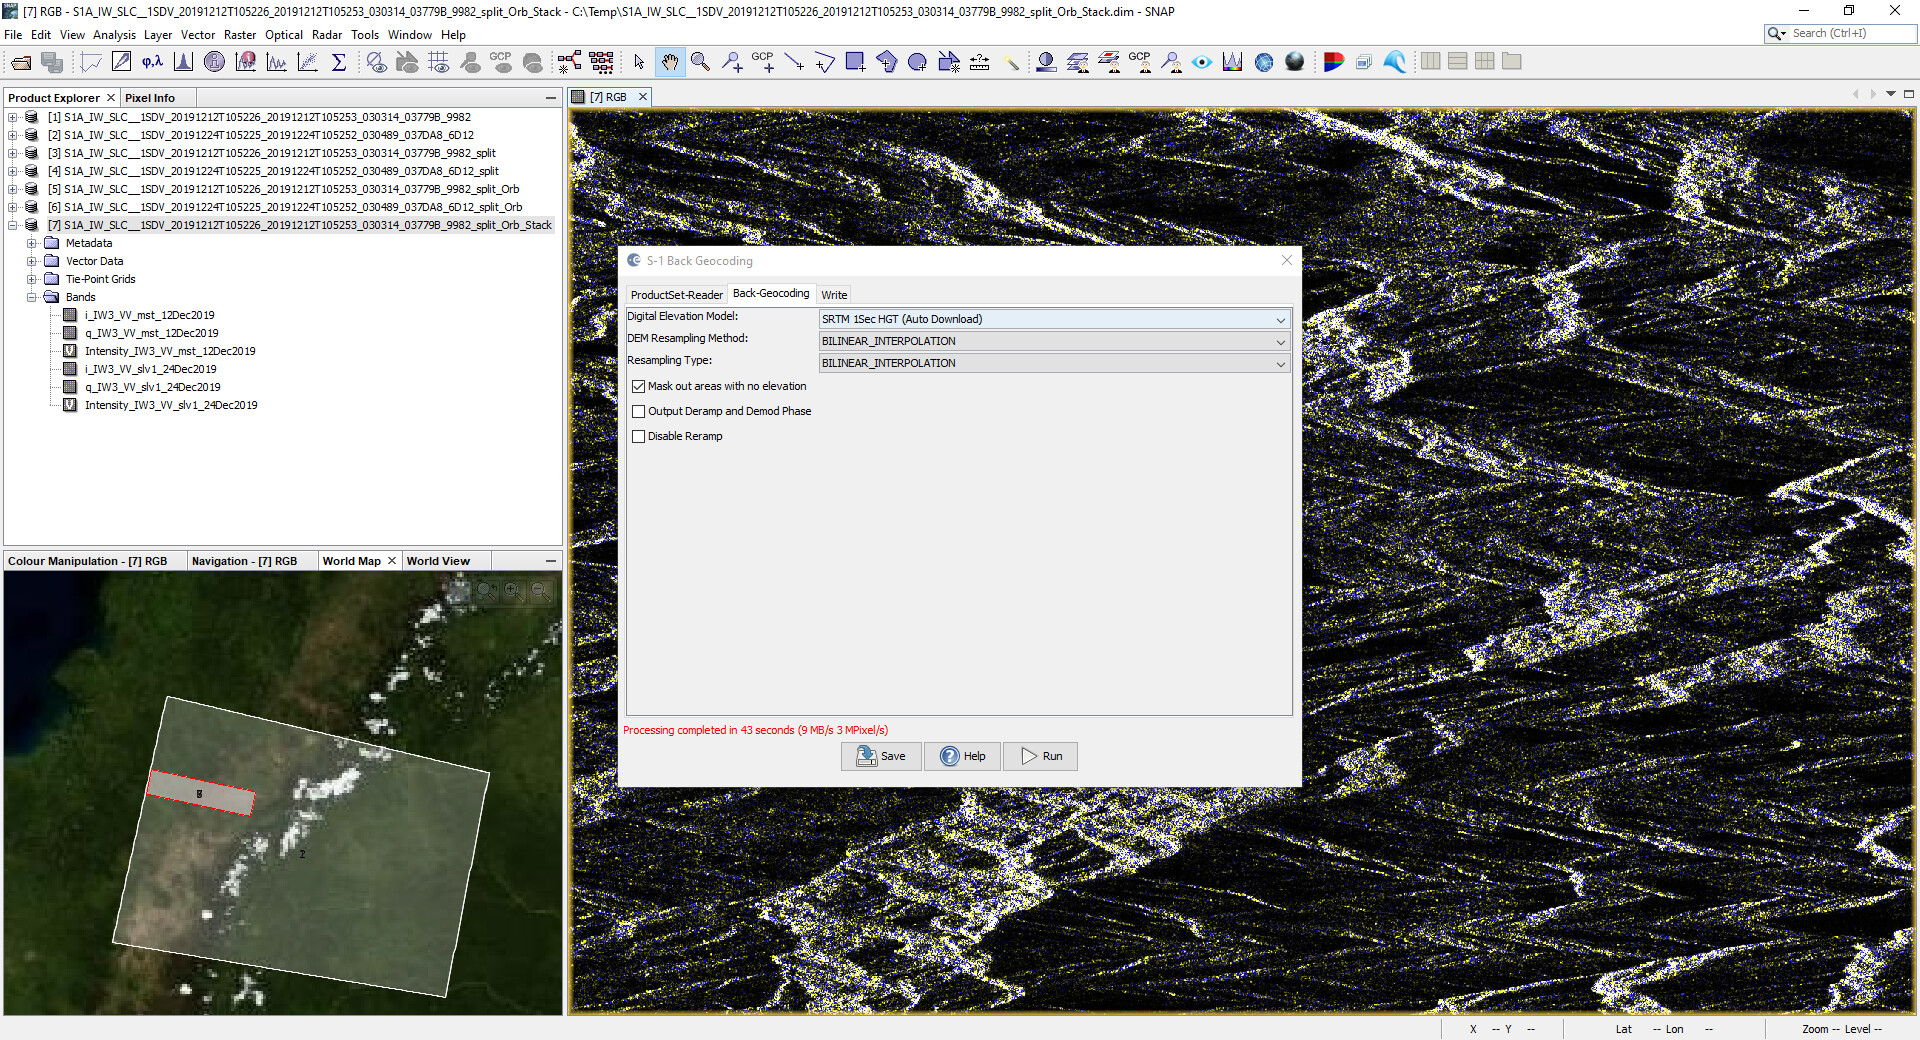
I tetsted with your data. I applied TOPS Split (IW3, Burst 4), applied the orbit files, then BackGeocoding using SRTM 1Sec HGT (AutoDownload). I created an RGB image with the first (red and green) and second image (blue) and everything works fine.
I’m starting to believe that the DEM is not the problem in your case. Are you using the latest version of SNAP?
Thanks to show your results.
I am going to tell what I did after step by step.
1- I have the latest version of SNAP, version 8.0
2- I used another computer, and the problem persited in that computer.
3- I wanted to know if the problem were the software or the images, so I made a corregistration of other images of a different place (center of Colombia) and the Back Geocoding with SRTM 3Sec loaded very good (in the case of the images of the south of Colombia that I have showed you, the loading screen blocks), and the data of those other images appeared. But, I wanted to try with SRTM 1Sec for those images, the loading screen worked, but the slave image data didn’t appear, like in the case of the images of south of Colombia.
So these are my conclusions:
SRTM 3Sec worked for images of center of Colombia, and show all the data, master and slave image.
SRTM 3Sec dind’t load for images of south of Colombia, the problem is that I need those images for my study.
SRTM 1Sec loading screen works for images of south and center of Colombia, but the slave image data doesn’t appear for both cases.
So, the problem is related to the images of south of Colombia, but it worked for you, so I don’t know what could be the problem, I have tried everything, changing dem, changing computers, changing images, so I don’t know what to do.
sorry to hear that. As long as I cannot reproduce the error it is hard to think of further solutions.
I understand.
I have a question:
Does exist the posibility that we can meet in Google Meeting with my university mail to show you step by step what I have done, and you can see a better way my problem? Obviously if you can and you would decide when.
Thank you.
sorry, this goes beyond my mandate in this forum. If I offered this to you, other would expect it as well.
Maybe you have a colleague or a supervisor who can discuss this with you?
In this moment don’t, do you know someone who you can recommend me?
Thank you.
not really, because this procedure is not so complex and actually should work.
What happens when you select GETASSE30 (AutoDownload) in the BackGeocoding?
I am going to show everything that I have done today:
For Images
S1A_IW_SLC__1SDV_20191212T105226_20191212T105253_030314_03779B_9982.zip
S1A_IW_SLC__1SDV_20191224T105225_20191224T105252_030489_037DA8_6D12.zip
which are that I have showed you in these days, GETASSE30 (AutoDownload) didn’t work, because slave image doesn’t show data.
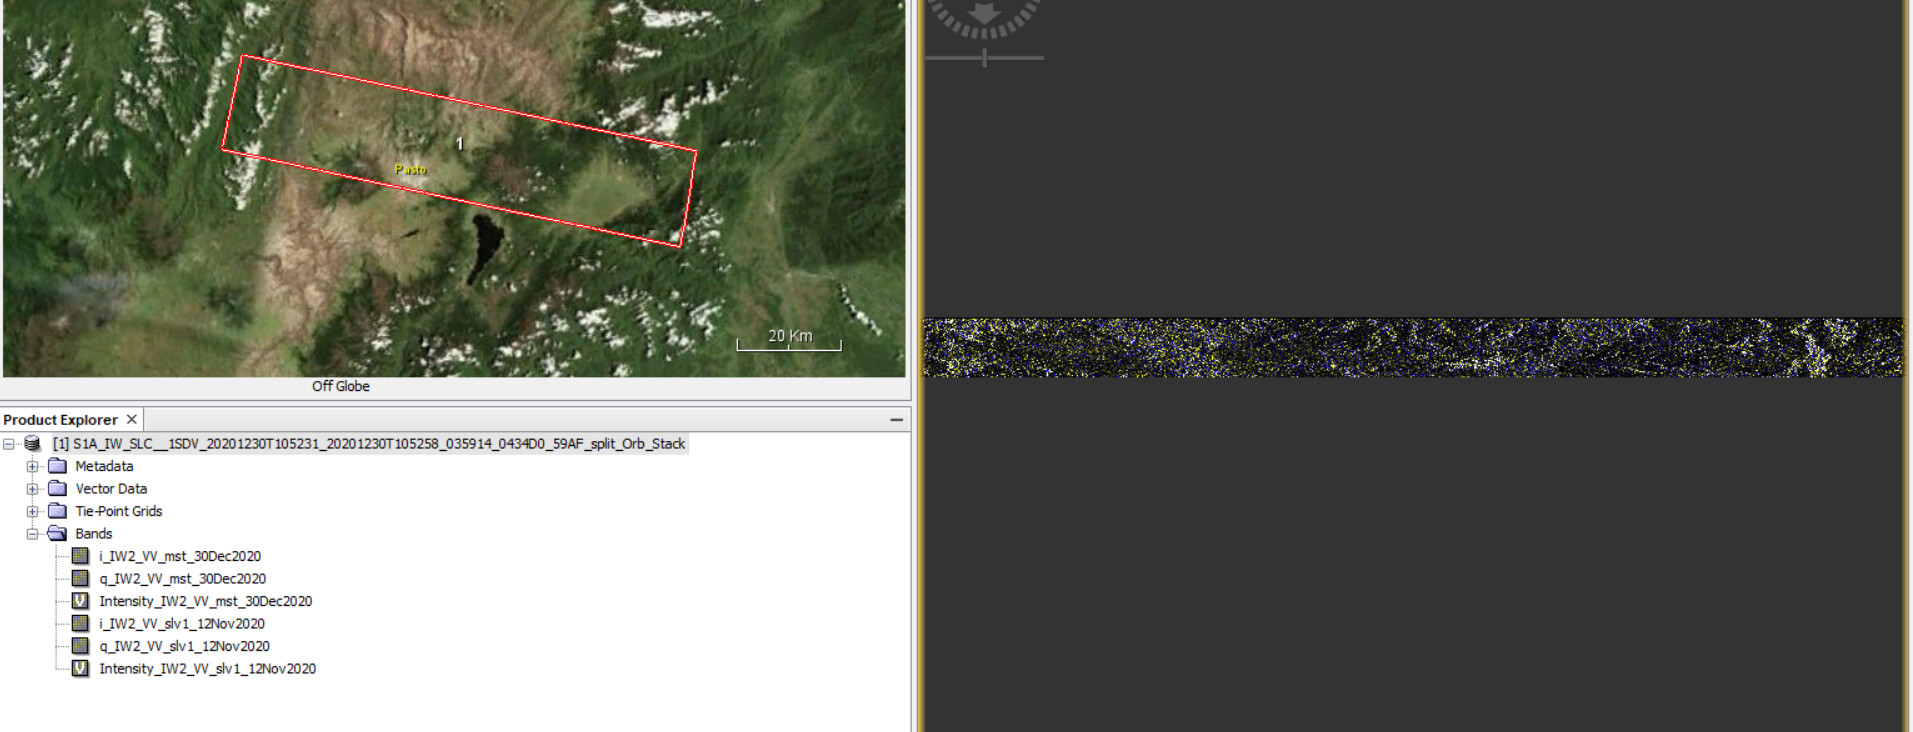
But I tried with images of another time, specifically of november and december of 2020
S1A_IW_SLC__1SDV_20201112T105233_20201112T105300_035214_041C93_A76F.zip
S1A_IW_SLC__1SDV_20201230T105231_20201230T105258_035914_0434D0_59AF.zip
GETASSE30 (AutoDownload) worked and showed data for both images, master and slave
I need to know until what time of the year what images don’t show this problem, because I need to create a time-series and as you told me in few weeks I have to use at least 20 SAR images, I have two that I can use haha.
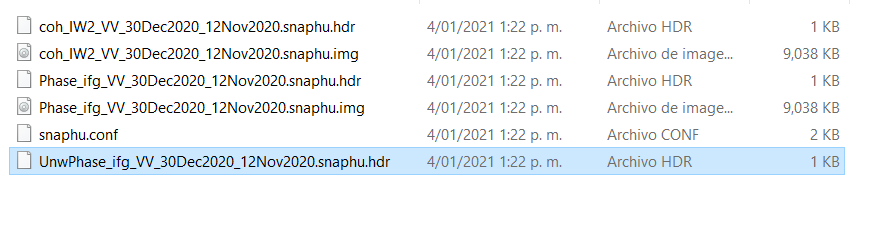
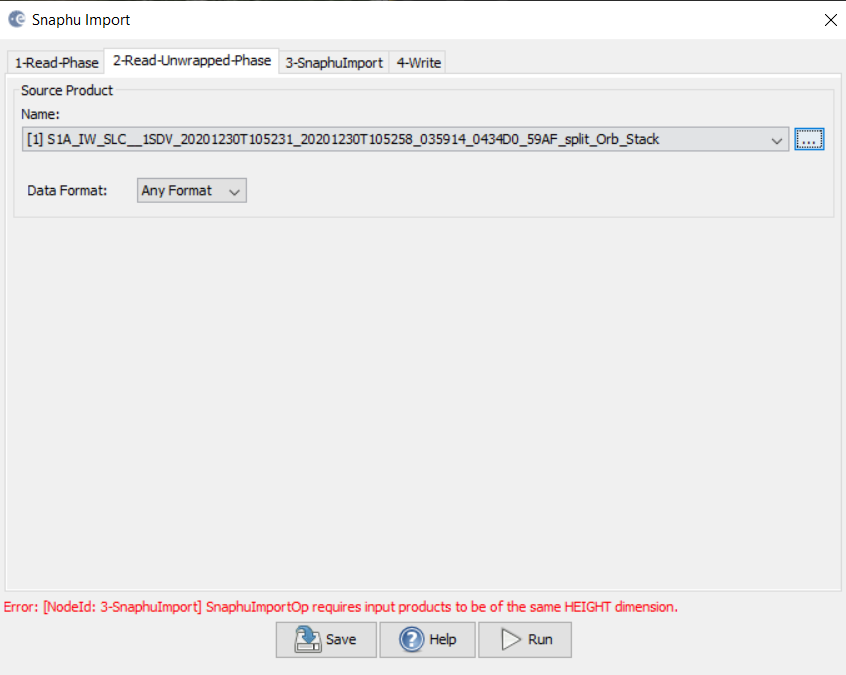
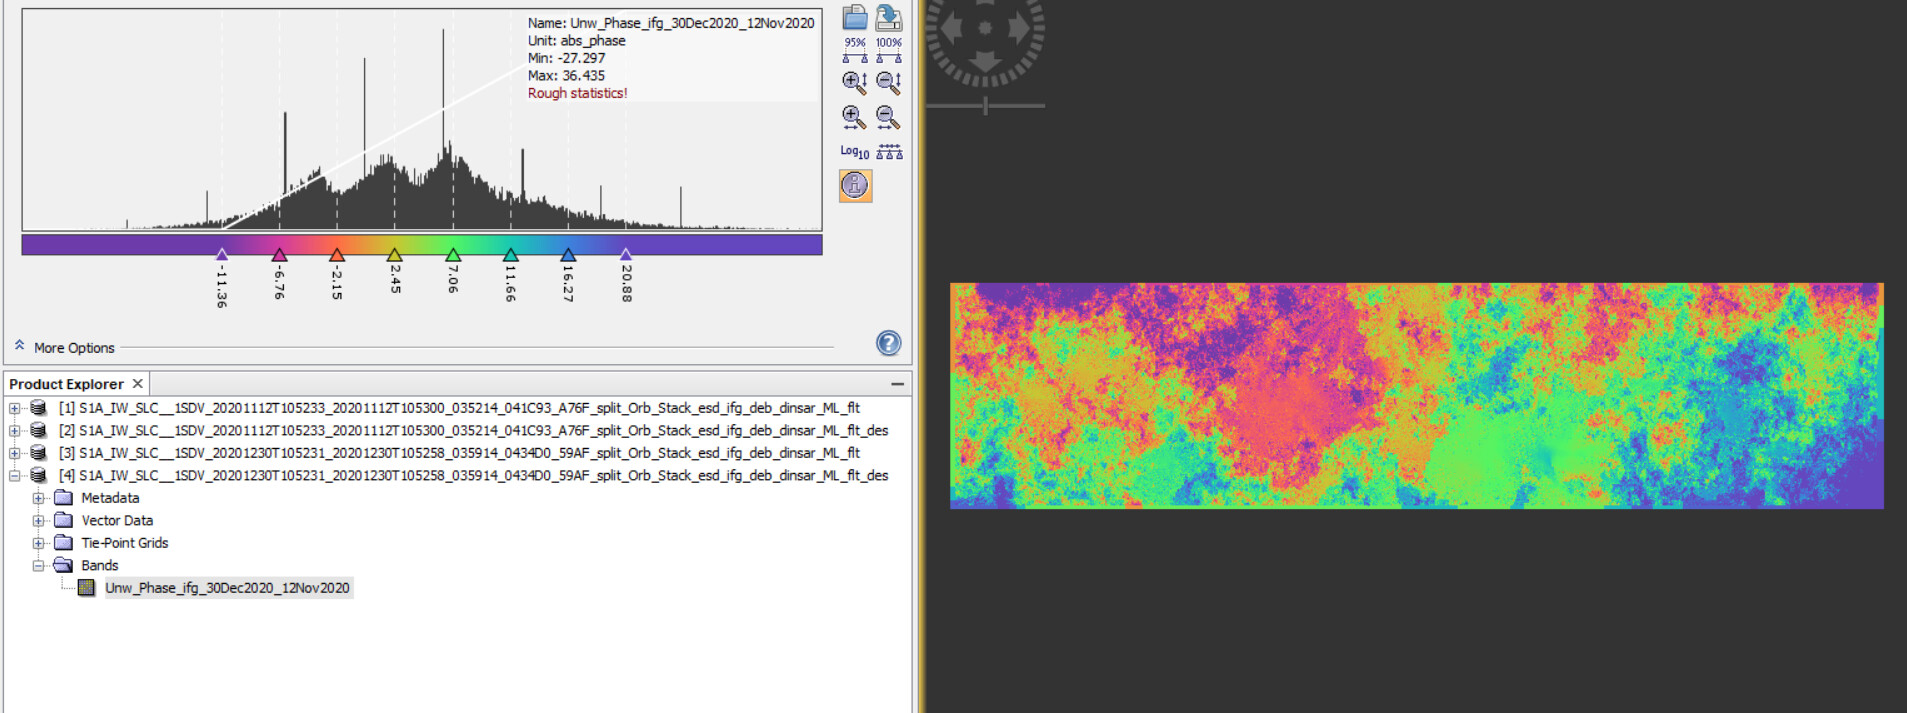
But now I have another problem. It is about Unwrapping step.
For the images of final 2020, in snaphu unwrapping happens this:
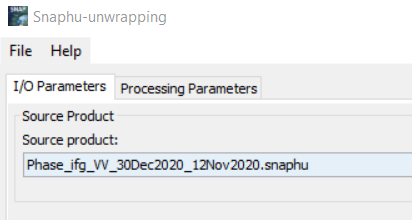
I put Phase_ifg_VV_30Dec2020_12Nov2020.snaphu.hdr as source product, that file is in a folder that I created in snapphu export step
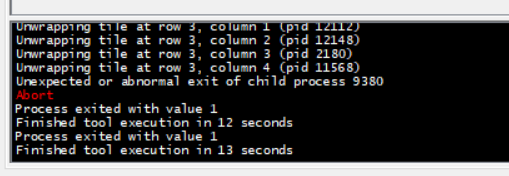
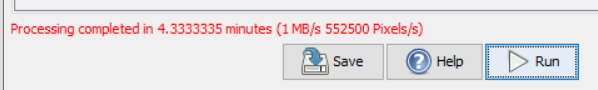
When I run in Processing Parameters appears this message, I think that something went wrong.
So I don’t know what to do here.
if GETASSE30 worked for the one pair, it should also work for the other. Maybe it is worth to download both zip files again and repeat the processing from the beginning.
About the snaphu error - have you filtered your data before unwrapping? How does the interferogram look at all? Snaphu abnormal abortion while unwrapping
Yes I filtered before the unwrapping, with Goldstein Phase Filtering
Interferometric > Filtering > Goldstein Phase Filtering
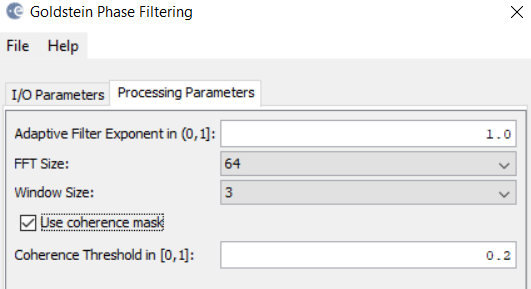
I used those parameters.
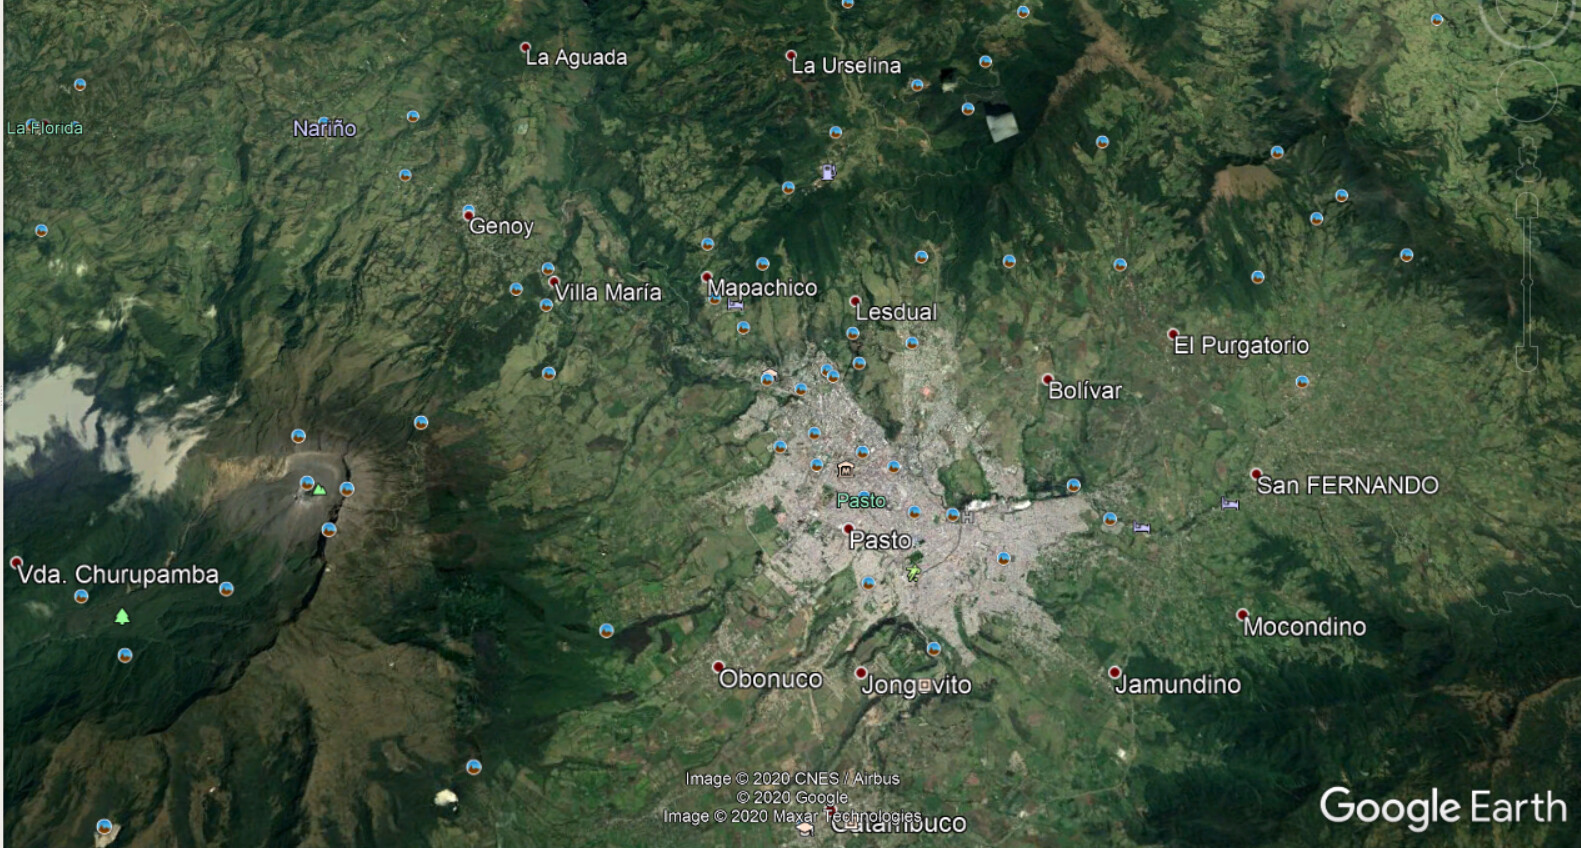
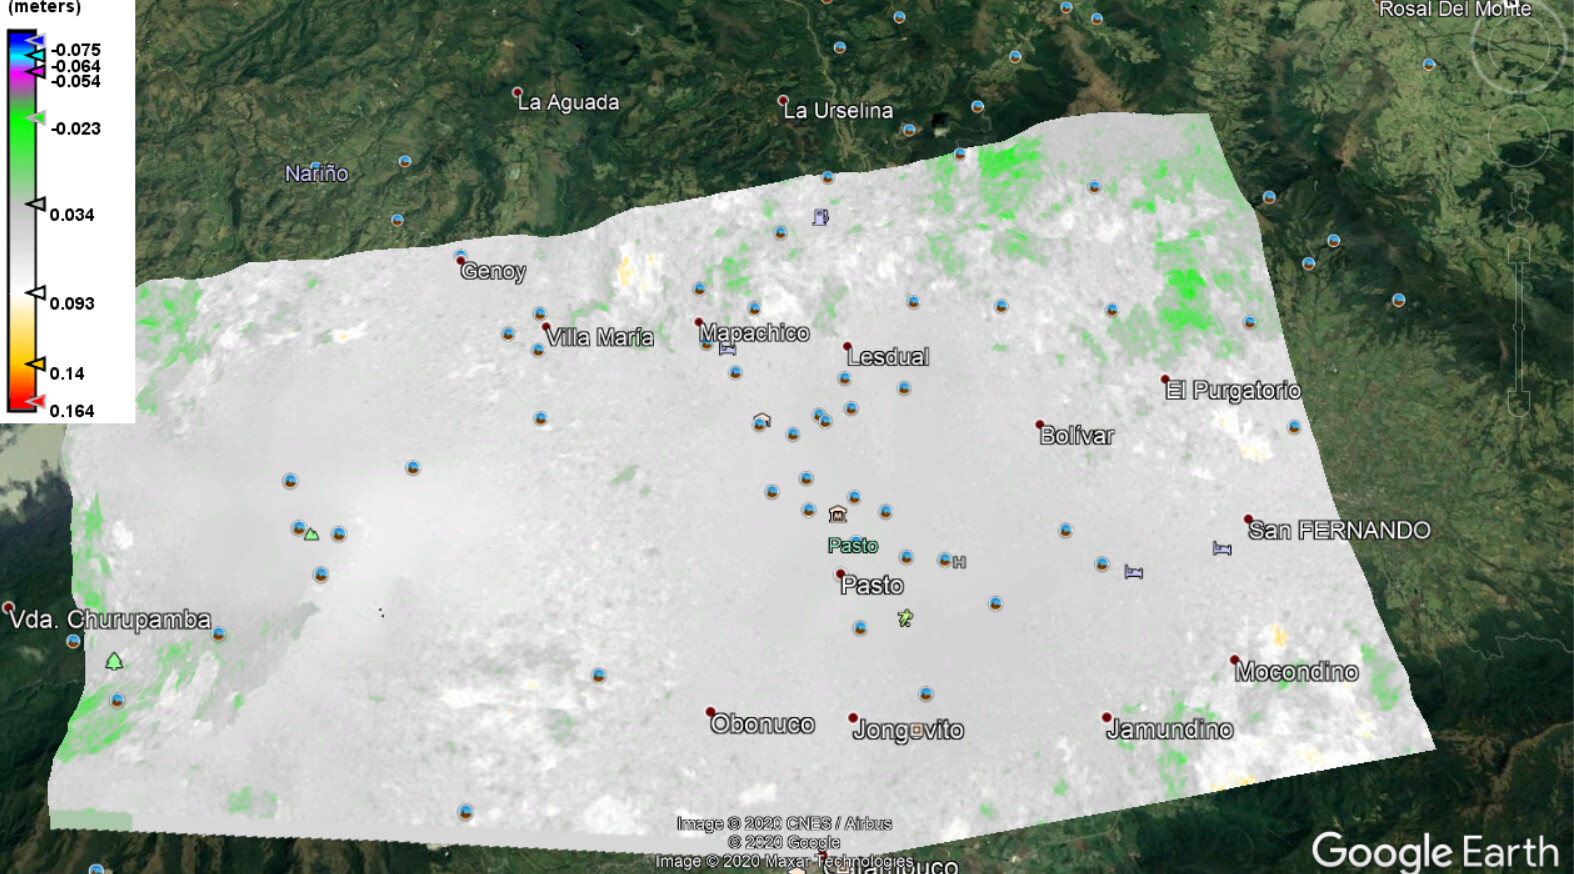
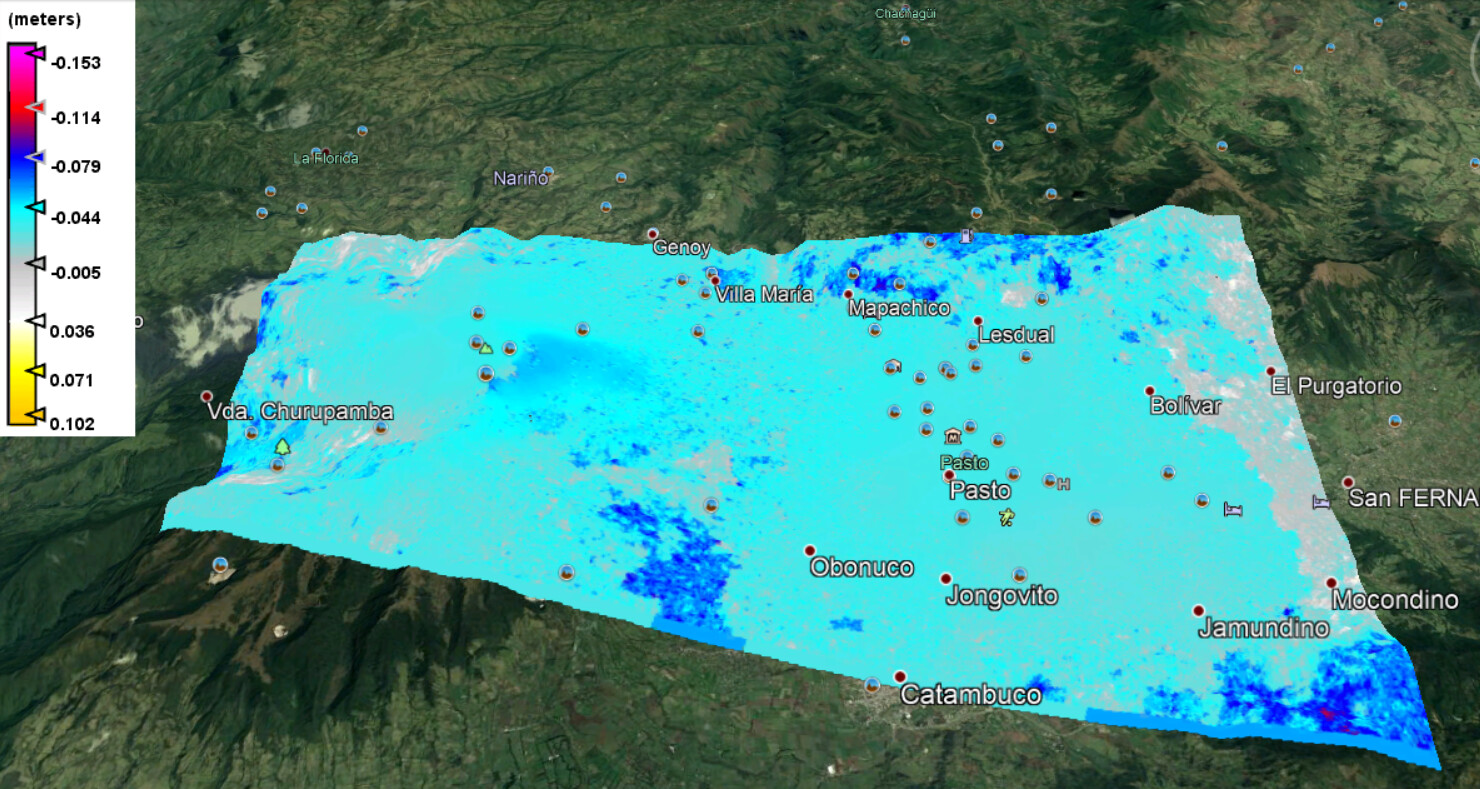
Another thing, I generated a displacement map of the zone. I exported it to Google Earth
As you can see in the west there is a volcano and in the east a city.
With displacement map both (volcano and city are in color gray) and scale is in meters, I would like to know if the results could be possible. I think that displacement in volcano is between 0.034 meters to 0.093, so that means that deformation was positive, but I don’t know how to interprate it right.
Could you help me please?
Thank you.
I have repeated the process for the same area and the same pair and the result is different, now the deformation is negative. I don’t know what is the correct answer.
I can’t tell if the displacement is feasible in your region. How does the interferogram look? Maybe you can share screenshots, also of the unwrapped interferogram.
I have done for same pair the exercise, and the results were different, why could happen that?
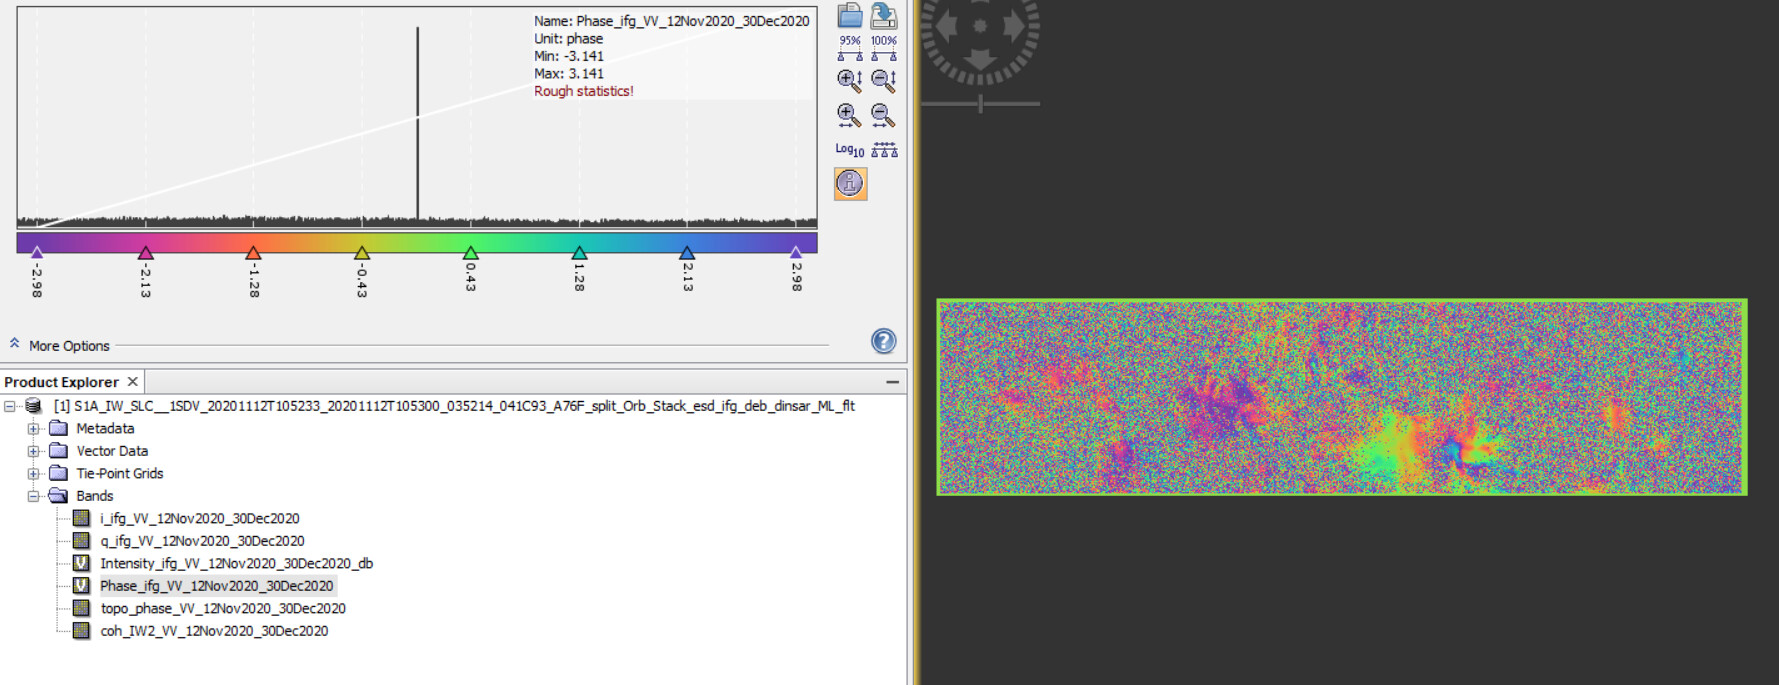
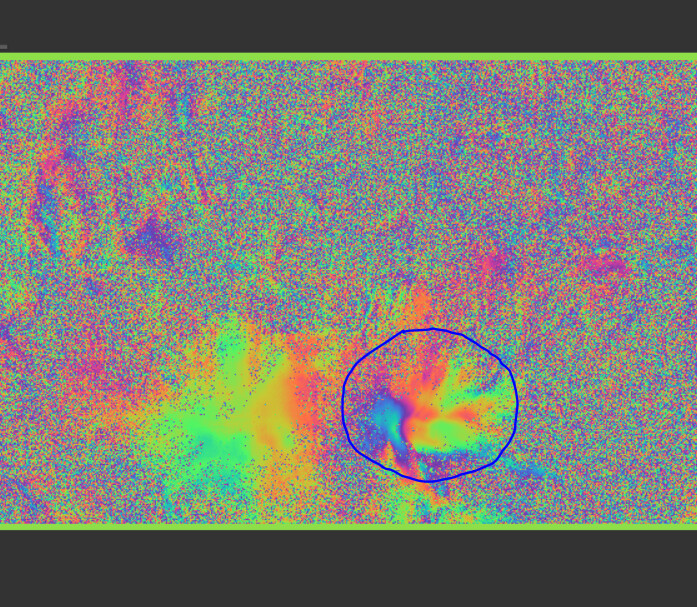
This is the differential interferogram for first exercise
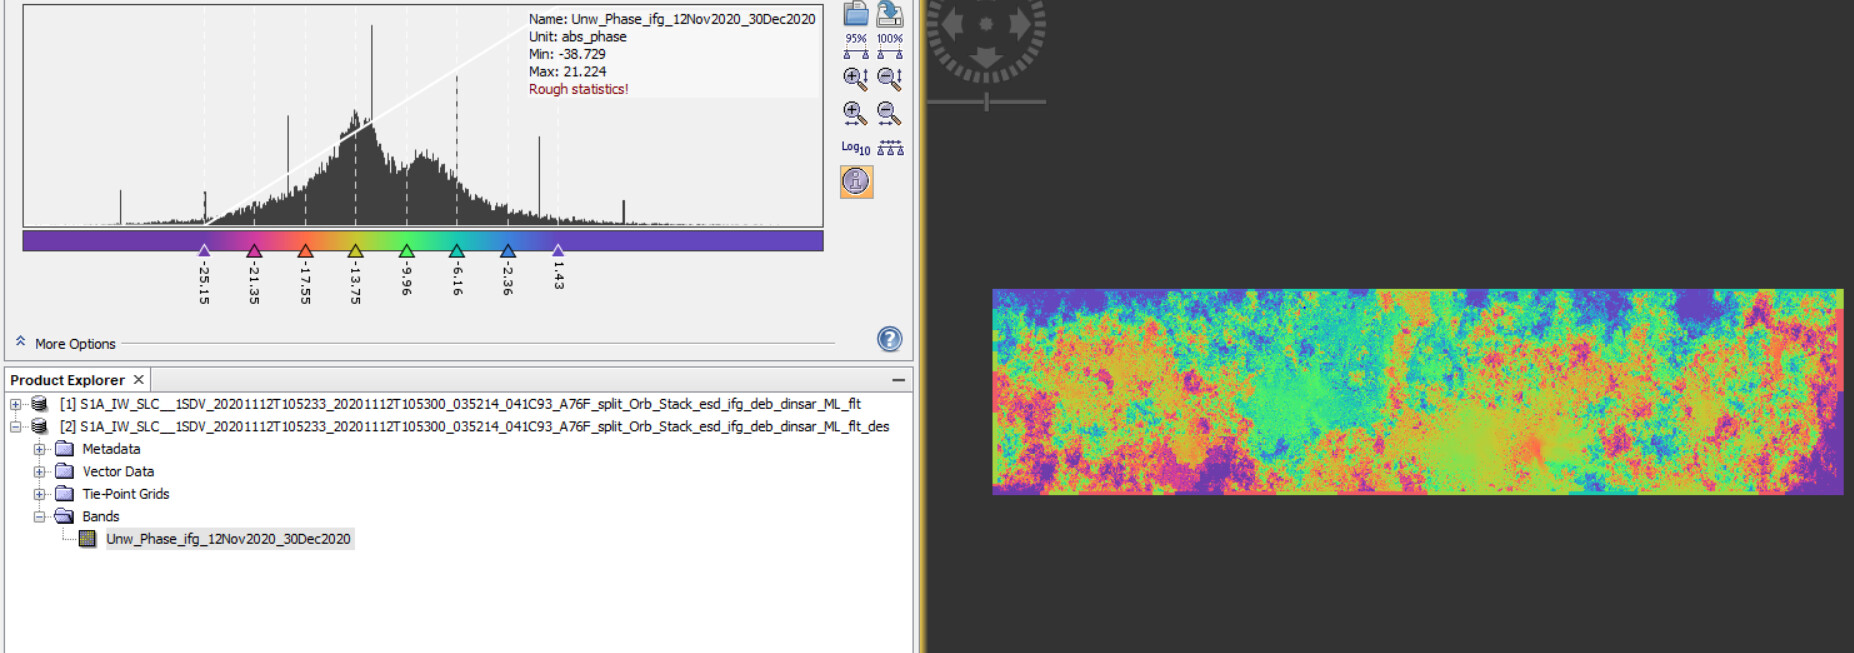
Unwrapped interferogram
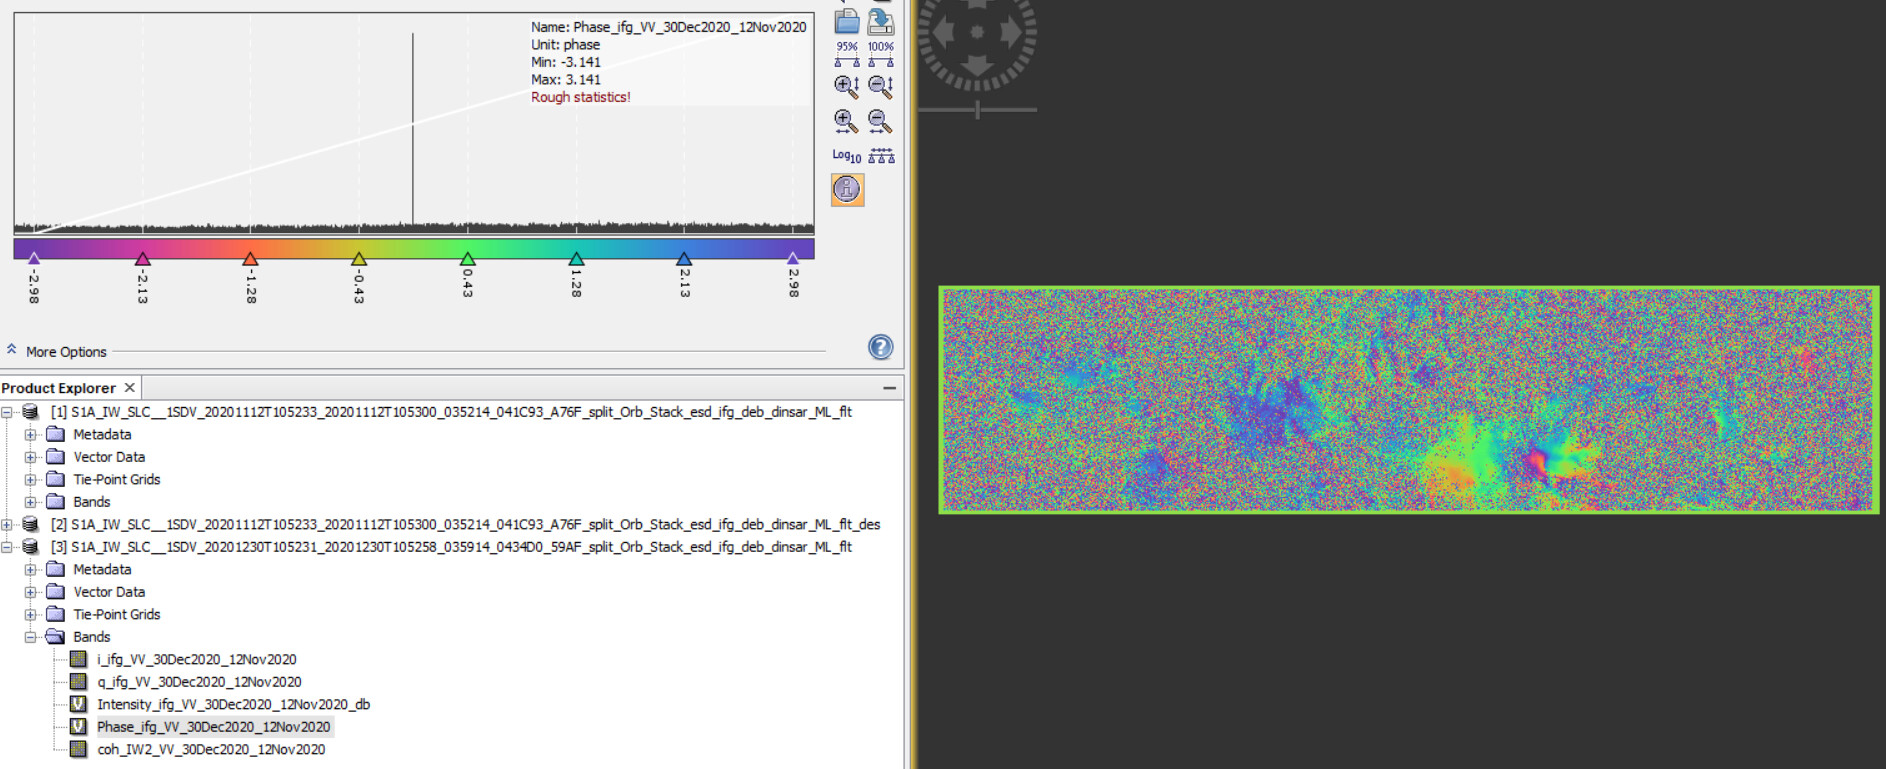
This is the differential interferogram for another exercise
Unwrapped interferogram
You can see that are different, very strange because they are the same images.
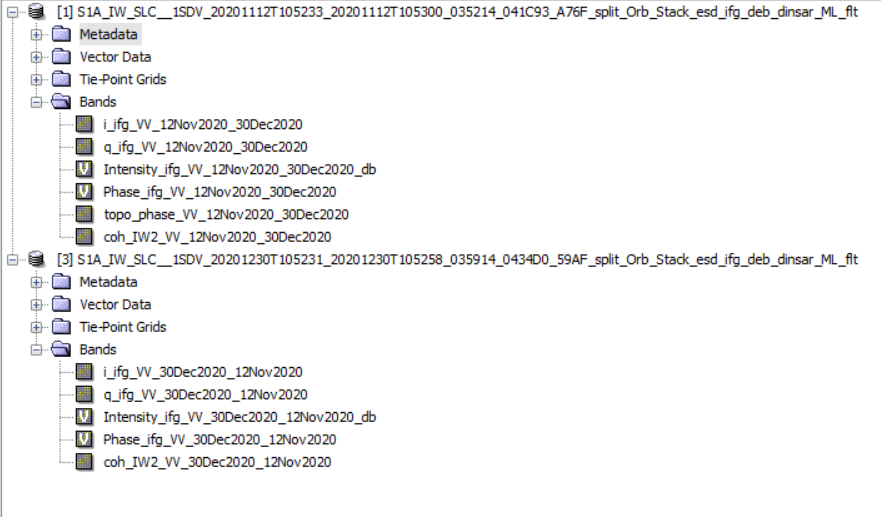
The only thing that I changes in the process was:
For first exercise I put derampDemodPhase_mst file when I made Back Geocoding, for second exercise I didn’t, and for first exercise I put topo_phase_VV file in Goldstein Filtering step, for second exercise I didn’t, as you can see below
I realizedt that I made a mistake in stack, because the name of the file for second exercise is S1A_IW_SLC__1SDV_20201230T105231_20201230T105258, I have done something wrong because it should be like the first exercise
S1A_IW_SLC__1SDV_20201112T105233_20201112T105300, because master image for me is november image. probably the problem is related with that, but I don’t know.
According to my understanding, the interferogram contains too much noisy areas. Unwapping will lead to random patterns here which are not related to surface deformation. Especially completely isolated patches of noisy areas are a problem.
As you see, the phase variation on the areas of highe coherence (those which have a clear pattern in the interferogram) are hardly effecting the patterns in the unwrapped interferograms, and the random phase variations superimpose the actual signal which you want to see.
Is your study area covered by vegetation? Such areas suffer from low coherence and therefore phase decorrelation which leads to the observed noise.
Almost all my country has a lot of vegetation, Colombia is a tropical country with a lot of biodiversity , the only place with low vegetation is in the north of Colombia, in the desert of La Guajira, but its an exception.
My study area is a volcano, I searched active volcanos and in Colombia we have many, the best study volcanes are volcanoes of the South of Colombia, one of the most important is Volcán Galeras, the volcano that I have showed you, it’s a volcano near to the city of San Juan de Pasto, I just need to apply interferometry in the volcano, not in another area and I saw that the vegetation is not so much like in suround area.
So, only for volcano area, what do you think, the result could be possible?