Hi everyone!
I am trying to proccess a series of SAR images in order to prove the deformation rate at the islnad of Cefalonia, Greece.
I have followed these steps:
split the images
apply orbit
calibrate
Right now I’m trying to coregistrate the images I have just proccessed but it pops this message: “Source product should be multi sub-swath SLC burst product”. In order to fix that, I made the subsets of my images, but then when I try again to coregistrate, pops this message: “The file parameter is not set”.
What am I doing wrong? Have I forgotten a step or have I proccessed a step wrong?
Thank you in advance,
Christina
to be honest I have watched a lot of videos on Youtube and esa.com but I still cannot follow all the steps. I am sure I miss something but still I cannot complete thw proccessing.
did you stick to the BEAM-DIMAP format during your preprocessing?
For Sentinel-1, TOPS Coregistration is more suitable which combines application of orbit files, splitting, subsetting and coregistration of single pairs. If you want to investigate continuous deformation (AB, BC, CD…) this might be the better choice.
I don’t think that manually subsetting the scenes would solve your error.
Yes I selected the BEAM-DIMAP format during the proccessing and I tried the TOP Coregistration and the second message appears. I will try again in case i missed something. I hope i solve this because my thesis deadline is about to finish.
Well I found a computer able to process my data. I have done all the steps on the manual and I am one step away from Sanphu Export. My problem is that I don’t want the whole image to processed, I need just the island. I tried making a subset but I couldn’t. What can I do to isolate my area?
Thanks a lot for the tip! It worked perfectly. I would like to ask something else.
I finished all the steps up to filtering for a pair o SLC images. Now I will export the result to Snaphu so i can have the information for the land deformation, is that right?
I have 20 pairs of images. I have to do all the steps for each pair. My question is: How I combine all these results to have the final result?
If you already removed the topographic part of the phaae, you can proceed with the unwrapping.
For longer time-series it is good to pair images with short temporal baselines, geocode the results and then stack them in the end.
Have a look here. Some things were different back then but the analysis of results in the last slides is well done:
no, the tutorial is just from a time then SNAP was called NEST. You can proceed with the export and import without all the complicated steps in the tutorial and directly terrain correct the displacement map as described in the last part of the slides.
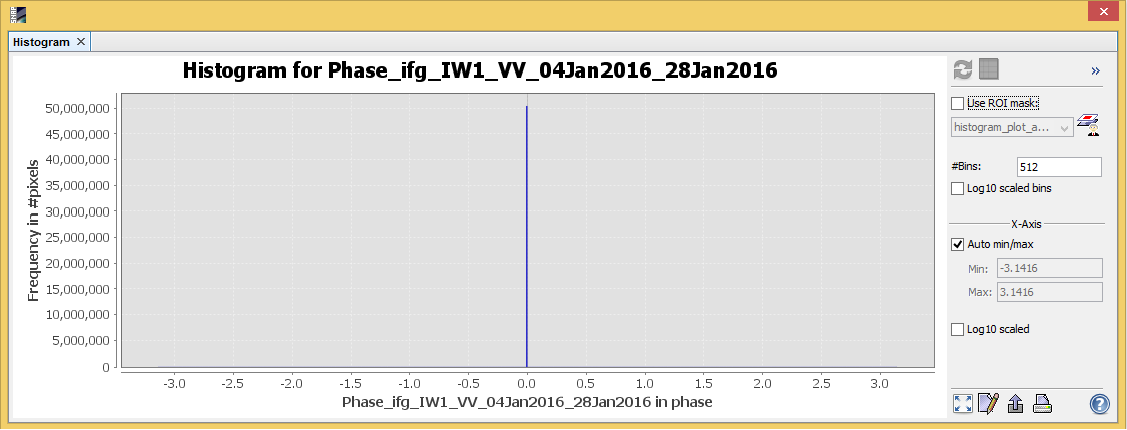
The Histogram of Phase for the pair i am processing is that. The perpendicular baseline is 103,29m. I am not sure if this is ok. Can you please help me?
manually adjust the min / max values to -5 and +5, for example to have more detail in this area.
Outliers in your data strech the histogram over an unnecessary large range.