These are my pair’s statistics
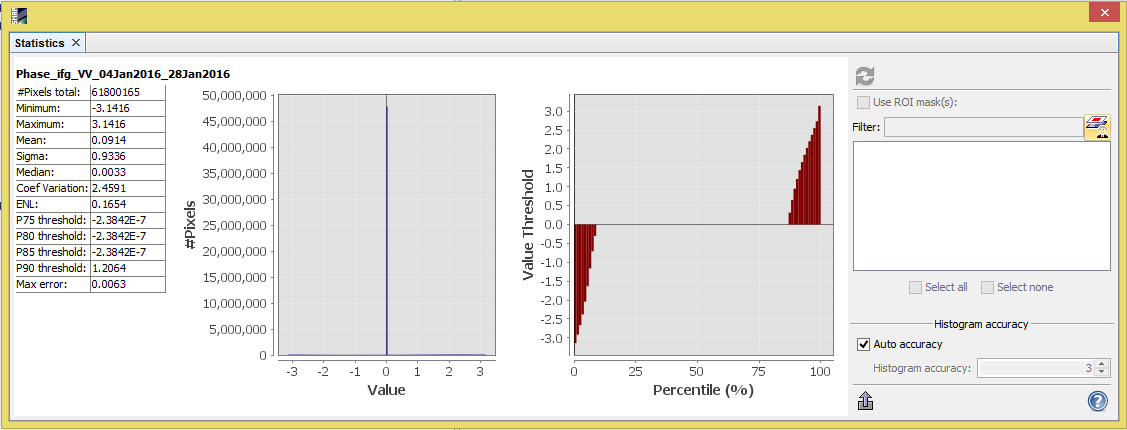
the range is reasonable, but the high amount of 0 is suspicious. Could be the value at the border of the image - please show us the image of the interferogram.
I think that happens due to the fact it is an island and the water probably has 0 range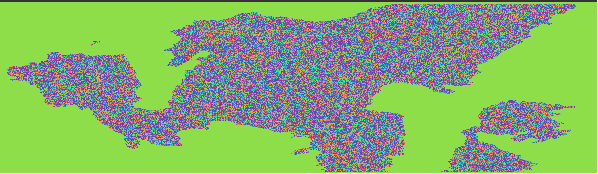
yes, as I expected. However, I don’t see any fringes in the image. Do you have coherence in your image?
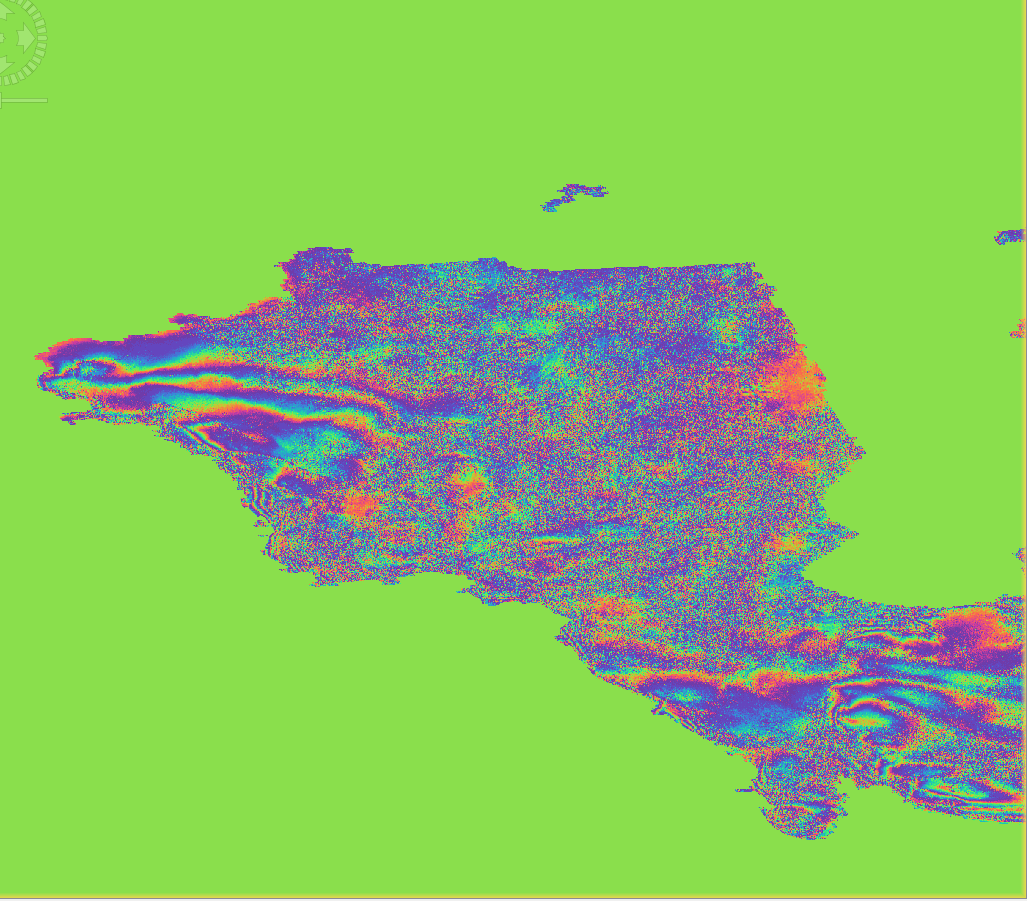
that looks good actually.
I produced all the displacement maps for each phase. Now I want to so that on a map. How do I do this? Should I export my map to ArcGIS? Is there a possibility to combine all the separate displacement maps to one?
what do you mean with “do that on a map”? If you terrain correct your results they are geocoded.
About the combination of different displacement results:
If all of your images are of same imaging geometry you can also proceed like described in the last slides of this tutorial: https://eo-college.org/resources/insar_deformation/