PSInSAR Result

Dear All,
I have successfully generated PSI of my area , found the displacements by using Snap and STAMP.But terrestial measurements show 30cm to 60cm subsidence in the area, whereas my PSI points range is between -8 mm to +5 mm. I have seen the terrain has really big chanks of subsidences place to place.
I was wondering why PSI couldn’t catch these subsidence.

I have a few guess if you agree:

  • The area is very mountainous and our field is quite in the inner side of the mountain and shadowy and full of hazelnut tree. (I know radar beams sould tackle well with these situations, but FYI)
  • I haven’t done ant topographical correction. My workflow is : SLC level1 S1a image:
    split -orbit-backgeocoding-deburst-subset-interferometry-export stamp-get PSI points
  • but to check the process I also did a DİNSAR with top phase removal and filter I am still getting result similar to PSI making sure the change in the field is covered by the images.

Could you please help me to convince radar is capable of monitoring the surface.

Looking forward to your comments ,

Regards

1 Like

Maybe you can share one of your results for visual demonstration.

Some reasons for possible under-estimation

  • StaMPS measures displacement along the line-of-sight (LOS), not the entire vertical displacement.
  • you could compare results gathered from ascending data with descending data to see if the displacement patterns are the same for both directions (thus confirming real deformations).
  • during the interferogram generation, you should apply topographic phase removal, so that the phase image only shows the variance caused by the difference between both images and no longer topographic variations. This helps in the later unwrapping.

Thank you for your reply.
Please find two screenshots attached.
Ok I have used 6 Ascending slc images, now I will try descending with the same images and top phase step.
But why the land slides are not visible with Dinsar? this is interesting. I must be doing smthg terribly wrong:)

More information: This is from R Studio-visualiser. Color range: blue (10 mm) -red (-15 mm per year) . But somehow I couldn’t use TS comparison for points number above 999, where I have +3000 points. But I can see them one by one as this graph belongs to number 1298.

Landslides are a non-coherent process. That means the surface characteristics and scattering mechanisms change during this time. Accordingly, the phase information is subject to temporal decorrelation and not persistent scatterer is identified here.

The one you selected could show random movement. PS InSAR is good to detect patterns of displacement, but a single point shouldn’t be trusted too much, especially when it is rather isolated from its neighbors.

Furthermore, the identification of PS based on 5 images only will not work properly. For PS InSAR you need time series of 20 images or more to get reliable and statistically stable results.

Thank you very much for valuable information. Then, first I will increase the image set size, do PSI with top phase step then see the result. I will come back here and share the results in either way.
Regards.

good luck!

1 Like

Just a suggestion - try to find any GNSS data for this region.

1 Like

Hi all,

Sorry If this is not the right place to post this but I have recently produced my first PS InSAR results and I was hoping to get some advice and have some trained eyes take a look to see how I can improve. Any help is greatly appreciated!

The project I am working on aims to monitor the rate of seasonal ground deformation over Auckland CBD which has been know to be related to shrink swell in clays. Movement has been recorded to be up to 20mm/yr.

I am working on a Linux machine with 32GB RAM and 1TB SSD.

SNAP – version 7
StaMPS – 4.1
TRAIN – 3-beta

For these preliminary results I used 32 descending SLC images from Sentinel-1 frame 716. The data is from 20181205 to 20191224. Roughly 2 images per month.

I processed 2 bursts from IW1 (outlined in the study area fig below) using the SNAP2STAMPS workflow developed by Jose Manuel Delgado.

In StaMPS:
Parameters for mt_prep_snap were as follows:
Amplitude dispersion = 0.4
Number of patches in range = 6
Number of patches in azimuth =3

I then ran steps 1,5 for each Patch individually with:
Weed_standard_dev = 0.8
Merge_resmaple_size= 20

I did this because I was getting a lot of pixels in the water and other noisy pixels and to reduce processing time. But I am still getting a few pixels in the water still.

Then I merged the interferograms and found that some seemed to not unwrap very reliably and not appear smooth – so I removed them to see if it would improve.

The interferograms I removed were:
23 March 2019, 15th June 2019, 07th Sep 2019 and 12th Dec 2019.
Was I wrong to do this? Did these interferograms actually unwrap properly? Is 4 too many to remove?

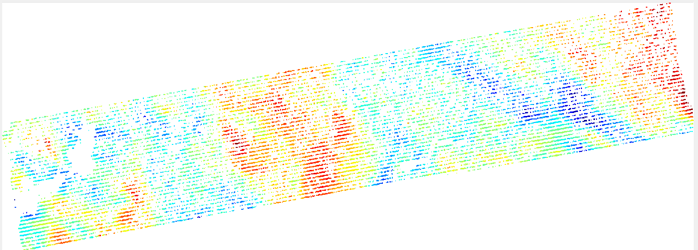
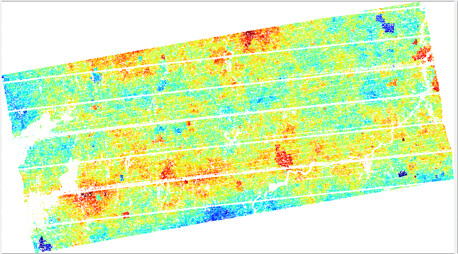
I’ve attached some of the results from before and after removing the interferograms. Fig1-3 are before removing the interferograms and the rest are after they were removed.

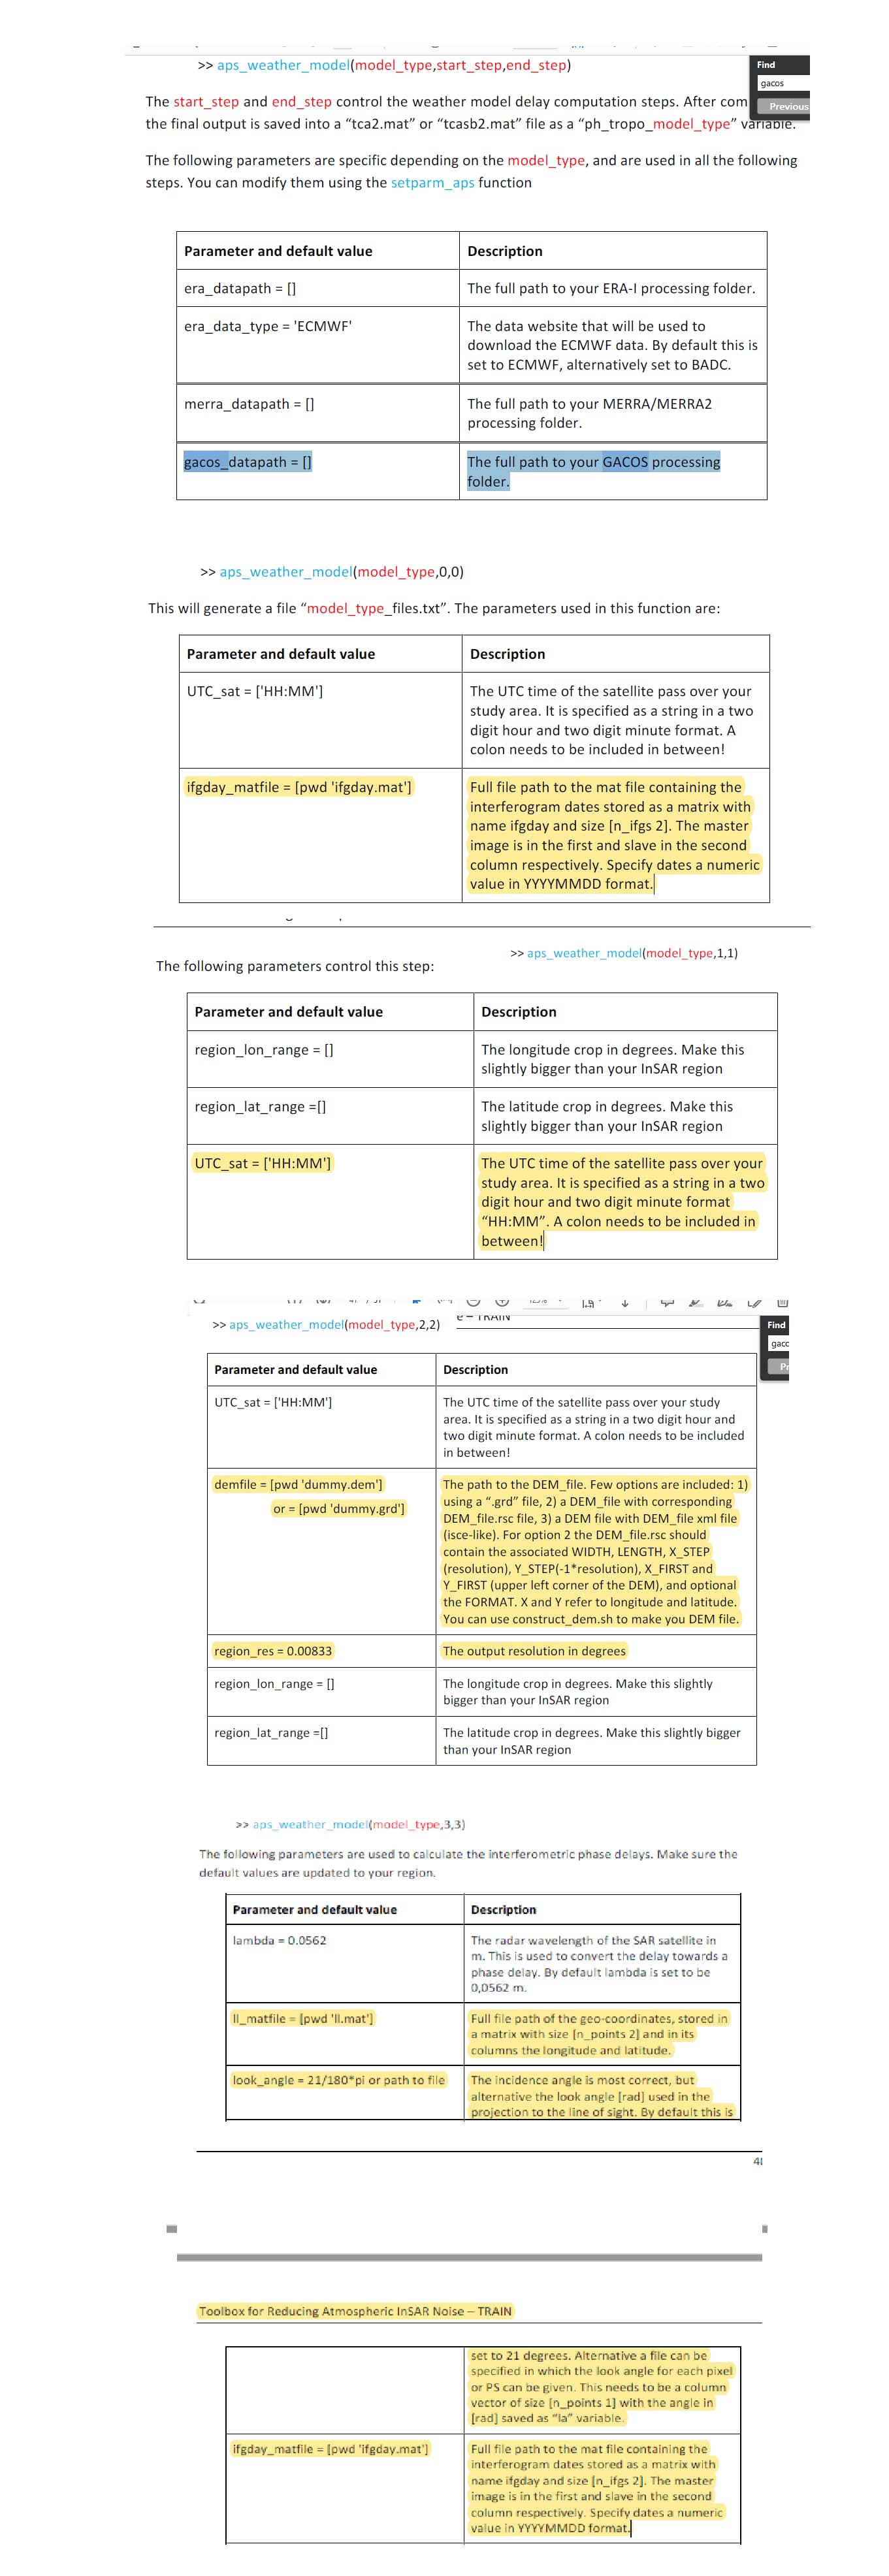
I also used TRAIN to remove atmospheric effects using the linear tropospheric correction. I am working using the GACOS weather model method but have not completed this yet.
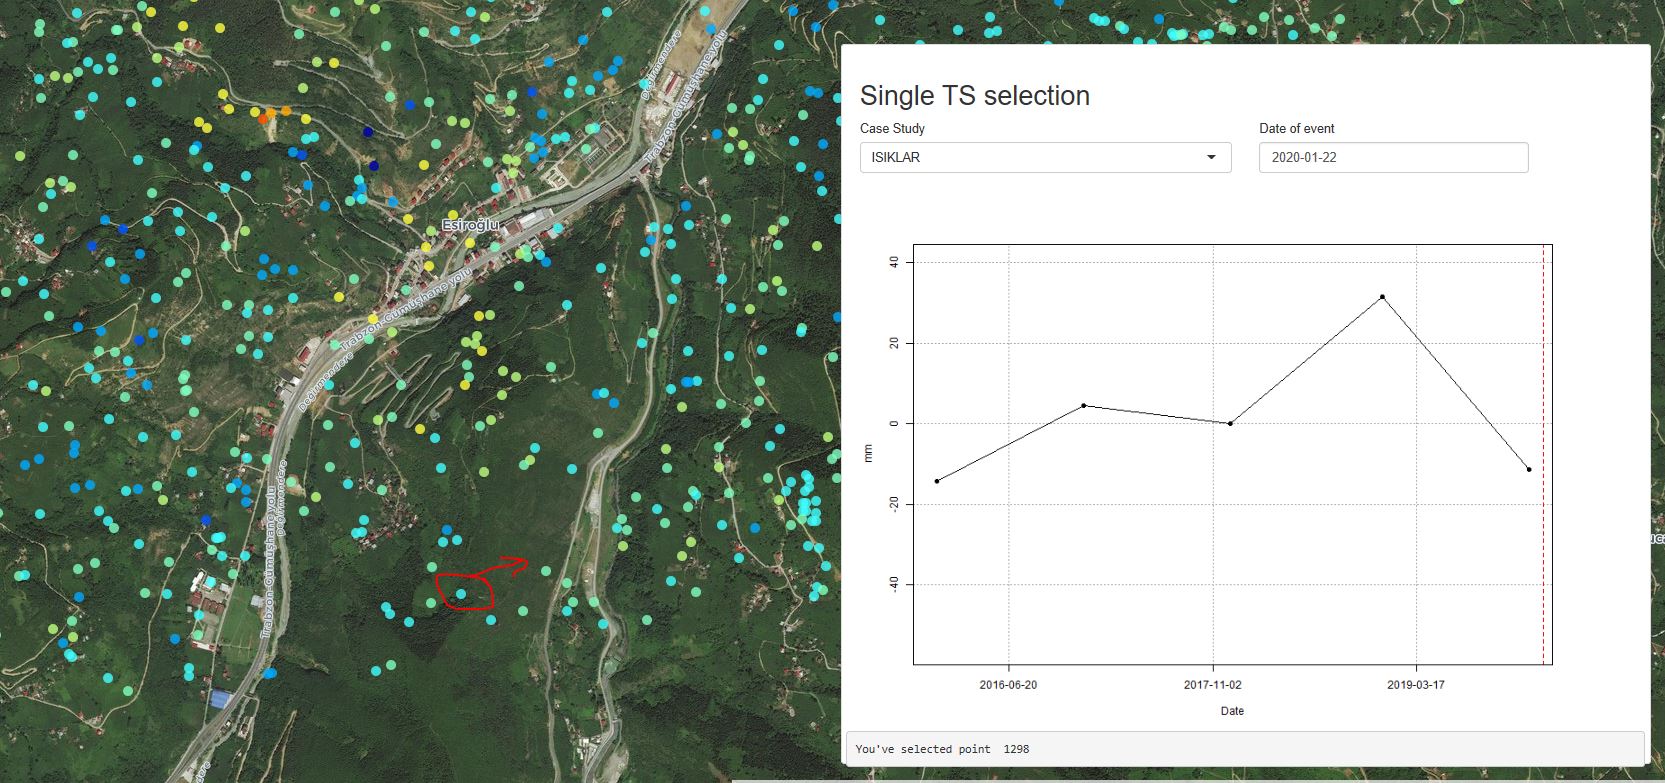
The measurements are referenced to a GNSS tidal gauge located on the docks; this was the only one in the area. Does the reference point need to have a PS pixel located exactly at this point?

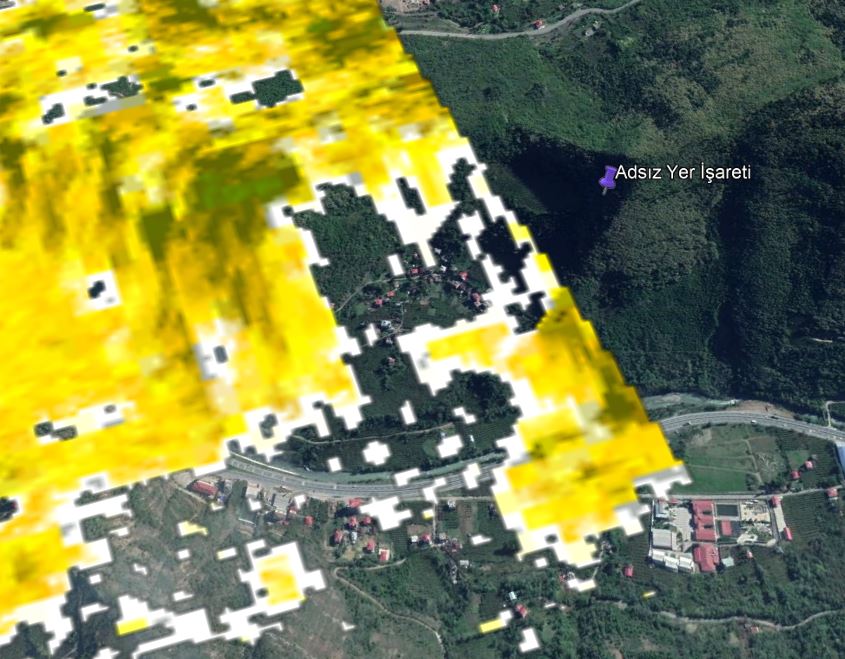
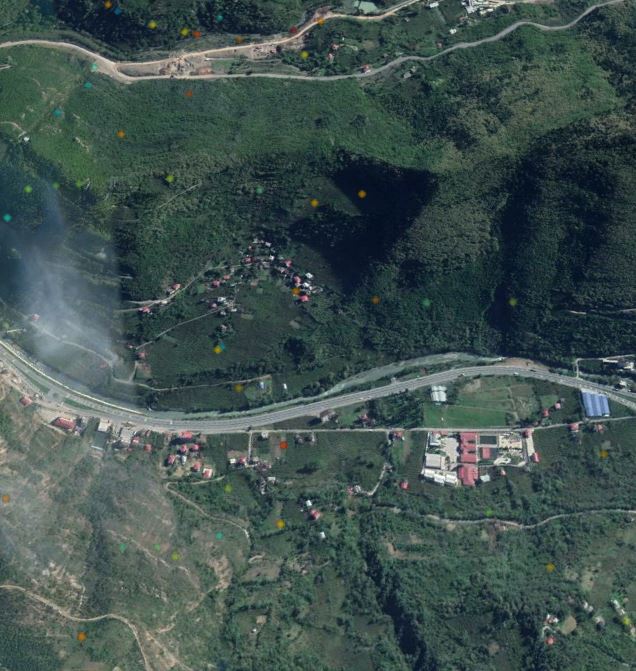
I have also attached an image from the StaMPS visualizer app showing the area I am interested in. There is still a lot of variation in the ground movement between each point which I assume is related to noise, as there is a lot of construction in the city taking place in the city but any help on how to smooth out my data would be appreciated and any obvious errors I have made, as I’ve tried a few different parameters each time but am still not sure if what I’m doing is accurate.

Thanks,


getparm (2.5 KB)
ps_info (1.2 KB)
Fig1_Wrapped.tiff (1.4 MB) Fig2_Unwrapped.tiff (1.1 MB) Fig3_u-dm.tiff (1.1 MB)
Fig4_Unwrapped_drop_ifg.tif (560.9 KB) Fig5_Wrapped_drop_ifg.tif (558.1 KB) Fig6_u-dm_drop_ifg.tif (563.6 KB) Fig7_dem(d).tif (612.5 KB) Fig8_AOE(m).tif (529.8 KB) Fig9_u-dao_linear.tif (566.7 KB) Fig10_v-dao_linear.tif (534.2 KB) Fig11_v-dao_linear_AOI.tif (401.8 KB)

Hello @MattC

It looks great but I have some doubts. I’m trying to use TRAIN, I can see in your getparm file the parameter “subtr_tropo” is set “n”, that means you don’t extract tropospheric corrections from your interferograms using ‘tropo_method’ parameter (a_l) but, you share some “v-dao_linear” images.

How did you do it? When I try to use TRAIN I get this error in step (7,7) related to “subtr_tropo” set “y”,

I can’t plot ‘v-dao’. I think I have a problem with my TRAIN configuration.

Thank you.

2 Likes

Hi, I have this same error in Step 7, did you @CFEgildan71 solve it? Thanks.

Hello @Giova

This error is because you don’t have the tropospheric bands extracted. You need extract the tropospheric bands in step 6 before phase unwrapping and you can do it runing aps_linear or aps_powerlaw to create the .tca file. If you don’t want to extract tropospheric correction using TRAIN, then set ‘n’ your ‘subtr_tropo’ parameter to run step 7.

2 Likes

In addition to @CFEgildan71 's answer: You can plot without an error by running ps_plot(‘v-do’), so without the atmosphere corrected component.

1 Like

i have created several individual unwrapped interferograms can i stack them and export it to stamps? or do have to do it another way?

@joshneild97 You can check Workflow between SNAP and StaMPS to understand how do it.

I dont know if this is the right topic to write about but I need an advise. I have PSI results of a landslide area and a detail report with figures and plots. This area has been also approved as a landslide area by the authorities but I dont have any reference points belong to that area to compare/validate the PSI results. Now, I want to turn that report in to a research paper /article but, as I dont have the ground control points, I couldnt imagine the story in my head to start writing the paper. I was wondering if you could advise me another way to compare/validate my PSI results without GCPs/survey points or another scenario to form a nice paper?
Thanks in advance,

Hi.
I am having the following problem. I obtain the results too much stratified. Is this normal? I present you two images of two different case-studies.
The second I thought it was a problem with the deburst, but I saw every single IFG-coreg and they had’t this problem.
It is a preprocess problem (SNAP) or a StaMPS one?
Thanks a lot!


image

Try with python wrapper instead of SNAP GUI, and check the results.

mdelgadoblasco/snap2stamps: Using SNAP as InSAR processor for StaMPS (github.com)

1 Like

Thanks for the support. I was thinking on this solution, but as I had done some other cases and I hadn’t this problem. Wondered me if it was relative to the area of study or just image failure. I will do it and let you know.

1 Like

Someone has suggested choosing referencing point where pixels show high cohererence values over tim (close to unity), but if there are more than 70 interferograms and corresponding coherence maps from the automated Snap pre-processing, and checking the coherence value for a group of pixels of a defined location in each coherence map one by one is quite impractical.
Is there a method to stack all the coherence maps and filter only a group of pixels based on a coherence threshold throughout the entire stack, so that I determine the long/lat of the pixel(s) whose value coherence barely ever changes through time ?

Also, Have you figured out how to practically apply GACOS using TRAIN ?
I have followed the TRAIN’s manual but it stated that there are several auxiliary input data and data paths required to be set up as a priori before starting TRAIN steps, as shown in the attached picture