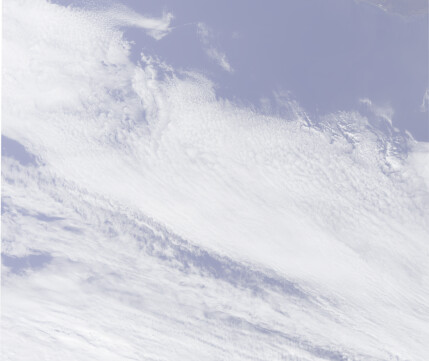
The reason for this is how SNap generates the images. The colour stretching depends on the scene content. On an image which has less clouds it would look hazy.
You can overcome this by adding an additional step.
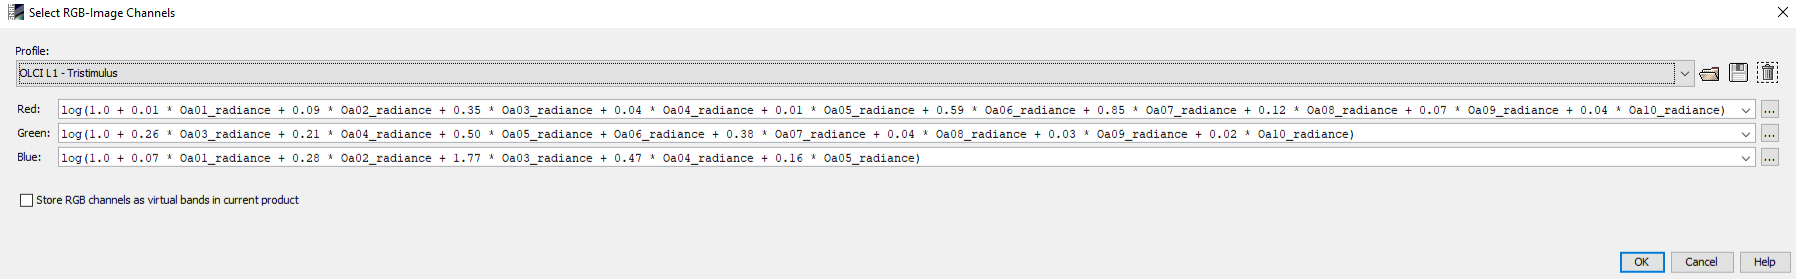
You can limit the value range of th RGB channels.
The virtual bands are the results of the tristimulus expressions.
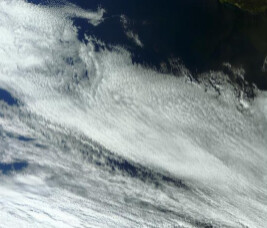
This will reduce the effect and images are comparable.
You might need to play around with the limits to get a good result.
Thanks for your answer, I have limited the value range of the RGB channel and it does overcome the colour stretching.
However, I have discovered the scene function of SatPy library and the quality of the picture I get is largely higher. SatPy provides great function to generate pictures, it’s an interesting tool for my work.