I want to analyse NDVI from the same AOI using different dates (sentinel-2A images), is it possible to do this using SAR Time-series Analysis tool? if yes, how can I do so?
yes, this is possible. I created step-by-step instructions here: Time Series (Temporal) of NDVI
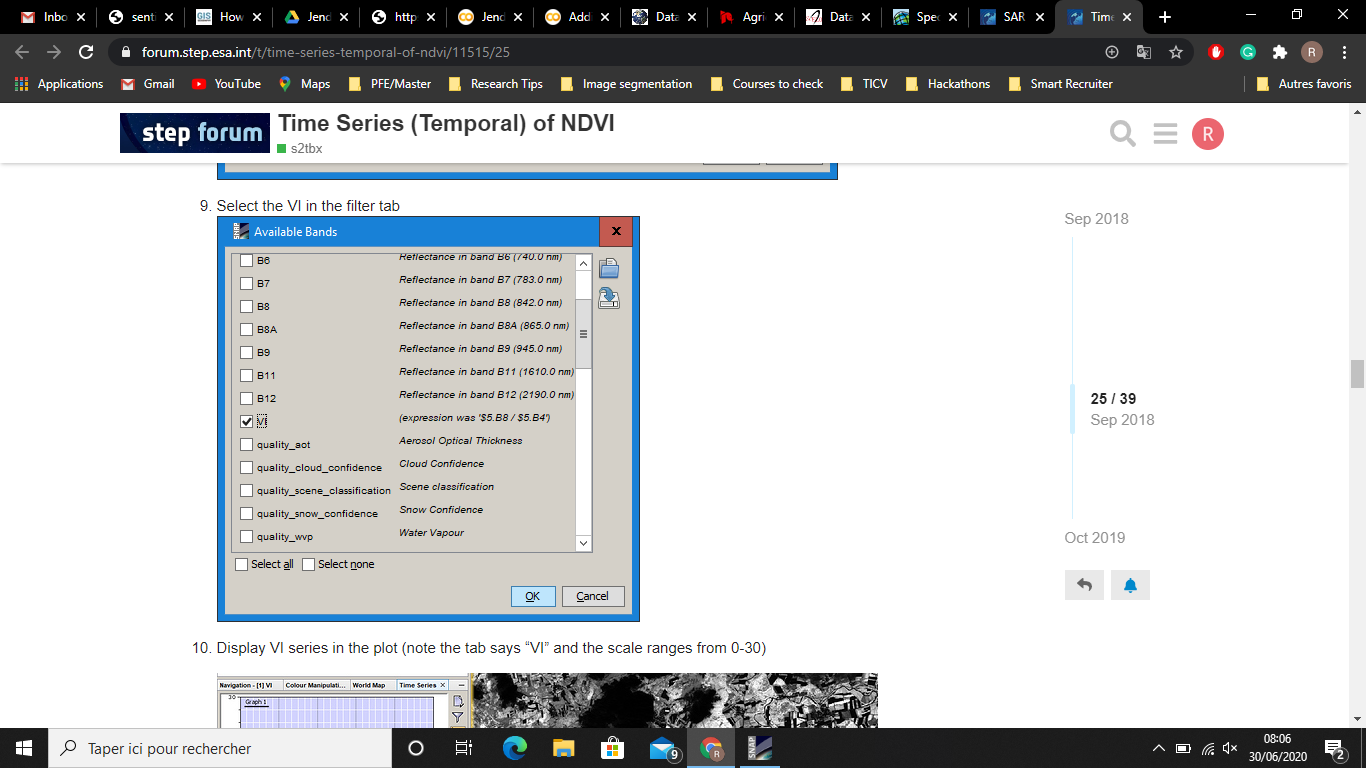
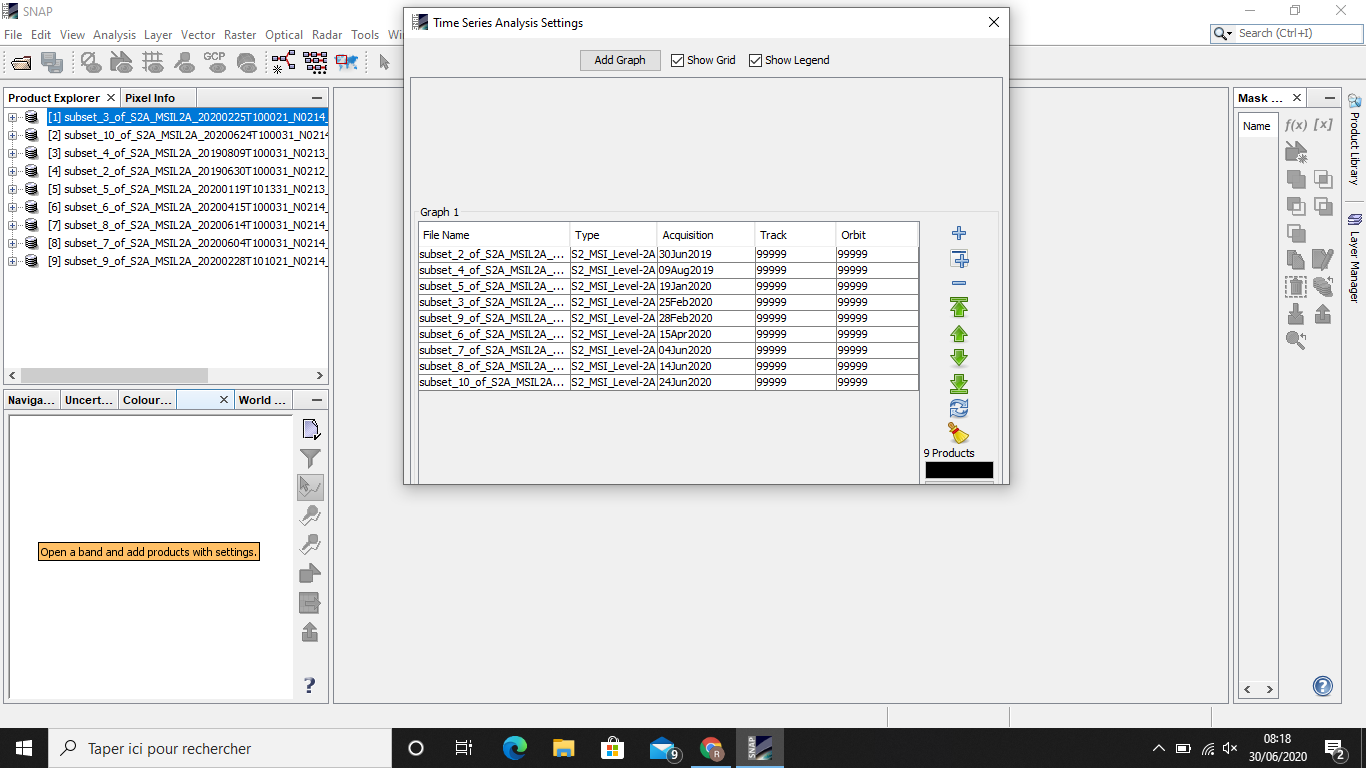
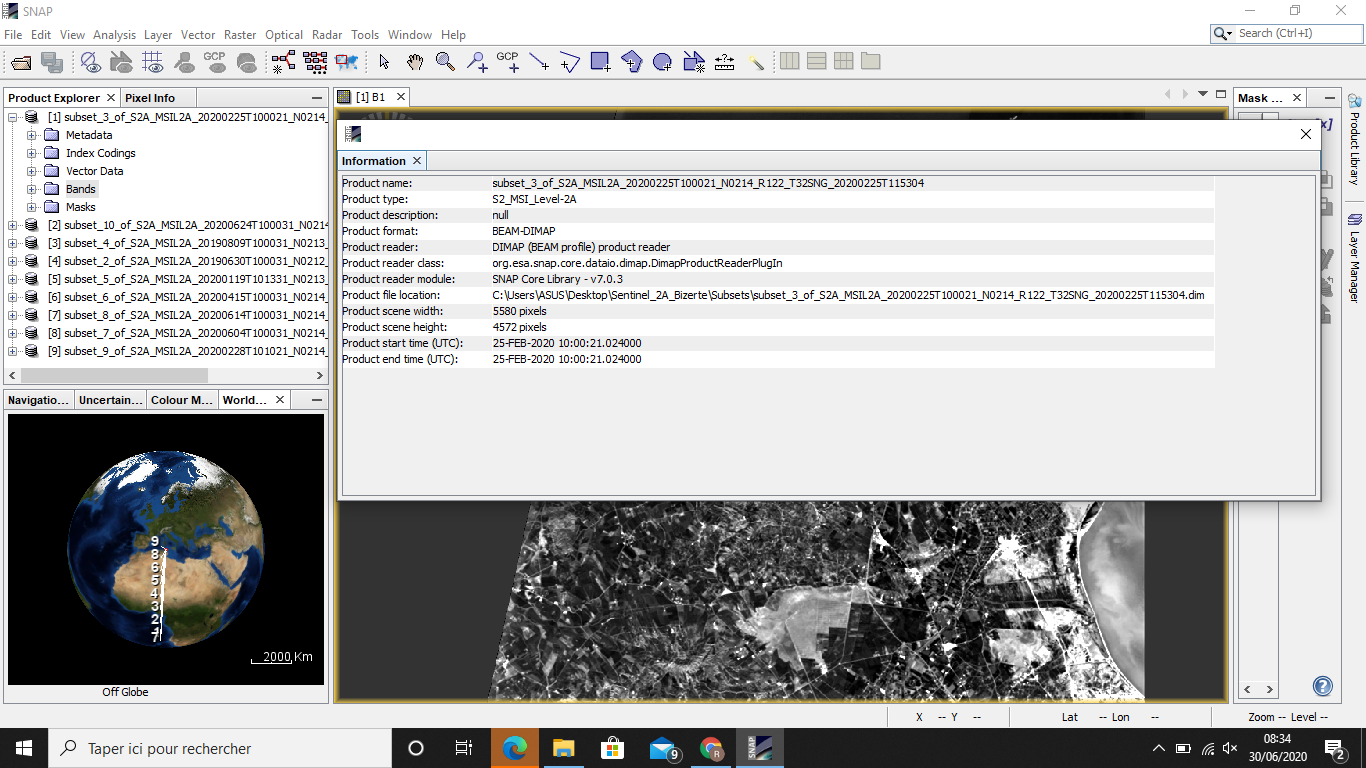
Does the file name column contains the raw data or NDVI?
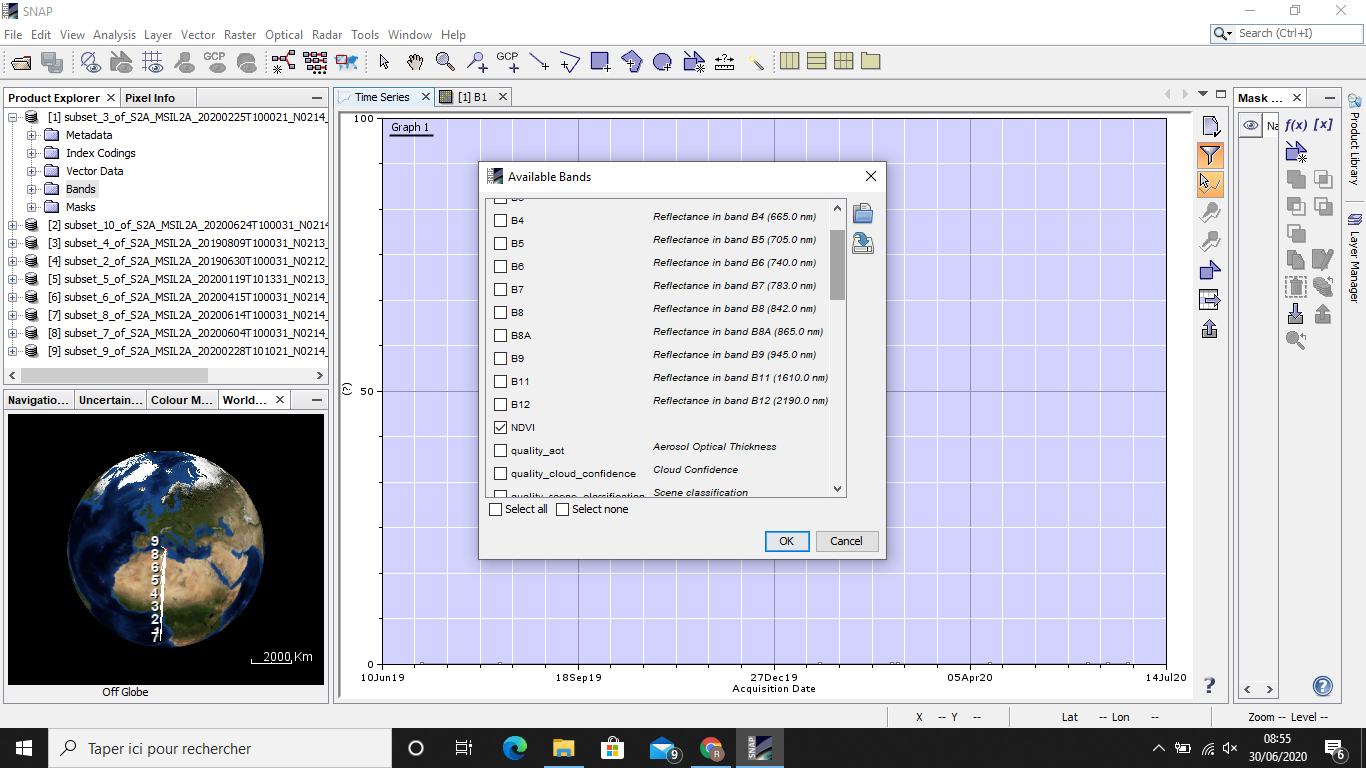
you enter the S2 products which include an NDVI band.
with the Filter tool ![]()
A tutorial on time-series analysis will be published soon.
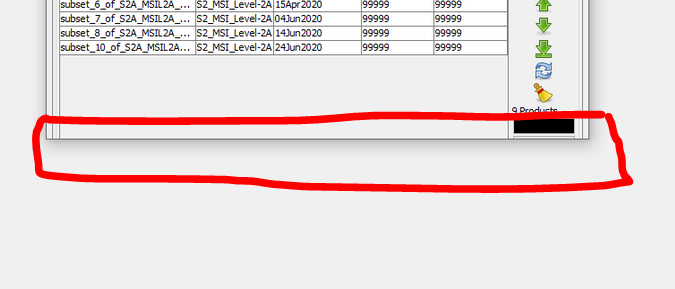
You first have to click “Apply”
The button is at the bottom of the window, you have to enlarge it to see the button.
Ofcourse, I did click on Apply and then closed the window but the filter tool is still grey
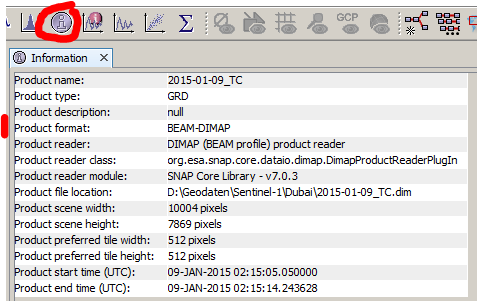
what bands are contained in the loaded products and in which format are they stored?
All sentinel bands except for B10, not sure about the format (how to check that?).
if you did not change anything, the products are stored as BEAM DIMAP.
To use the filter tool (and the entire time-series analysis tool), a band must be opened in the view.
please also check this

you have to move your mouse over the image, otherwise SNAP does not know which pixel to plot.
If I pin some areas (point locations) will I be able to plot NDVI time series for that point ?
I think you have to create a stack for this and use the Pin Manager to extract all values in the stack.
Can you elaborate on that please?
The use of the pin manager is described here: https://www.youtube.com/watch?v=5znAQH6vrLs
Please also use the search function of this forum, many things are already well explained in other topics.